
GBP/JPY holds firm near highs as Oil-driven Yen weakness keeps bulls in control
Par Vishal Chaturvedi
Mis à jour: 20 Apr 2026


ARTICLES POPULAIRES

The British Pound (GBP) edges higher against the Japanese Yen (JPY) on Monday, with GBP/JPY snapping a two-day losing streak as renewed tensions in the Strait of Hormuz keep Oil prices elevated and the Yen on the defensive, given Japan’s heavy reliance on imported energy.
- GBP/JPY edges higher on Monday, snapping a two-day losing streak as Oil-driven Yen weakness persists.
- Strait of Hormuz flare-up keeps energy prices elevated, weighing on Japan’s import-heavy economy.
- Technically, GBP/JPY maintains a bullish bias on the daily chart, holding above the 21-day and 100-day SMAs.
The British Pound (GBP) edges higher against the Japanese Yen (JPY) on Monday, with GBP/JPY snapping a two-day losing streak as renewed tensions in the Strait of Hormuz keep Oil prices elevated and the Yen on the defensive, given Japan’s heavy reliance on imported energy.
At the time of writing, the cross is trading around 214.78 after hitting its highest level since July 2008 at 215.91 last week.
The move follows a fresh flare-up over the weekend after a brief reopening of the Strait of Hormuz was reversed. Iran reasserted control over the key shipping route, citing the ongoing US naval blockade of its ports as a violation of ceasefire terms, while the US Navy intercepted and boarded an Iranian cargo vessel in the Gulf of Oman.
Rising Oil prices are also complicating the monetary policy outlook, as higher energy costs keep inflation risks elevated. For the UK, this could prompt the Bank of England (BoE) to delay rate cuts and keep policy tighter for longer.
In Japan, the outlook is more nuanced. While persistent inflation pressures could keep the Bank of Japan (BoJ) on a gradual tightening path, the potential drag on growth from higher import costs may slow the pace of policy normalization.
According to a Reuters report on Monday, the BoJ is likely to hold off on raising interest rates at its upcoming meeting, as fading prospects for a near-term resolution to the Middle East conflict continue to cloud the country’s economic and inflation outlook.
Looking ahead, traders will closely monitor geopolitical developments for fresh direction. On the data front, the UK economic calendar is packed with high-impact releases this week, including labor market data, inflation figures, and Retail Sales, while Japan’s National CPI will also be in focus.
These releases could provide additional cues on the monetary policy outlook for both the BoE and the BoJ, and are likely to drive near-term price action in GBP/JPY.
Technical Analysis:
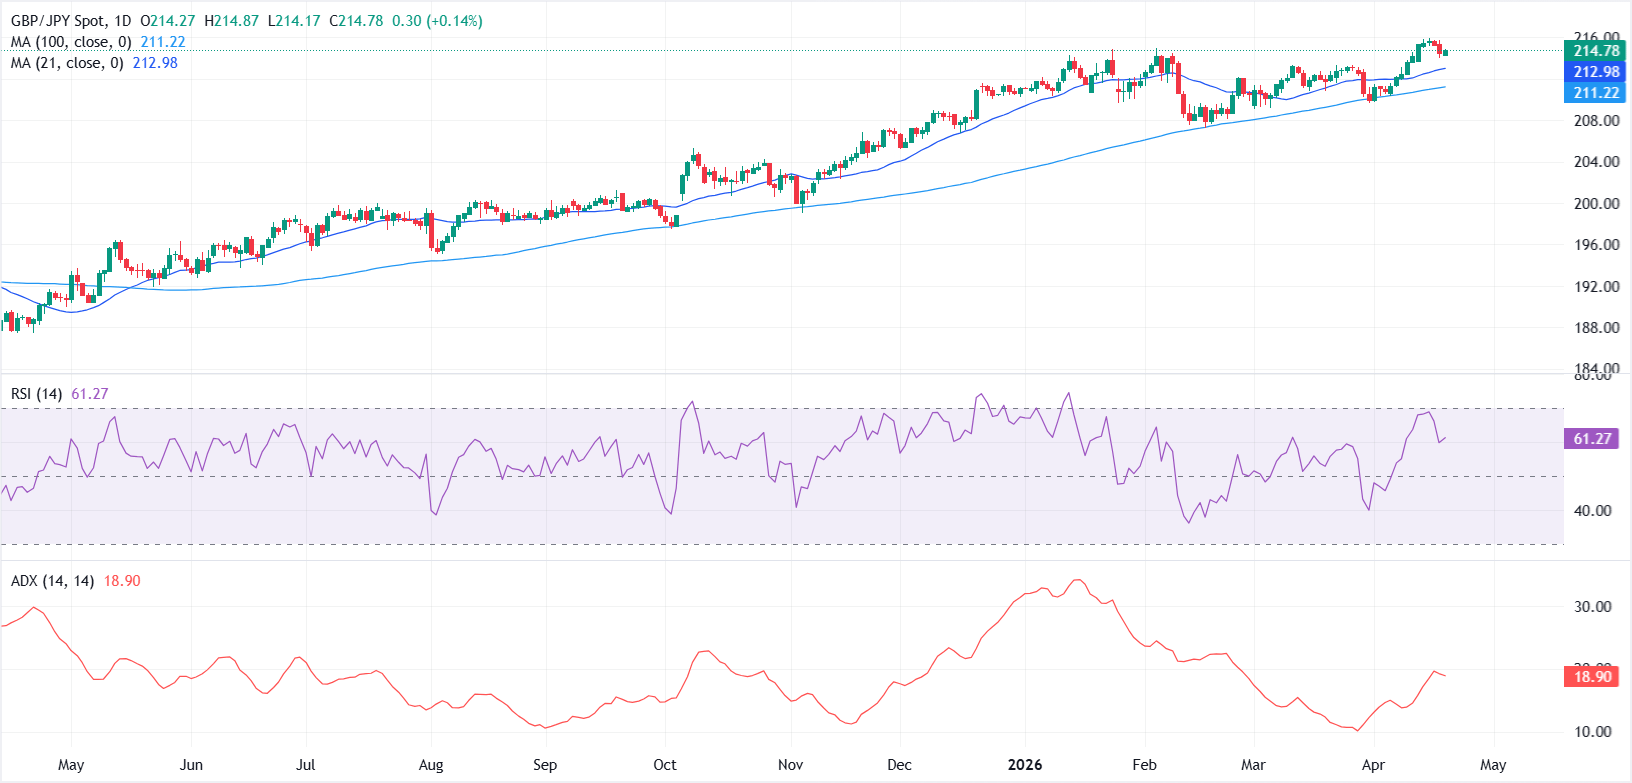
In the daily chart, GBP/JPY extends its advance above the 21-day simple moving average (SMA) at 212.98 and the 100-day SMA at 211.21, which both now underpin a constructive near-term bias.
The Relative Strength Index (RSI) at 60.82 leans bullish without yet signaling overbought conditions, while the Average Directional Index (ADX) at 18.90 suggests the uptrend is present but not strongly developed, leaving room for further directional extension if buyers maintain control.
On the downside, initial support is located at the 21-day SMA around 212.98, with a deeper corrective floor emerging at the 100-day SMA near 211.21 if profit-taking accelerates. As long as the pair holds above these moving-average supports, the technical outlook favors additional upside, with any dips toward the 213.00–211.00 region likely to attract renewed demand rather than signaling a full-fledged trend reversal.
(The technical analysis of this story was written with the help of an AI tool.)
Japanese Yen Price Today
The table below shows the percentage change of Japanese Yen (JPY) against listed major currencies today. Japanese Yen was the strongest against the Australian Dollar.
| USD | EUR | GBP | JPY | CAD | AUD | NZD | CHF | |
|---|---|---|---|---|---|---|---|---|
| USD | 0.02% | 0.02% | 0.21% | 0.03% | 0.20% | 0.11% | -0.05% | |
| EUR | -0.02% | 0.00% | 0.15% | -0.01% | 0.17% | 0.10% | -0.09% | |
| GBP | -0.02% | -0.00% | 0.15% | 0.02% | 0.17% | 0.10% | -0.10% | |
| JPY | -0.21% | -0.15% | -0.15% | -0.13% | 0.03% | -0.10% | -0.24% | |
| CAD | -0.03% | 0.01% | -0.02% | 0.13% | 0.16% | 0.05% | -0.11% | |
| AUD | -0.20% | -0.17% | -0.17% | -0.03% | -0.16% | -0.09% | -0.28% | |
| NZD | -0.11% | -0.10% | -0.10% | 0.10% | -0.05% | 0.09% | -0.18% | |
| CHF | 0.05% | 0.09% | 0.10% | 0.24% | 0.11% | 0.28% | 0.18% |
The heat map shows percentage changes of major currencies against each other. The base currency is picked from the left column, while the quote currency is picked from the top row. For example, if you pick the Japanese Yen from the left column and move along the horizontal line to the US Dollar, the percentage change displayed in the box will represent JPY (base)/USD (quote).

Plus d’un million d’utilisateurs se tournent vers FXStreet pour des données de marché en temps réel, des outils de graphiques, des analyses d’experts et des actualités Forex. Leur calendrier économique complet et leurs webinaires éducatifs aident les traders à rester informés et à prendre des décisions éclairées. FXStreet s’appuie sur une équipe d’environ 60 professionnels répartis entre le siège de Barcelone et diverses régions du monde.
Lire la suite


