
GBP/JPY Price Forecast: Ascending triangle puts YTD high in play
Par Christian Borjon Valencia
Mis à jour: 29 Jun 2026


ARTICLES POPULAIRES

The Pound Sterling advances against the Japanese Yen on Monday, up 0.59% amid fears for a possible intervention by Japanese authorities in the foreign exchange markets. At the time of writing, the GBP/JPY trades at 214.78, bouncing off daily lows of 213.41.
- GBP/JPY forms ascending triangle near yearly highs.
- RSI clears 50, signaling bullish momentum is accelerating.
- Break above 215.00 exposes 216.00 and 216.60 resistance.
The Pound Sterling advances against the Japanese Yen on Monday, up 0.59% amid fears for a possible intervention by Japanese authorities in the foreign exchange markets. At the time of writing, the GBP/JPY trades at 214.78, bouncing off daily lows of 213.41.
GBP/JPY Price Forecast: Technical Outlook
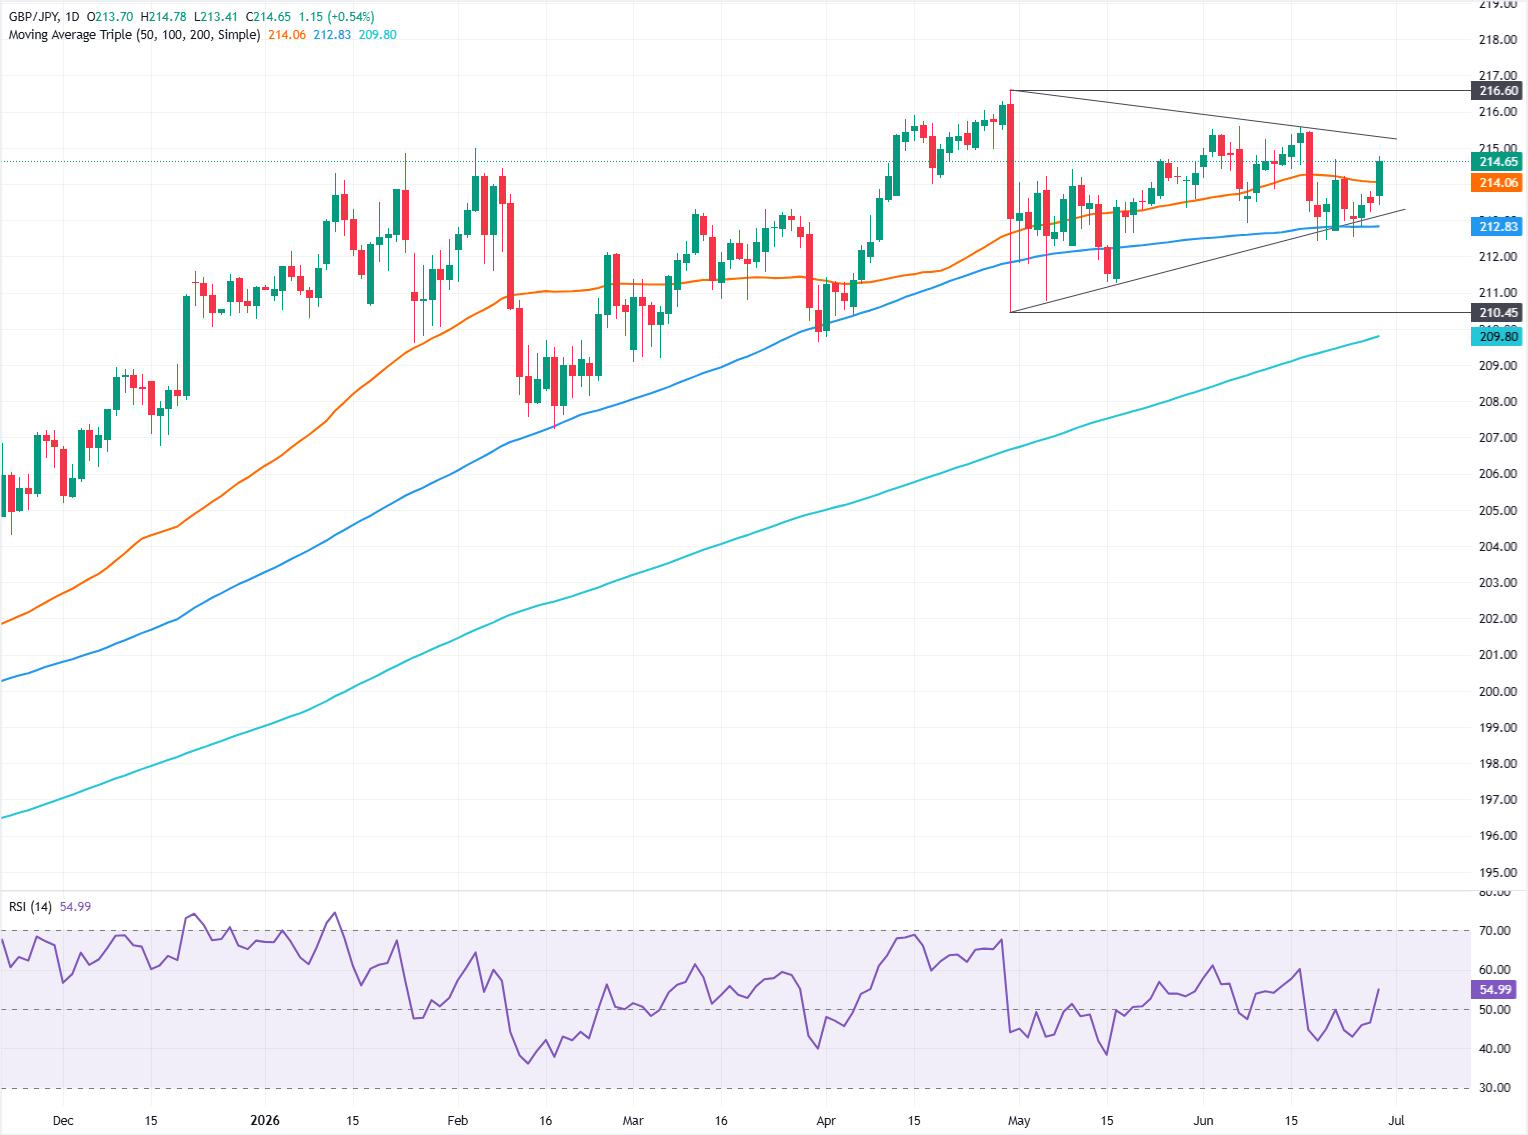
The cross-pair consolidates near the year highs, forming an ‘ascending triangle’, which could open the door for further upside. The GBP/JPY has reclaimed the 50-day Simple Moving Average (SMA) at 214.06, which has exacerbated the rally towards the current spot price of 215.00.
Momentum, as measured by the Relative Strength Index (RSI), turned bullish exponentially, clearing the 50-neutral level and heading toward the 55.00 mark. The path of least resistance is tilted to the upside, if not for the potential intervention.
The first resistance for GBP/JPY would be 215.00. A breach of the latter will expose the 215.40-215.50 area ahead of 216.00. Above this area, the next resistance is the year-to-date (YTD) high at 216.60.
Downwards, the first support is the 50-day SMA at 214.06. If breached, the next support would be the 213.00 mark ahead of the 100-day SMA at 212.83.
GBP/JPY Price Chart – Daily
Japanese Yen Price Today
The table below shows the percentage change of Japanese Yen (JPY) against listed major currencies today. Japanese Yen was the strongest against the Canadian Dollar.
| USD | EUR | GBP | JPY | CAD | AUD | NZD | CHF | |
|---|---|---|---|---|---|---|---|---|
| USD | -0.33% | -0.41% | 0.10% | 0.11% | 0.11% | -0.27% | -0.31% | |
| EUR | 0.33% | -0.11% | 0.46% | 0.46% | 0.47% | 0.10% | 0.05% | |
| GBP | 0.41% | 0.11% | 0.51% | 0.52% | 0.52% | 0.15% | 0.19% | |
| JPY | -0.10% | -0.46% | -0.51% | 0.00% | -0.00% | -0.32% | -0.41% | |
| CAD | -0.11% | -0.46% | -0.52% | -0.01% | 0.00% | -0.32% | -0.44% | |
| AUD | -0.11% | -0.47% | -0.52% | 0.00% | -0.00% | -0.37% | -0.34% | |
| NZD | 0.27% | -0.10% | -0.15% | 0.32% | 0.32% | 0.37% | -0.03% | |
| CHF | 0.31% | -0.05% | -0.19% | 0.41% | 0.44% | 0.34% | 0.03% |
The heat map shows percentage changes of major currencies against each other. The base currency is picked from the left column, while the quote currency is picked from the top row. For example, if you pick the Japanese Yen from the left column and move along the horizontal line to the US Dollar, the percentage change displayed in the box will represent JPY (base)/USD (quote).

Plus d’un million d’utilisateurs se tournent vers FXStreet pour des données de marché en temps réel, des outils de graphiques, des analyses d’experts et des actualités Forex. Leur calendrier économique complet et leurs webinaires éducatifs aident les traders à rester informés et à prendre des décisions éclairées. FXStreet s’appuie sur une équipe d’environ 60 professionnels répartis entre le siège de Barcelone et diverses régions du monde.
Lire la suite


