
GBP/JPY Price Forecast: Long-term moving averages continue to support the uptrend
Par Vishal Chaturvedi
Mis à jour: 3 Jun 2026


ARTICLES POPULAIRES

GBP/JPY edges lower on Wednesday as fresh intervention warnings from Tokyo lift the Japanese Yen (JPY) across the board. At the time of writing, the cross trades around 214.82, down 0.25% on the day.
- GBP/JPY slips on Wednesday as fresh intervention warnings from Tokyo support the Japanese Yen.
- Japan’s PM Sanae Takaichi says authorities stand ready to act in the FX market if needed.
- Buyers remain in control as GBP/JPY holds above key moving averages and RSI stays above the neutral 50 mark.
GBP/JPY edges lower on Wednesday as fresh intervention warnings from Tokyo lift the Japanese Yen (JPY) across the board. At the time of writing, the cross trades around 214.82, down 0.25% on the day.
Japanese authorities are once again on alert as USD/JPY moves back toward the 160.00 mark, a level that previously prompted officials to intervene earlier in April.
Japan’s Prime Minister Sanae Takaichi said on Wednesday that authorities are ready “to take appropriate steps on FX as needed at any time.” Takaichi also said Japan would deepen international cooperation, including with the United States, on foreign exchange moves.
However, the bigger picture still favors further upside in GBP/JPY. The gap between UK and Japanese interest rates remains wide, while renewed hawkish central bank expectations, driven by Oil-related inflation concerns, could further widen the policy gap between the Bank of England (BoE) and the Bank of Japan (BoJ).
Technical indicators also continue to support the bullish outlook, with the cross maintaining a pattern of higher highs and higher lows while holding well above its key long-term moving averages.
Technical Analysis:
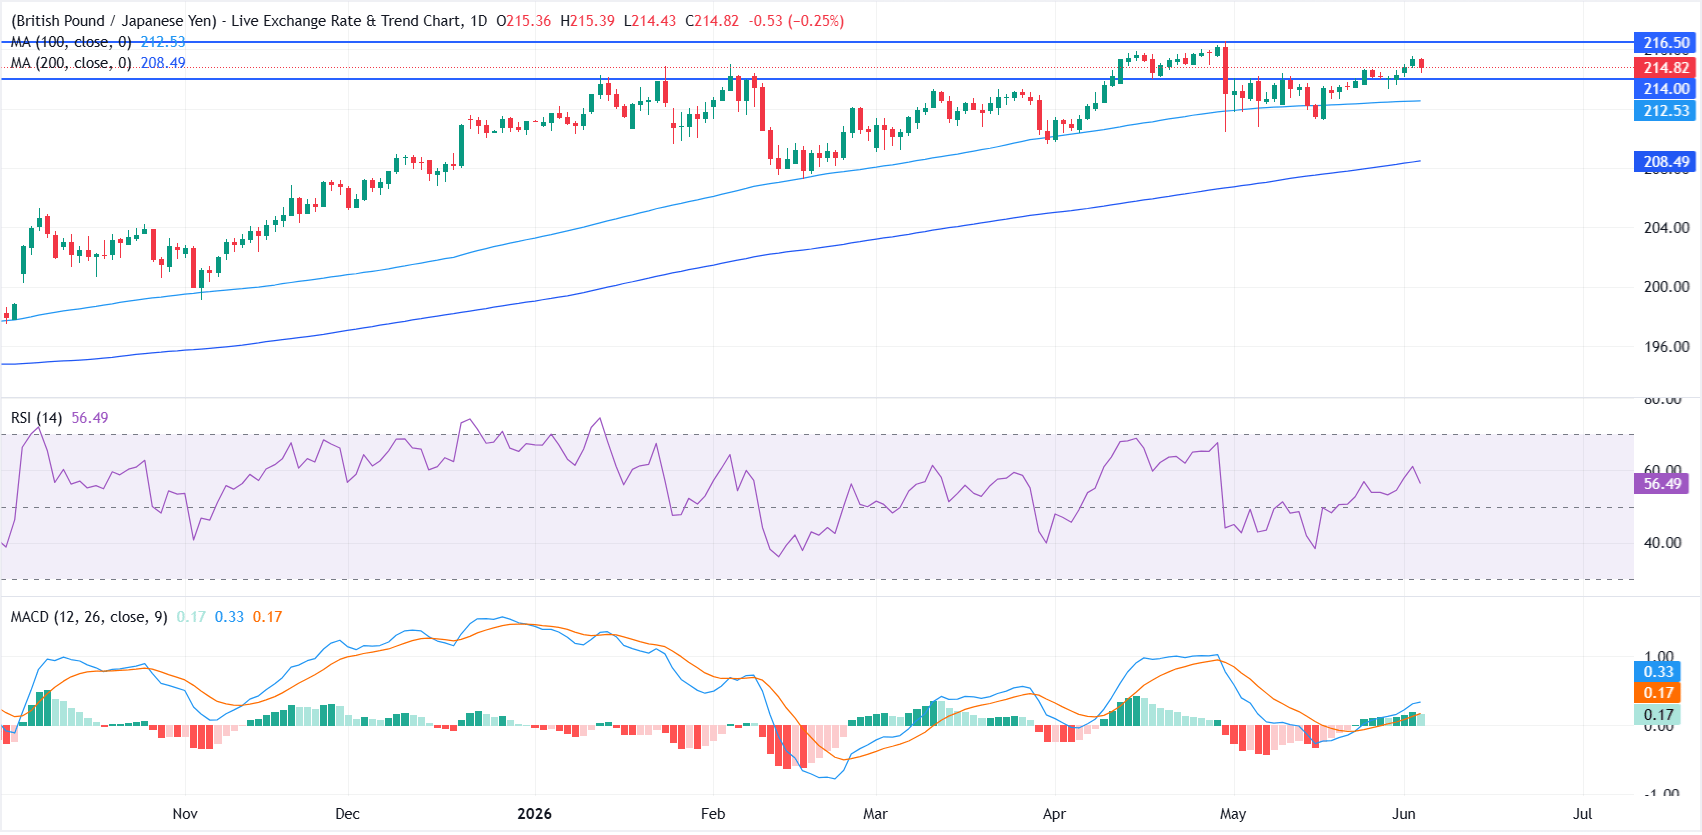
On the daily chart, GBP/JPY maintains a constructive bullish bias as it holds above the 100 and 200-day Simple Moving Averages (SMAs). The pair is also trading over the nearby horizontal support around 214.00, while the Relative Strength Index (RSI) hovers near 57 and the Moving Average Convergence Divergence (MACD) stays in positive territory, together suggesting that upside momentum is still intact but not yet overstretched.
On the topside, initial resistance is seen at the horizontal barrier near 216.50, where a clear break would open the way for a continuation of the broader advance. On the downside, the first layer of support emerges around 214.00, with the 100-day SMA at 212.54 and the 200-day SMA near 208.49 providing deeper structural cushions should a pullback develop.
(The technical analysis of this story was written with the help of an AI tool.)
Japanese Yen Price Today
The table below shows the percentage change of Japanese Yen (JPY) against listed major currencies today. Japanese Yen was the strongest against the New Zealand Dollar.
| USD | EUR | GBP | JPY | CAD | AUD | NZD | CHF | |
|---|---|---|---|---|---|---|---|---|
| USD | 0.28% | 0.28% | -0.02% | 0.23% | 0.43% | 0.74% | 0.41% | |
| EUR | -0.28% | -0.01% | -0.28% | -0.05% | 0.14% | 0.44% | 0.13% | |
| GBP | -0.28% | 0.01% | -0.26% | -0.05% | 0.15% | 0.44% | 0.14% | |
| JPY | 0.02% | 0.28% | 0.26% | 0.22% | 0.42% | 0.69% | 0.40% | |
| CAD | -0.23% | 0.05% | 0.05% | -0.22% | 0.20% | 0.50% | 0.18% | |
| AUD | -0.43% | -0.14% | -0.15% | -0.42% | -0.20% | 0.30% | -0.04% | |
| NZD | -0.74% | -0.44% | -0.44% | -0.69% | -0.50% | -0.30% | -0.30% | |
| CHF | -0.41% | -0.13% | -0.14% | -0.40% | -0.18% | 0.04% | 0.30% |
The heat map shows percentage changes of major currencies against each other. The base currency is picked from the left column, while the quote currency is picked from the top row. For example, if you pick the Japanese Yen from the left column and move along the horizontal line to the US Dollar, the percentage change displayed in the box will represent JPY (base)/USD (quote).

Plus d’un million d’utilisateurs se tournent vers FXStreet pour des données de marché en temps réel, des outils de graphiques, des analyses d’experts et des actualités Forex. Leur calendrier économique complet et leurs webinaires éducatifs aident les traders à rester informés et à prendre des décisions éclairées. FXStreet s’appuie sur une équipe d’environ 60 professionnels répartis entre le siège de Barcelone et diverses régions du monde.
Lire la suite


