
GBP/JPY Price Forecast: Struggles at 211.00 as hanging man emerges
Par Christian Borjon Valencia
Mis à jour: 2 Apr 2026


ARTICLES POPULAIRES

The GBP/JPY consolidates at around 211.00 as risk appetite turned sour due to increasing tensions in the Middle East after US President Donald Trump revealed that the US forces' mission would extend between two and three weeks.
- GBP/JPY steadies near 211.00 as geopolitical tensions weigh on sentiment.
- RSI below 50 signals bearish momentum remains firmly in control.
- Break below 210.34 exposes 210.00 and 209.63 support levels.
The GBP/JPY consolidates at around 211.00 as risk appetite turned sour due to increasing tensions in the Middle East after US President Donald Trump revealed that the US forces' mission would extend between two and three weeks.
GBP/JPY Price Forecast: Technical Outlook
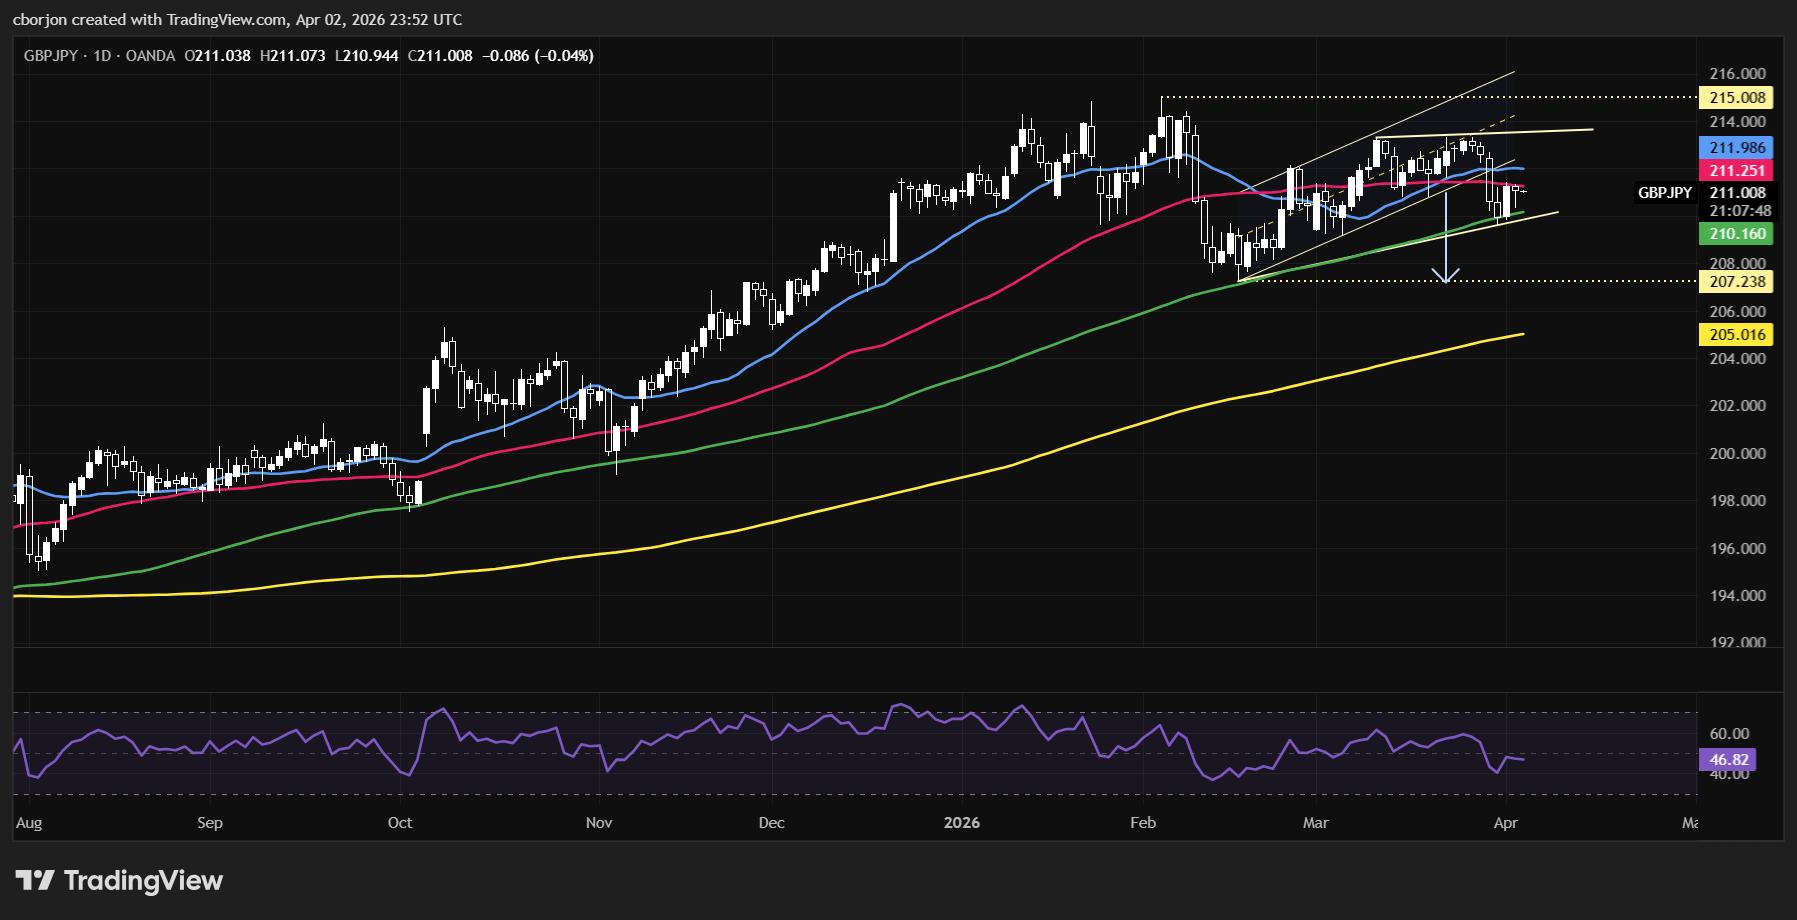
The GBP/JPY technical picture remains downwardly biased after exiting a bearish flag, though a failure to clear the 100-day Simple Moving Average (SMA) at 210.16 exacerbated a recovery towards 211.00. Momentum as measured by the Relative Strength Index (RSI) shows that sellers are in charge, as the index remains below its neutral level.
For a bullish continuation, a clear break of the 50-day SMA opens the door to challenge the 20-day SMA at 211.98. Once surpassed, the next stop will be 212.00, followed by the next cycle high seen at 213.31, the March 26 peak. On further strength, the next resistance is the yearly high at 215.00.
On the other hand, a drop below the April 2 daily low of 210.34 will expose the 210.00 figure, followed by the March 31 swing high at 209.63. Below here, the next area of interest will be the 207.23, the February 17 cycle low.
GBP/JPY Price Chart - Daily
Japanese Yen Price This week
The table below shows the percentage change of Japanese Yen (JPY) against listed major currencies this week. Japanese Yen was the strongest against the New Zealand Dollar.
| USD | EUR | GBP | JPY | CAD | AUD | NZD | CHF | |
|---|---|---|---|---|---|---|---|---|
| USD | -0.33% | 0.24% | -0.40% | 0.25% | -0.66% | 0.56% | 0.28% | |
| EUR | 0.33% | 0.57% | -0.13% | 0.59% | -0.33% | 0.90% | 0.62% | |
| GBP | -0.24% | -0.57% | -0.63% | 0.01% | -0.90% | 0.33% | -0.01% | |
| JPY | 0.40% | 0.13% | 0.63% | 0.68% | -0.22% | 0.99% | 0.60% | |
| CAD | -0.25% | -0.59% | -0.01% | -0.68% | -0.94% | 0.31% | -0.03% | |
| AUD | 0.66% | 0.33% | 0.90% | 0.22% | 0.94% | 1.24% | 0.90% | |
| NZD | -0.56% | -0.90% | -0.33% | -0.99% | -0.31% | -1.24% | -0.34% | |
| CHF | -0.28% | -0.62% | 0.01% | -0.60% | 0.03% | -0.90% | 0.34% |
The heat map shows percentage changes of major currencies against each other. The base currency is picked from the left column, while the quote currency is picked from the top row. For example, if you pick the Japanese Yen from the left column and move along the horizontal line to the US Dollar, the percentage change displayed in the box will represent JPY (base)/USD (quote).

Plus d’un million d’utilisateurs se tournent vers FXStreet pour des données de marché en temps réel, des outils de graphiques, des analyses d’experts et des actualités Forex. Leur calendrier économique complet et leurs webinaires éducatifs aident les traders à rester informés et à prendre des décisions éclairées. FXStreet s’appuie sur une équipe d’environ 60 professionnels répartis entre le siège de Barcelone et diverses régions du monde.
Lire la suite


