
GBP/JPY slips as UK political turmoil fuels Yen demand
Par Christian Borjon Valencia
Date de publication: 10 Feb 2026 | Date de modification: 10 Feb 2026


ARTICLES POPULAIRES

The Pound Sterling retreats 0.21% during the North American session as political turmoil in the UK, surrounding the Prime Minister Keir Starmer, pushed the GBP/JPY downwards. At the time of writing, the cross-pair trades at 213.51 after reaching a daily high of 214.44.
- GBP/JPY slips as political uncertainty around Keir Starmer weighs on Pound sentiment.
- Bulls stall near 214.00 after repeated failures to push toward yearly highs above 215.00.
- RSI prints lower highs, signaling fading momentum and rising downside risk toward key moving averages.
The Pound Sterling retreats 0.21% during the North American session as political turmoil in the UK, surrounding the Prime Minister Keir Starmer, pushed the GBP/JPY downwards. At the time of writing, the cross-pair trades at 213.51 after reaching a daily high of 214.44.
GBP/JPY Price Forecast: Technical outlook
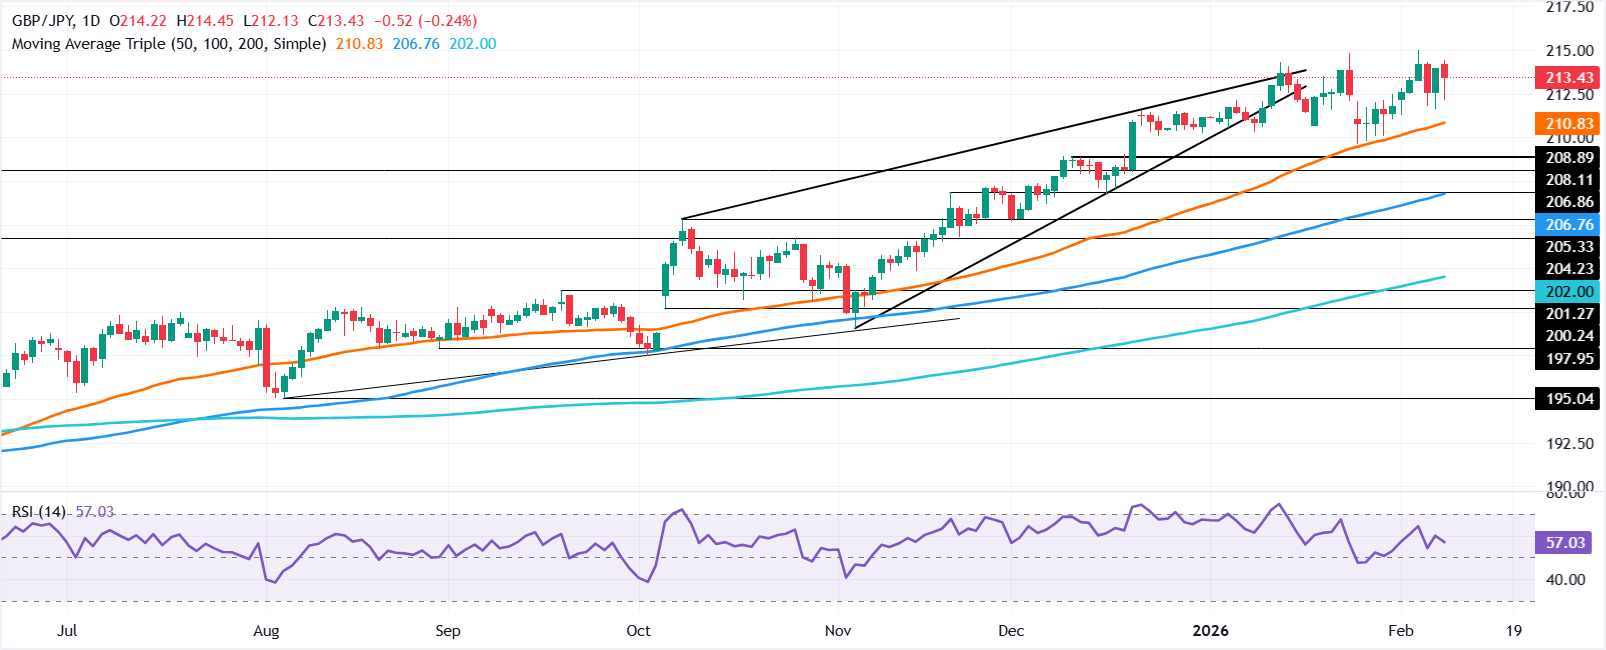
During the last four trading days, the GBP/JPY achieved successive daily highs near 213.80, with the pair unable to crack decisively the 214.00 figure. At the same time, the pair dipped to a five-day low of 211.61, before resuming upwards but so far bulls lacked the strength to break to new yearly highs past the current one at 215.00. A breach of the latter will expose the 215.50 figure, followed by 216.00.
From a momentum standpoint, the Relative Strength Index (RSI) recorded successive series of lower highs, an indication that sellers are gathering momentum.
If the GBP/JPY drops below 213.00, the immediate support would be the 20-day Simple Moving Average (SMA) at 212.57. Once surpassed the next stop would be the 50-day SMA at 210.80.
GBP/JPY Daily Chart
Japanese Yen Price This week
The table below shows the percentage change of Japanese Yen (JPY) against listed major currencies this week. Japanese Yen was the strongest against the British Pound.
| USD | EUR | GBP | JPY | CAD | AUD | NZD | CHF | |
|---|---|---|---|---|---|---|---|---|
| USD | 0.02% | 0.00% | 0.00% | -0.00% | -0.01% | -0.01% | 0.02% | |
| EUR | -0.02% | 0.00% | -0.04% | -0.03% | -0.02% | -0.01% | 0.02% | |
| GBP | -0.01% | -0.00% | -0.04% | -0.04% | -0.01% | -0.01% | 0.01% | |
| JPY | 0.00% | 0.04% | 0.04% | 0.00% | -0.01% | -0.01% | 0.03% | |
| CAD | 0.00% | 0.03% | 0.04% | -0.00% | -0.00% | 0.00% | 0.03% | |
| AUD | 0.01% | 0.02% | 0.01% | 0.00% | 0.00% | 0.00% | 0.08% | |
| NZD | 0.01% | 0.00% | 0.00% | 0.00% | -0.00% | -0.01% | 0.02% | |
| CHF | -0.02% | -0.02% | -0.01% | -0.03% | -0.03% | -0.08% | -0.02% |
The heat map shows percentage changes of major currencies against each other. The base currency is picked from the left column, while the quote currency is picked from the top row. For example, if you pick the Japanese Yen from the left column and move along the horizontal line to the US Dollar, the percentage change displayed in the box will represent JPY (base)/USD (quote).

Plus d’un million d’utilisateurs se tournent vers FXStreet pour des données de marché en temps réel, des outils de graphiques, des analyses d’experts et des actualités Forex. Leur calendrier économique complet et leurs webinaires éducatifs aident les traders à rester informés et à prendre des décisions éclairées. FXStreet s’appuie sur une équipe d’environ 60 professionnels répartis entre le siège de Barcelone et diverses régions du monde.
Lire la suite


