
Gold extends gains near two-week highs amid optimism over US–Iran war
Par Vishal Chaturvedi
Mis à jour: 1 Apr 2026


ARTICLES POPULAIRES

Gold (XAU/USD) edges higher on Wednesday, building on the previous day's solid gains as optimism grows that the US-Israel war with Iran could end soon. At the time of writing, XAU/USD is trading around $4,736, its highest level in nearly two weeks.
- Gold extends gains, trades near two-week highs on hopes of US-Iran war de-escalation.
- Softer US Dollar and lower Oil prices support XAU/USD as risk sentiment improves.
- XAU/USD breaks above the 50-period SMA on the 4-hour chart, with the 100-period SMA coming into focus.
Gold (XAU/USD) edges higher on Wednesday, building on the previous day's solid gains as optimism grows that the US-Israel war with Iran could end soon. At the time of writing, XAU/USD is trading around $4,736, its highest level in nearly two weeks.
US President Donald Trump, speaking from the Oval Office, told reporters that the United States “will be leaving Iran very soon,” adding that military action could end within “two or three weeks.” He said, “We’ll leave whether we have a deal or not.”
Meanwhile, Iranian President Masoud Pezeshkian said on Tuesday that his country has the “necessary will” to end the ongoing conflict, but is seeking guarantees to ensure the war does not happen again.
Risk sentiment improved across financial markets following these developments, pushing Oil prices, lowering the US Dollar (USD) from recent highs, and lifting Bullion.
However, tensions around the Strait of Hormuz persist, and Oil prices remain elevated compared to pre-conflict levels, keeping both inflation concerns and risks to economic growth in focus.
This, in turn, supports expectations that central banks, particularly the Federal Reserve (Fed), may keep interest rates higher for longer, raising the opportunity cost of holding non-yielding assets like Gold and could limit strong follow-through buying.
According to the CME FedWatch Tool, markets expect the Fed to keep interest rates steady at 3.50%-3.75% through 2026. If geopolitical tensions ease further and lead to a meaningful decline in Oil prices, expectations for Fed easing could return.
Looking ahead, traders will focus on key US economic data, including the ADP Employment Change for March, Retail Sales for February and the ISM Manufacturing Purchasing Managers Index (PMI) for March.
Speeches from Fed officials, including St.Louis Fed President Alberto Musalem and Fed Governor Michael Barr, will also be closely watched for cues on the monetary policy outlook. Attention will also be on Donald Trump, who is scheduled to address the nation at 01:00 GMT on Thursday to provide an important update on Iran.
Technical analysis: XAU/USD strengthens after triangle breakout
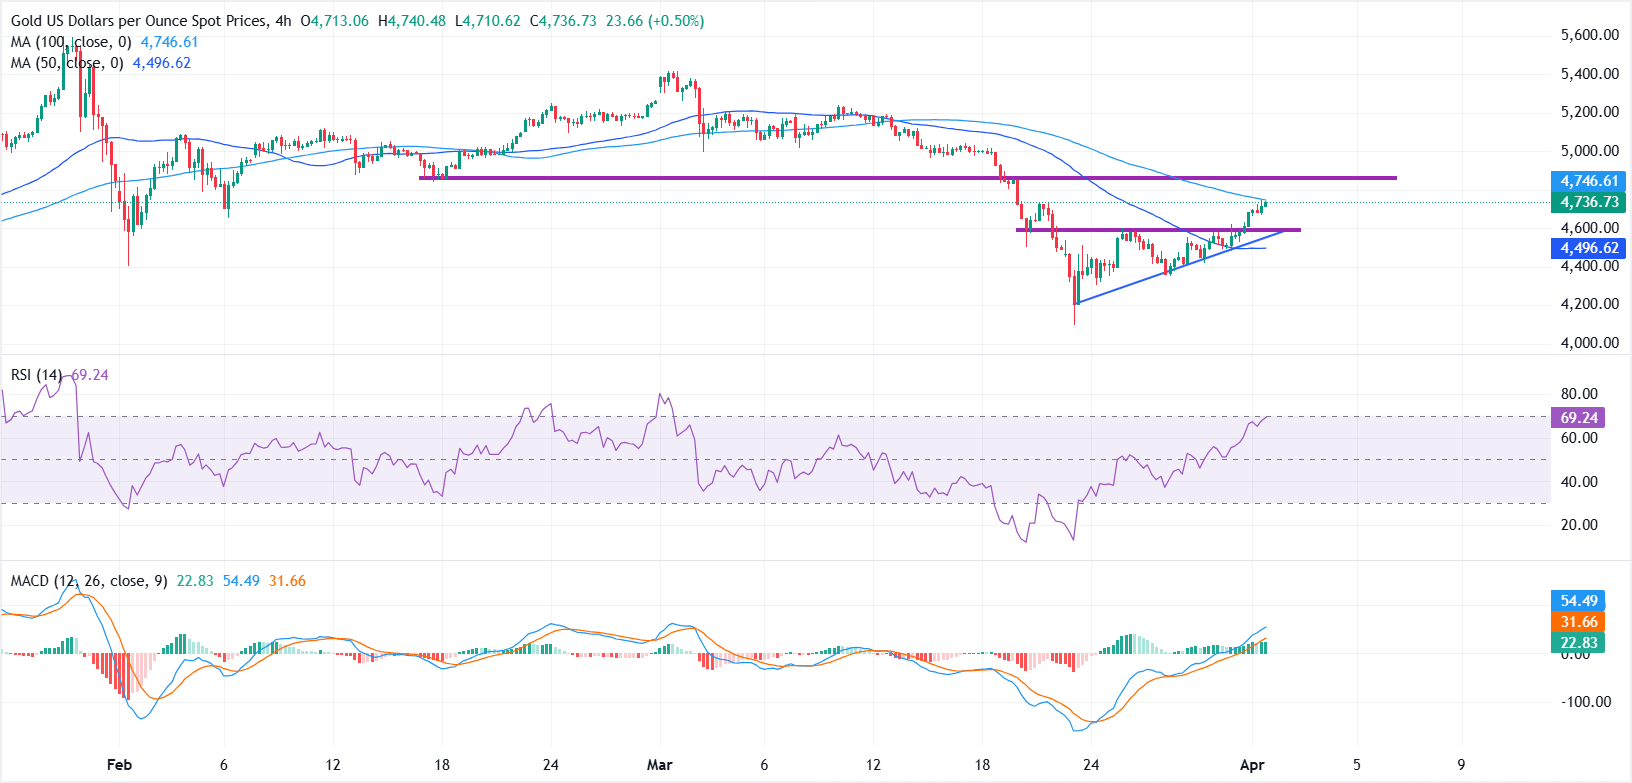
From a technical perspective, XAU/USD is gaining traction after climbing above the 50-period Simple Moving Average (SMA) on the 4-hour chart and breaking out of an ascending triangle pattern. Prices are now testing the 100-period SMA near $4,746, which is acting as immediate resistance.
Momentum indicators support the upside: the Relative Strength Index (RSI) is rising toward the overbought zone at 69, while the Moving Average Convergence Divergence (MACD) line remains above its signal and above the zero line with a positive histogram, suggesting firm buying pressure.
On the upside, a move above the 100-period SMA would expose the next resistance at $4,850, followed by the $5,000 psychological level. On the downside, the upper boundary of the ascending triangle near $4,600 is providing immediate support, ahead of the 50-period SMA at $4,496.

Plus d’un million d’utilisateurs se tournent vers FXStreet pour des données de marché en temps réel, des outils de graphiques, des analyses d’experts et des actualités Forex. Leur calendrier économique complet et leurs webinaires éducatifs aident les traders à rester informés et à prendre des décisions éclairées. FXStreet s’appuie sur une équipe d’environ 60 professionnels répartis entre le siège de Barcelone et diverses régions du monde.
Lire la suite


