
Gold extends recovery as Oil prices pull back on US-Iran ceasefire hopes
Par Vishal Chaturvedi
Mis à jour: 25 Mar 2026


ARTICLES POPULAIRES

Gold (XAU/USD) extends its recovery on Wednesday after falling to four-month lows earlier this week, as early buyers step in following a sharp selloff.
- Gold recovers for a second straight day, as softer Oil prices reduce pressure on global inflation expectations.
- Diplomatic efforts between the US and Iran offer cautious optimism, encouraging short-term buying.
- Technically, XAU/USD recovers from the 200-day SMA, with prices now approaching key resistance near the 100-day SMA.
Gold (XAU/USD) extends its recovery on Wednesday after falling to four-month lows earlier this week, as early buyers step in following a sharp selloff. The rebound comes as cautious optimism around diplomatic efforts in the ongoing US–Iran conflict has helped cool the surge in Oil prices, reducing immediate inflation concerns.
At the time of writing, XAU/USD is trading around $4,577, up nearly 2.38% on the day, marking its second straight day of gains after nine consecutive days of losses.
US ceasefire proposal in focus, Iran pushes back
On Tuesday, Israel’s Channel 12 reported that the United States had proposed a one-month ceasefire for negotiations, as Washington had sent Iran a 15-point plan aimed at ending the conflict.
Meanwhile, mediators from Turkey, Egypt, and Pakistan are pushing for a meeting between US and Iranian officials, with Axios reporting that high-level peace talks could take place as soon as Thursday, citing sources familiar with the discussions.
The proposal reportedly includes conditions such as limits on Iran’s nuclear program and keeping the Strait of Hormuz open in exchange for sanctions relief.
However, Iran downplayed the plan, with a top military spokesperson saying the US is “negotiating with itself,” adding that “someone like us will never come to terms with someone like you,” according to a video shared by the state-run Fars News Agency.
Oil cools from highs, but stays elevated
These mixed signals keep the broader outlook far from stable. Still, the recent drop in Oil prices is helping ease global inflation pressures, suggesting that central banks may not need to raise interest rates, which is supporting the non-yielding metal.
While Oil prices have pulled back from their recent peaks and are now fluctuating near recent lows, they remain elevated compared to pre-conflict levels, which continues to keep investors cautious about underlying inflation pressure.
West Texas Intermediate (WTI) is trading around $86.42, down about 1.6% on the day after a sharp pullback from near $100 earlier this week.
Unless a meaningful breakthrough in US-Iran negotiations leads to a sustained decline in Oil prices, the upside in Gold is likely to remain capped.
In the near term, Gold is expected to remain volatile as markets continue to react to shifting geopolitical headlines, energy price moves, and evolving expectations around global interest rates.
Technical analysis: XAU/USD tests 100-day SMA resistance after oversold bounce
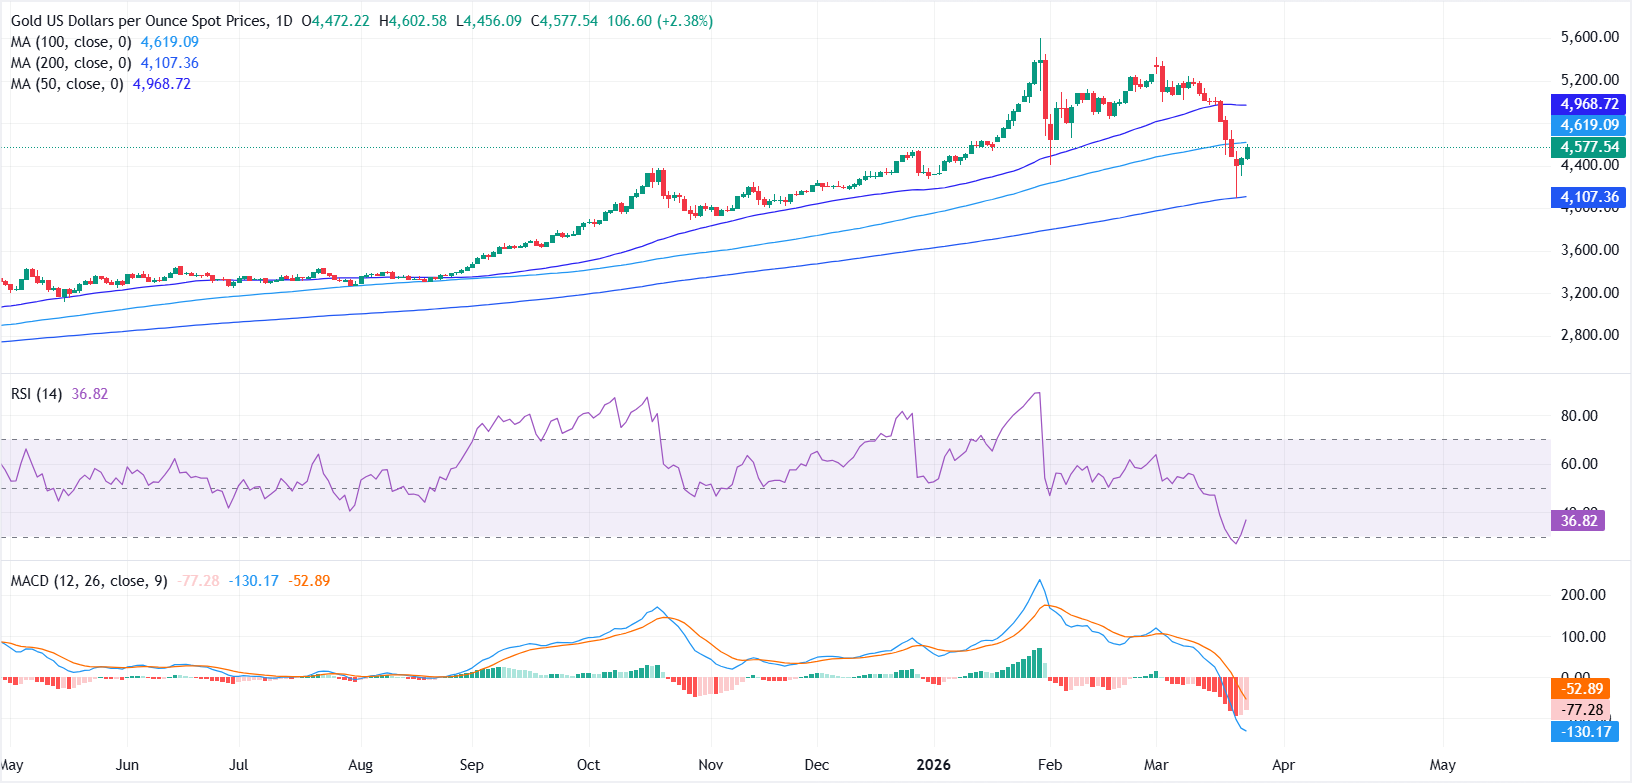
From a technical perspective, XAU/USD’s near-term tone appears constructive after bouncing off the 200-day Simple Moving Average (SMA), with prices now approaching the 100-day SMA, which is acting as immediate resistance.
Momentum indicators on the daily chart suggest that downside pressure is easing but not fully reversed. The Relative Strength Index (RSI) has rebounded from oversold levels below 30 to around 37, indicating a modest recovery in momentum while still reflecting underlying selling pressure.
Meanwhile, the Moving Average Convergence Divergence (MACD) remains below its signal line and under the zero line. Although negative momentum is starting to contract, the broader bias continues to favor sellers.
On the upside, a sustained break above the 100-day SMA near $4,619 could open the door toward the 50-day SMA around $4,968, which aligns closely with the $5,000 psychological level and is likely to cap further gains.
On the downside, immediate support is seen at Tuesday’s low near $4,306, followed by the 200-day SMA around $4,107.
Gold FAQs
Gold has played a key role in human’s history as it has been widely used as a store of value and medium of exchange. Currently, apart from its shine and usage for jewelry, the precious metal is widely seen as a safe-haven asset, meaning that it is considered a good investment during turbulent times. Gold is also widely seen as a hedge against inflation and against depreciating currencies as it doesn’t rely on any specific issuer or government.
Central banks are the biggest Gold holders. In their aim to support their currencies in turbulent times, central banks tend to diversify their reserves and buy Gold to improve the perceived strength of the economy and the currency. High Gold reserves can be a source of trust for a country’s solvency. Central banks added 1,136 tonnes of Gold worth around $70 billion to their reserves in 2022, according to data from the World Gold Council. This is the highest yearly purchase since records began. Central banks from emerging economies such as China, India and Turkey are quickly increasing their Gold reserves.
Gold has an inverse correlation with the US Dollar and US Treasuries, which are both major reserve and safe-haven assets. When the Dollar depreciates, Gold tends to rise, enabling investors and central banks to diversify their assets in turbulent times. Gold is also inversely correlated with risk assets. A rally in the stock market tends to weaken Gold price, while sell-offs in riskier markets tend to favor the precious metal.
The price can move due to a wide range of factors. Geopolitical instability or fears of a deep recession can quickly make Gold price escalate due to its safe-haven status. As a yield-less asset, Gold tends to rise with lower interest rates, while higher cost of money usually weighs down on the yellow metal. Still, most moves depend on how the US Dollar (USD) behaves as the asset is priced in dollars (XAU/USD). A strong Dollar tends to keep the price of Gold controlled, whereas a weaker Dollar is likely to push Gold prices up.

Plus d’un million d’utilisateurs se tournent vers FXStreet pour des données de marché en temps réel, des outils de graphiques, des analyses d’experts et des actualités Forex. Leur calendrier économique complet et leurs webinaires éducatifs aident les traders à rester informés et à prendre des décisions éclairées. FXStreet s’appuie sur une équipe d’environ 60 professionnels répartis entre le siège de Barcelone et diverses régions du monde.
Lire la suite


