
Gold lacks momentum amid rising yields and strong US Dollar
Par Vishal Chaturvedi
Mis à jour: 27 Mar 2026


ARTICLES POPULAIRES

Gold (XAU/USD) struggles to build on its gains on Friday as evolving geopolitical headlines surrounding the US-Israel war with Iran continue to drive volatility across global markets.
- Gold lacks upside momentum on Friday amid ongoing geopolitical tensions, keeping markets volatile.
- Oil-driven inflation risks lift interest rate hike expectations across major central banks.
- Technically, XAU/USD stabilizes around recent lows, but the near-term trend remains weak.
Gold (XAU/USD) struggles to build on its gains on Friday as evolving geopolitical headlines surrounding the US-Israel war with Iran continue to drive volatility across global markets. At the time of writing, XAU/USD is trading around $4,430 after reaching an intraday high near $4,475 during the European session.
Trump pauses strikes on Iran's energy plants, but uncertainty lingers
The initial gains came after US President Donald Trump announced a delay in planned military strikes targeting Iran’s energy infrastructure. The deadline, initially set to expire on Friday, has now been extended by 10 days. In a post on Truth Social, Trump said that “As per Iranian Government request” he would pause the strikes until “April 6, 2026, at 8 P.M., Eastern Time,” adding that “talks are ongoing.”
However, the move did little to calm market nerves. While the delay may reduce some immediate escalation risk, it offers limited clarity on a path toward resolution, particularly as Iran continues to push back against negotiations. Meanwhile, The Wall Street Journal reported on Thursday that the Pentagon is considering sending additional 10,000 ground troops to the Middle East, keeping the risk of further escalation alive if no resolution is reached.
Oil-driven inflation fears reshape interest rate expectations
The Strait of Hormuz remains a key focal point of the ongoing conflict and continues to face significant restrictions, keeping Oil prices elevated. Against this backdrop, Gold is behaving more like an interest rate-sensitive asset rather than a traditional haven, as Oil-driven inflation risks are prompting traders to price in potential rate hikes across major central banks, including the Federal Reserve (Fed), the European Central Bank (ECB), and the Bank of England (BoE).
According to the CME FedWatch Tool, markets are pricing out any rate cut this year and are betting on a 50% chance of higher borrowing costs by the end of 2026, compared with the 2-3 cuts projected before the US-Iran war started.
Firm US Dollar and rising yields weigh on Gold
The hawkish rate repricing of Fed rate cut expectations is pushing US Treasury yields higher across the board, with the 10-year benchmark rising to around 4.45%, its highest level since July 2025. This is weighing on Gold, as rising yields increase the opportunity cost of holding non-yielding assets.
At the same time, the US Dollar (USD) remains firmly bid amid escalating tensions, benefiting from its status as the world’s primary reserve currency, adding further pressure on the bullion. As both Oil and Gold are priced in USD, rising Oil prices tend to support the Greenback, making the metal more expensive for non-USD buyers.
Looking ahead, focus shifts to the University of Michigan’s March Consumer Sentiment and inflation expectations data. Fed speakers, including Richmond Fed President Tom Barkin, Philadelphia Fed President Anna Paulson, and San Francisco Fed President Mary Daly, will also be closely watched for clues on the monetary policy path.
Technical analysis: Sellers remain in control below key resistance levels
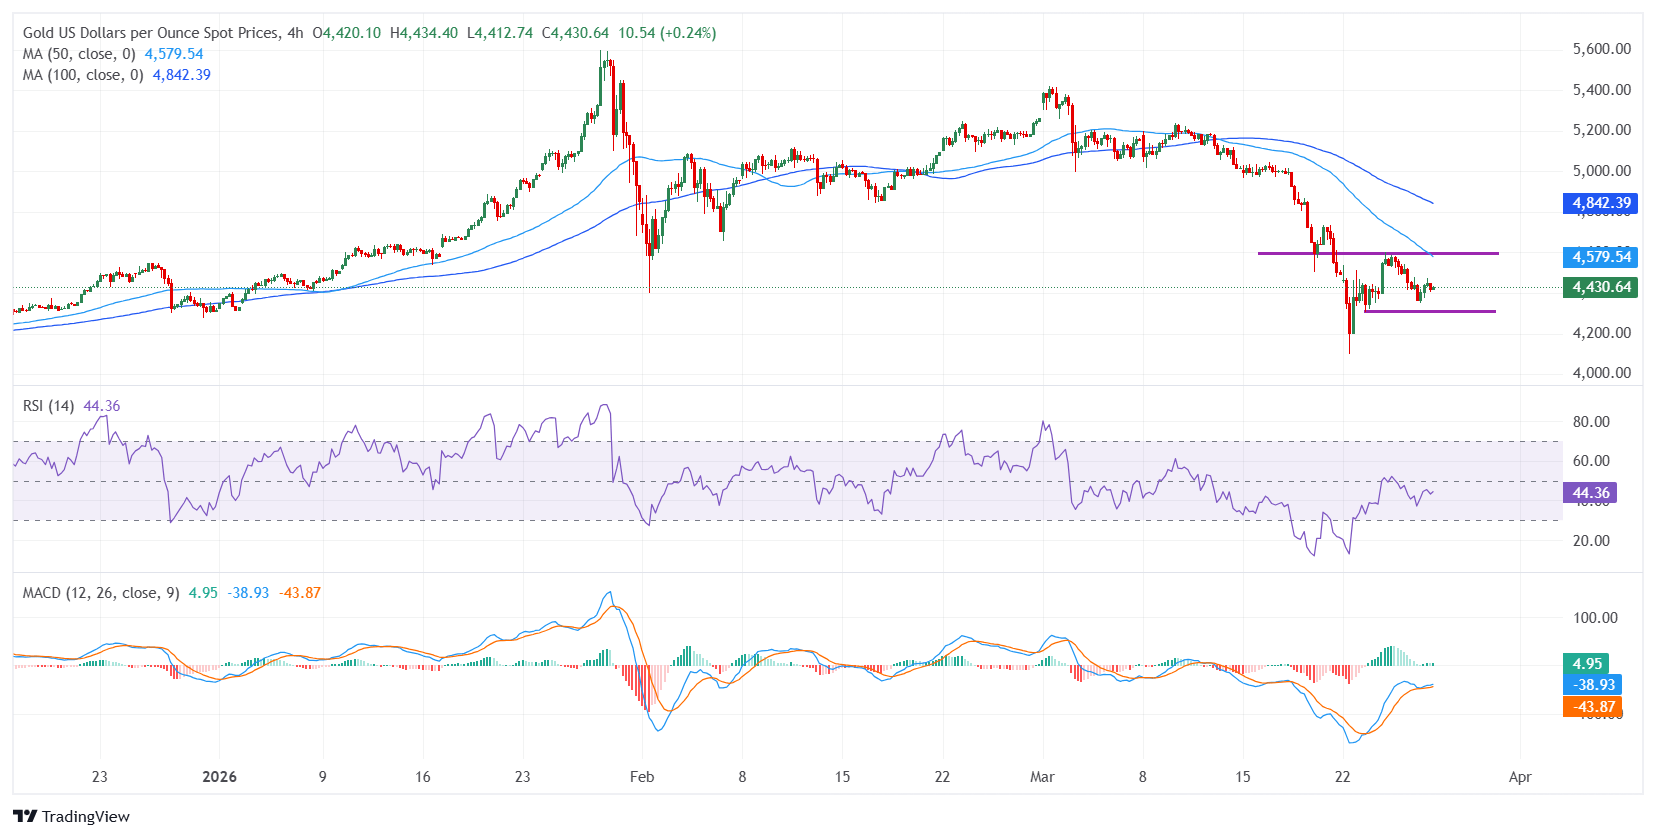
From a technical perspective, XAU/USD is showing early signs of stabilization after briefly slipping to four-month lows near $4,100 earlier this week. However, the near-term outlook remains tilted to the downside, with price trading below key moving averages on both the hourly and daily charts.
On the 4-hour chart, the bearish structure remains intact, with price holding below the 50- and 100-period Simple Moving Averages (SMA), both of which continue to slope lower, indicating persistent downside pressure.
The Relative Strength Index (RSI) is hovering in the low-to-mid 40s after recovering from oversold territory, suggesting selling pressure is easing but not reversed. The Moving Average Convergence Divergence (MACD) indicator trades in positive territory with the MACD line above the signal line, hinting at a corrective recovery within a broader downward structure rather than a clean trend shift.
On the upside, the 50-period SMA at $4,579 acts as immediate resistance, followed by the 100-period SMA near $4,842. On the downside, $4,300 serves as immediate support, with the weekly swing low around $4,098 as the next key level to watch.
US Dollar Price Today
The table below shows the percentage change of US Dollar (USD) against listed major currencies today. US Dollar was the strongest against the British Pound.
| USD | EUR | GBP | JPY | CAD | AUD | NZD | CHF | |
|---|---|---|---|---|---|---|---|---|
| USD | 0.22% | 0.40% | 0.06% | 0.04% | 0.05% | 0.14% | 0.33% | |
| EUR | -0.22% | 0.18% | -0.17% | -0.19% | -0.18% | -0.08% | 0.11% | |
| GBP | -0.40% | -0.18% | -0.34% | -0.37% | -0.36% | -0.26% | -0.07% | |
| JPY | -0.06% | 0.17% | 0.34% | -0.01% | -0.02% | 0.08% | 0.28% | |
| CAD | -0.04% | 0.19% | 0.37% | 0.00% | -0.01% | 0.11% | 0.29% | |
| AUD | -0.05% | 0.18% | 0.36% | 0.02% | 0.00% | 0.10% | 0.29% | |
| NZD | -0.14% | 0.08% | 0.26% | -0.08% | -0.11% | -0.10% | 0.19% | |
| CHF | -0.33% | -0.11% | 0.07% | -0.28% | -0.29% | -0.29% | -0.19% |
The heat map shows percentage changes of major currencies against each other. The base currency is picked from the left column, while the quote currency is picked from the top row. For example, if you pick the US Dollar from the left column and move along the horizontal line to the Japanese Yen, the percentage change displayed in the box will represent USD (base)/JPY (quote).

Plus d’un million d’utilisateurs se tournent vers FXStreet pour des données de marché en temps réel, des outils de graphiques, des analyses d’experts et des actualités Forex. Leur calendrier économique complet et leurs webinaires éducatifs aident les traders à rester informés et à prendre des décisions éclairées. FXStreet s’appuie sur une équipe d’environ 60 professionnels répartis entre le siège de Barcelone et diverses régions du monde.
Lire la suite


