
Hedera Price Analysis: Extends losses as bearish sentiment dominates
Par Manish Chhetri
Date de publication: 24 Feb 2026 | Date de modification: 24 Feb 2026


ARTICLES POPULAIRES

Hedera (HBAR) price extends its losses, trading below $0.103 at the time of writing on Tuesday after falling nearly 4% the previous day. Weakening on-chain and derivatives data support a bearish outlook alongside an unfavourable technical outlook, suggesting a deeper correction for HBAR.
- Hedera price trades in red on Tuesday after falling nearly 4% the previous day.
- On-chain and derivatives data support bearish sentiment with falling social dominance and open interest at very low levels.
- The technical outlook suggests the correction could extend to $0.090.
Hedera (HBAR) price extends its losses, trading below $0.103 at the time of writing on Tuesday after falling nearly 4% the previous day. Weakening on-chain and derivatives data support a bearish outlook alongside an unfavourable technical outlook, suggesting a deeper correction for HBAR.
On-chain and derivatives data show bearish bias
Santiment’s Social Dominance metric for Hedera supports a bearish outlook. The index measures the share of HBAR-related discussions across the cryptocurrency media. It has been in a downward trend since the end of December, falling again in February to 0.018% on Tuesday. This fall indicates fading market interest and weakening sentiment among HBAR investors.
 [08-1771905128932-1771905128933.53.14, 24 Feb, 2026].png)
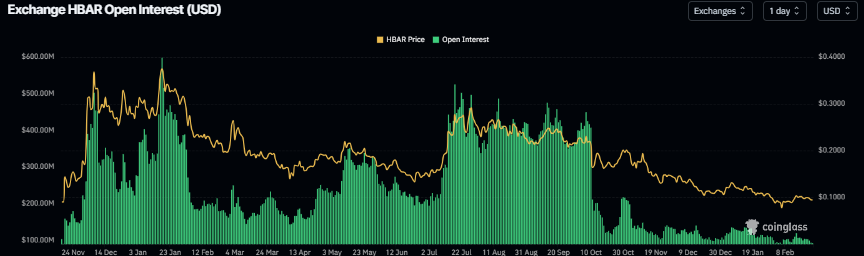
On the derivatives side, Hedera’s futures OI falls to $92.15 million on Tuesday, having been steadily declining since early January and nearing the February 6 level of $88.89 million. This drop in OI reflects waning investor participation and projects a bearish outlook.
Hedera Price Forecast: HBAR bears aiming for deeper correction
Hedera’s price was rejected around the 50-day Exponential Moving Average (EMA) at $0.103 on February 14 and declined 8.5% through Monday. This 50-day EMA level roughly coincides with the upper trendline of a falling wedge pattern (drawn by connecting multiple highs and lows from the end of June), making it a key resistance zone. As of writing on Tuesday, HBAR is trading at $0.094.
If HBAR continues its correction, it could extend the decline toward the weekly support at $0.090. A close below this level could extend the losses toward the next daily support level at $0.072, which aligns with the October 10 low.
The Relative Strength Index (RSI) on the daily chart is at 44, below the neutral level of 50 and pointing downward, indicating bearish momentum gaining traction. The Moving Average Convergence Divergence (MACD) lines are converging, indicating indecision among traders. If the MACD flips a bearish crossover, it would further support the bearish thesis.
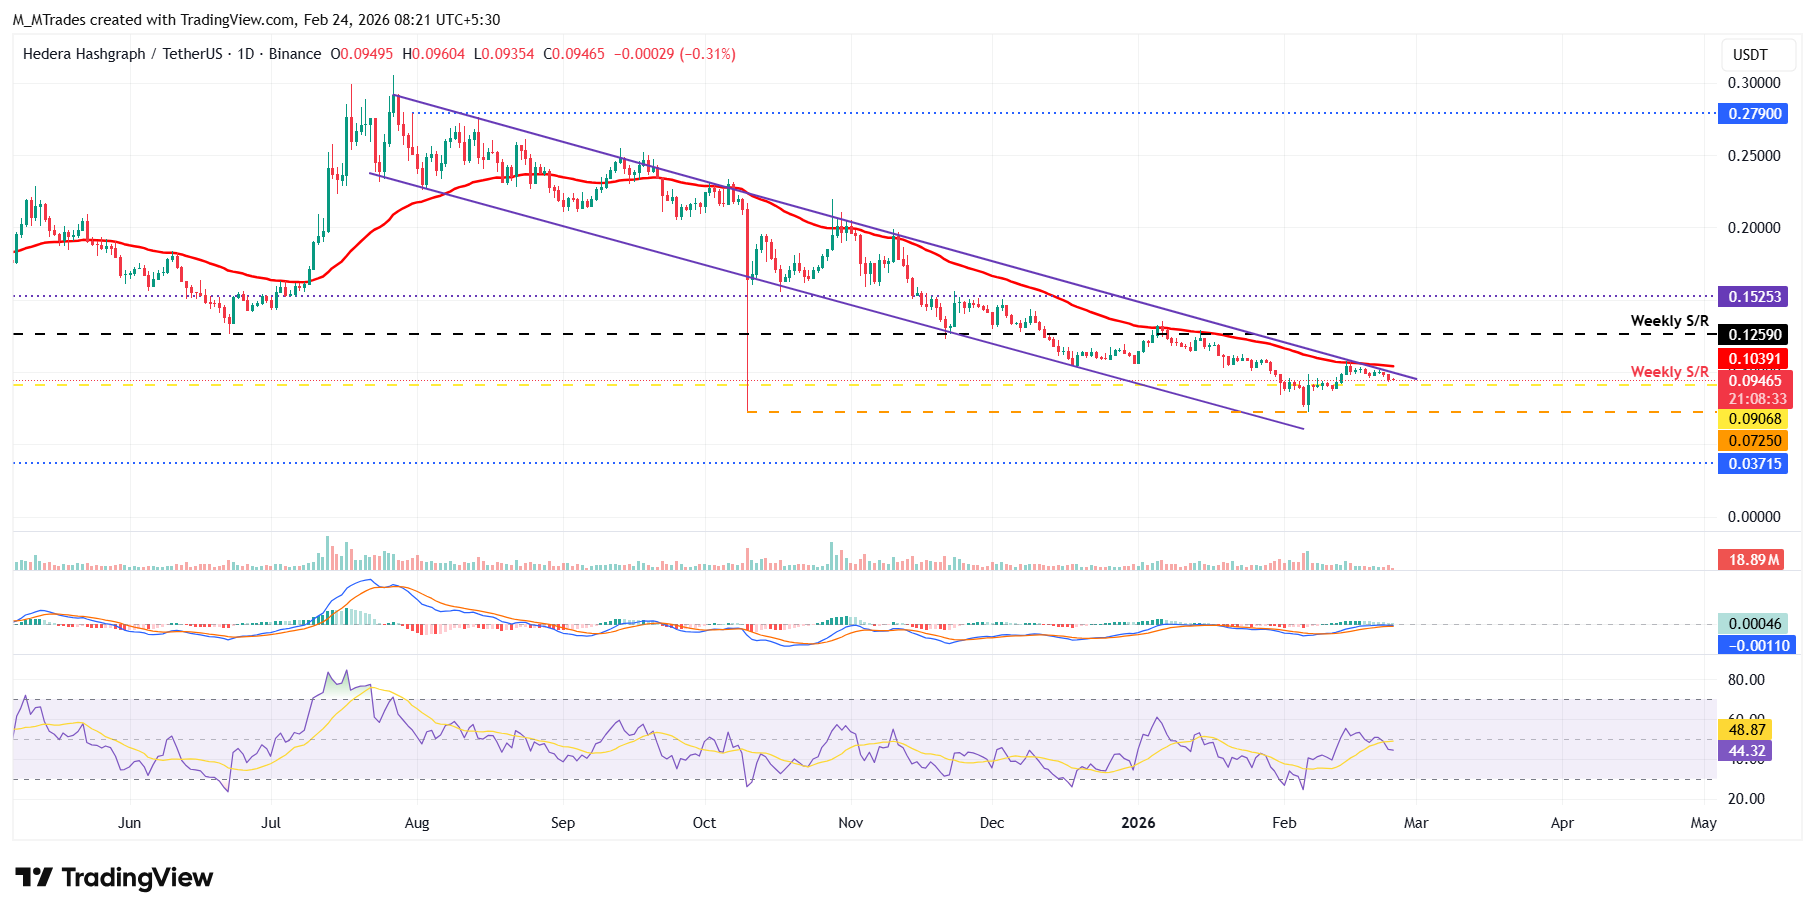
On the other side, if HBAR recovers, it could extend the advance toward the 50-day EMA at $0.103.

Plus d’un million d’utilisateurs se tournent vers FXStreet pour des données de marché en temps réel, des outils de graphiques, des analyses d’experts et des actualités Forex. Leur calendrier économique complet et leurs webinaires éducatifs aident les traders à rester informés et à prendre des décisions éclairées. FXStreet s’appuie sur une équipe d’environ 60 professionnels répartis entre le siège de Barcelone et diverses régions du monde.
Lire la suite


