
Litecoin Price Forecast: LTC slips below $75 as dormant wallet activity stirs selling pressure
Par Manish Chhetri
Date de publication: 15 Jan 2026 | Date de modification: 15 Jan 2026


ARTICLES POPULAIRES

Litecoin (LTC) price extends losses, trading below $75 at the time of writing on Thursday, after failing to break through the key resistance zone. The rising activity among the dormant wallets supports the bearish sentiment.
- Litecoin price slips below $75 on Thursday after failing to break through the key resistance zone.
- On-chain data indicates that dormant wallets are becoming active, a trend that could intensify selling pressure.
- The technical outlook shows a weakening of momentum, suggesting a deeper correction ahead.
Litecoin (LTC) price extends losses, trading below $75 at the time of writing on Thursday, after failing to break through the key resistance zone. The rising activity among the dormant wallets supports the bearish sentiment. Meanwhile, technical analysis suggests further downside, as momentum indicators continue to weaken.
Litecoin’s dormant wallets are on the move
Santiment's Age Consumed index, shown below, indicates bearish signals. The spikes in this index suggest dormant tokens (tokens stored in wallets for a long time) are in motion, and it can be used to spot short-term local tops or bottoms.
In the case of Litecoin, history shows that a decline followed the spikes in LTC’s price as holders moved their tokens from wallets to exchanges, thereby increasing selling pressure. The most recent uptick on Saturday suggested that Litecoin was ready for a downtrend.
 [09-1768455980667-1768455980668.49.09, 15 Jan, 2026].png)
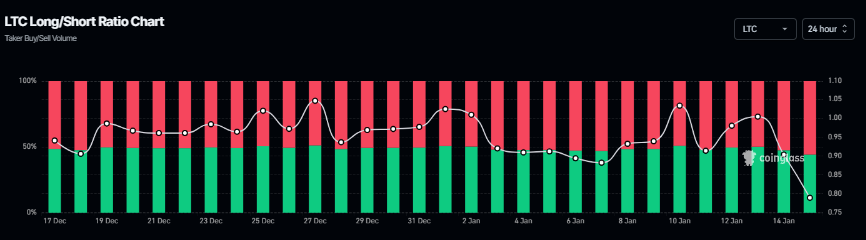
According to Coinglass data, the long-to-short ratio for Litecoin is 0.78. This ratio, below one, reflects bearish sentiment in the markets, as more traders are betting on the asset price to fall.
Litecoin Price Forecast: Momentum indicators show bearish signs
Litecoin price was rejected from the 50-day Exponential Moving Average (EMA) at $81.79 on Saturday and declined by over 6% through Wednesday. At the time of writing on Thursday, LTC is trading down at $74.52.
If LTC continues its downward trend, it could extend the decline toward the April 9 low of $66.51.
The Relative Strength Index (RSI) on the daily chart is 37, below its neutral level of 50, pointing downward toward oversold territory, indicating strong bearish momentum. Moreover, the Moving Average Convergence Divergence (MACD) showed a bearish crossover on Monday, with rising red histogram bars below the neutral level further supporting the negative outlook.
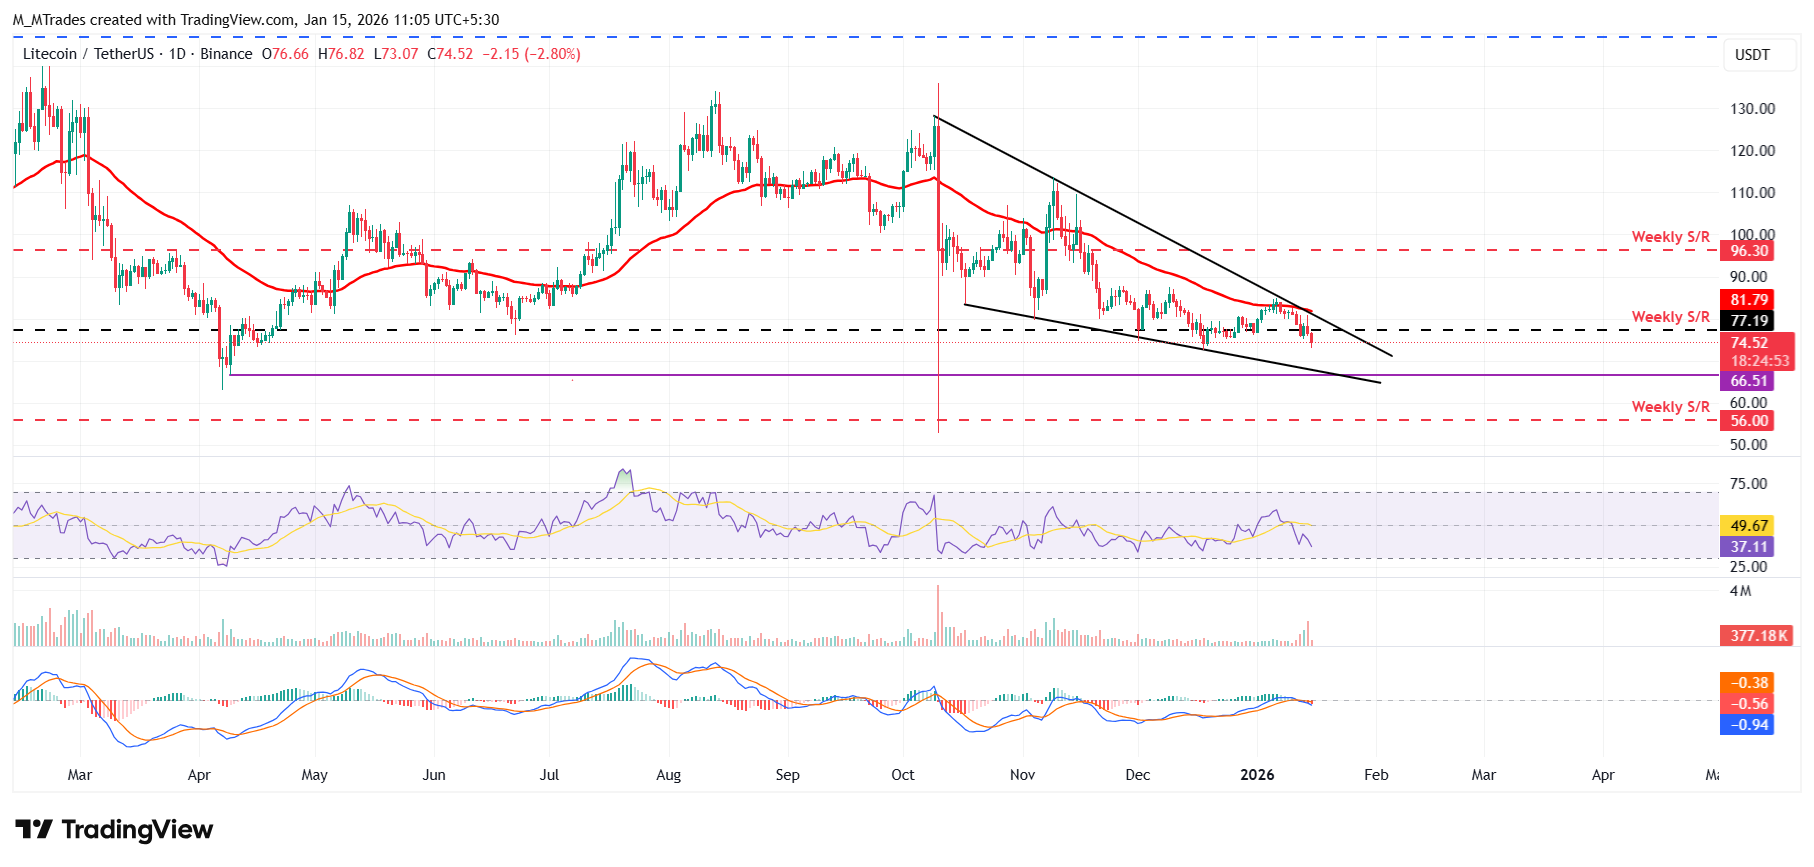
However, if LTC recovers, it could extend the advance toward the weekly resistance level at $77.19.

Plus d’un million d’utilisateurs se tournent vers FXStreet pour des données de marché en temps réel, des outils de graphiques, des analyses d’experts et des actualités Forex. Leur calendrier économique complet et leurs webinaires éducatifs aident les traders à rester informés et à prendre des décisions éclairées. FXStreet s’appuie sur une équipe d’environ 60 professionnels répartis entre le siège de Barcelone et diverses régions du monde.
Lire la suite


