
Meme Coins Price Prediction: DOGE, SHIB, PEPE stall amid warming retail demand
Par Vishal Dixit
Date de publication: 12 Dec 2025 | Date de modification: 12 Dec 2025


ARTICLES POPULAIRES
Meme coins, including Dogecoin (DOGE), Shiba Inu (SHIB), and Pepe (PEPE), struggle to regain strength as the broader cryptocurrency market recovers. Derivatives data reveals fresh retail demand as Open Interest of DOGE, SHIB, and PEPE futures surge.
- Dogecoin steadies after a 2% drop on Thursday within a consolidation range.
- Shiba Inu holds ground at the local support trendline, aiming to challenge a long-standing resistance trendline.
- Pepe struggles to reclaim the $0.00000500 psychological level, consolidating in a sideways range.
Meme coins, including Dogecoin (DOGE), Shiba Inu (SHIB), and Pepe (PEPE), struggle to regain strength as the broader cryptocurrency market recovers. Derivatives data reveals fresh retail demand as Open Interest of DOGE, SHIB, and PEPE futures surge. Still, Dogecoin and Pepe are stuck in a consolidation range while Shiba Inu struggles to break a long-standing resistance trendline.
Retail rekindles interest in major meme coins
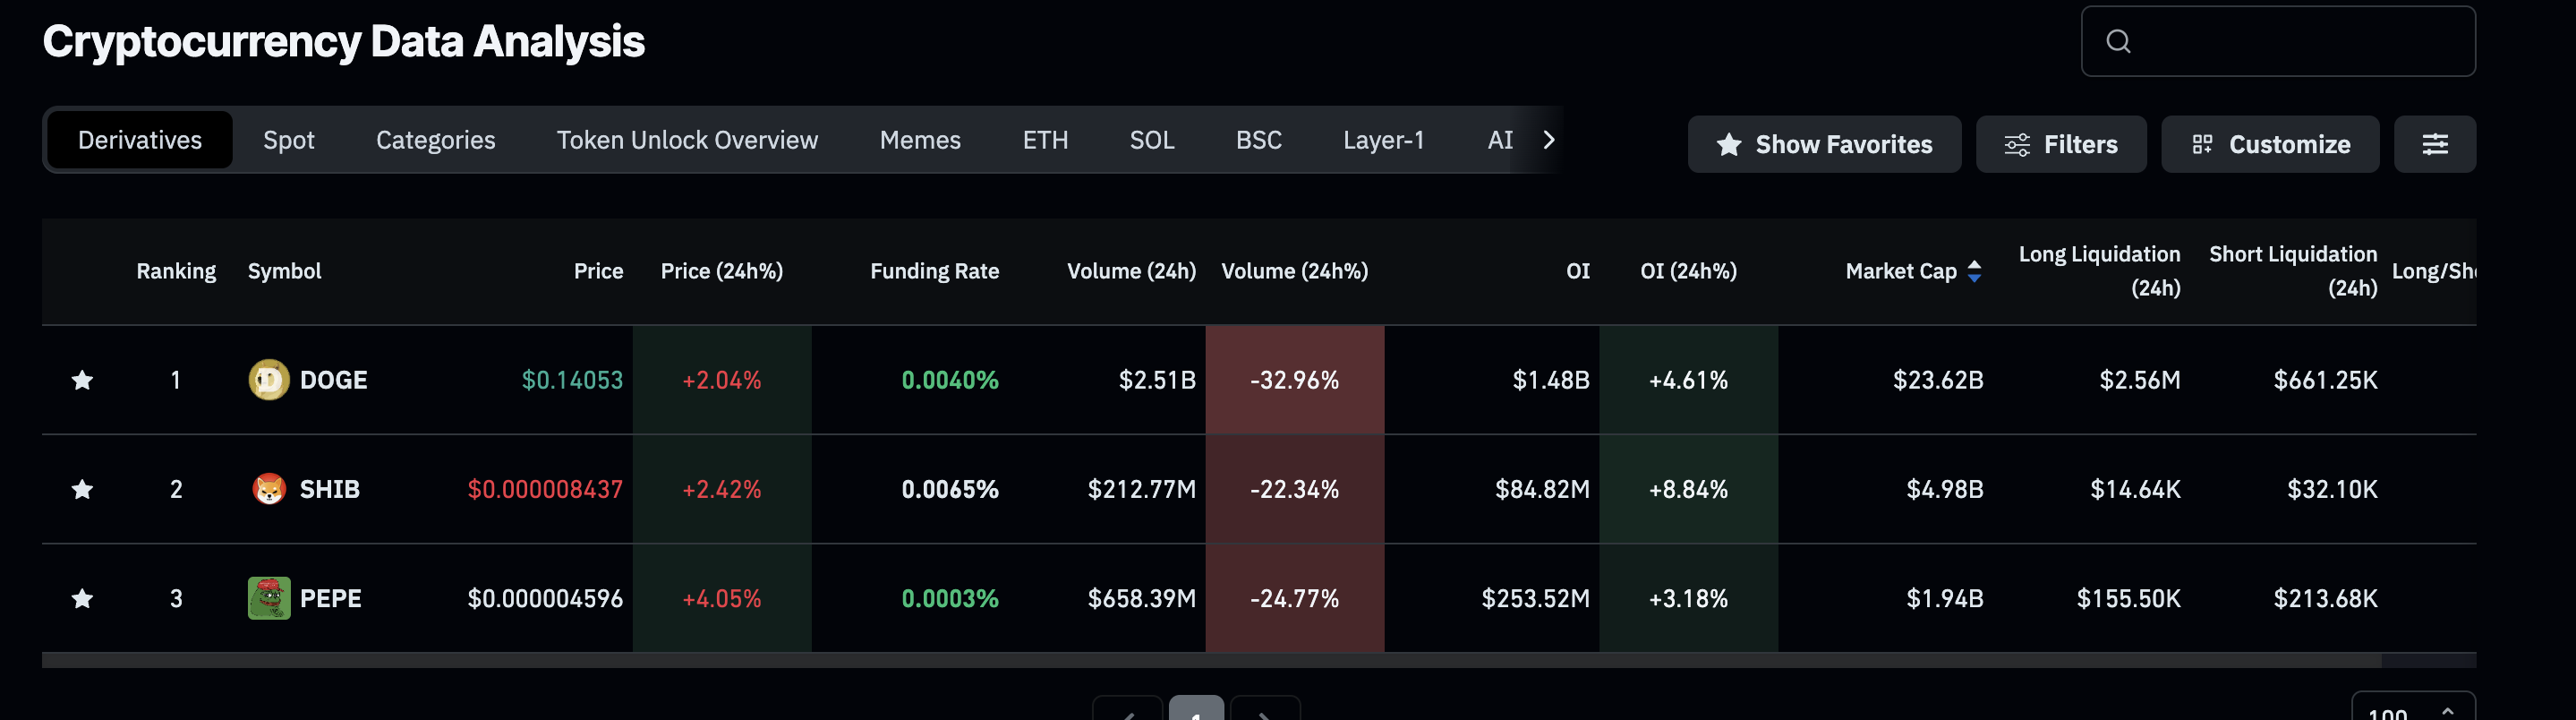
CoinGlass data shows that the DOGE, SHIB, and PEPE futures Open Interest (OI) – notional value of both long and short positions – has increased by 4%, 8%, and 3% to $1.48 billion, $84.82 million, and $253.52 million, respectively. This indicates that the retail interest in meme coins is increasing.
DOGE recorded $2.56 million in long liquidations in the last 24 hours, outpacing $661,510 in short liquidations, suggesting a bearish tilt. However, the short liquidations in SHIB and PEPE during the same time period outpace the long liquidations, indicating a bullish bias.
Dogecoin risks falling out of a consolidation range
Dogecoin trades near $0.1400 at press time on Friday, holding steady after a 2% drop the previous day. The meme coin trades within a consolidation range, extending from the November 21 low at $0.1332 to the November 26 high at $0.1568.
A decisive close above $0.1568 would confirm the bullish breakout, which could extend the rally to the $0.1810 zone.
The Relative Strength Index (RSI) on the daily chart is at 41, steadily rising toward the midpoint, suggesting a decline in selling pressure. Similarly, the Moving Average Convergence Divergence (MACD) rises toward the zero line, suggesting an underlying increase in bullish momentum.
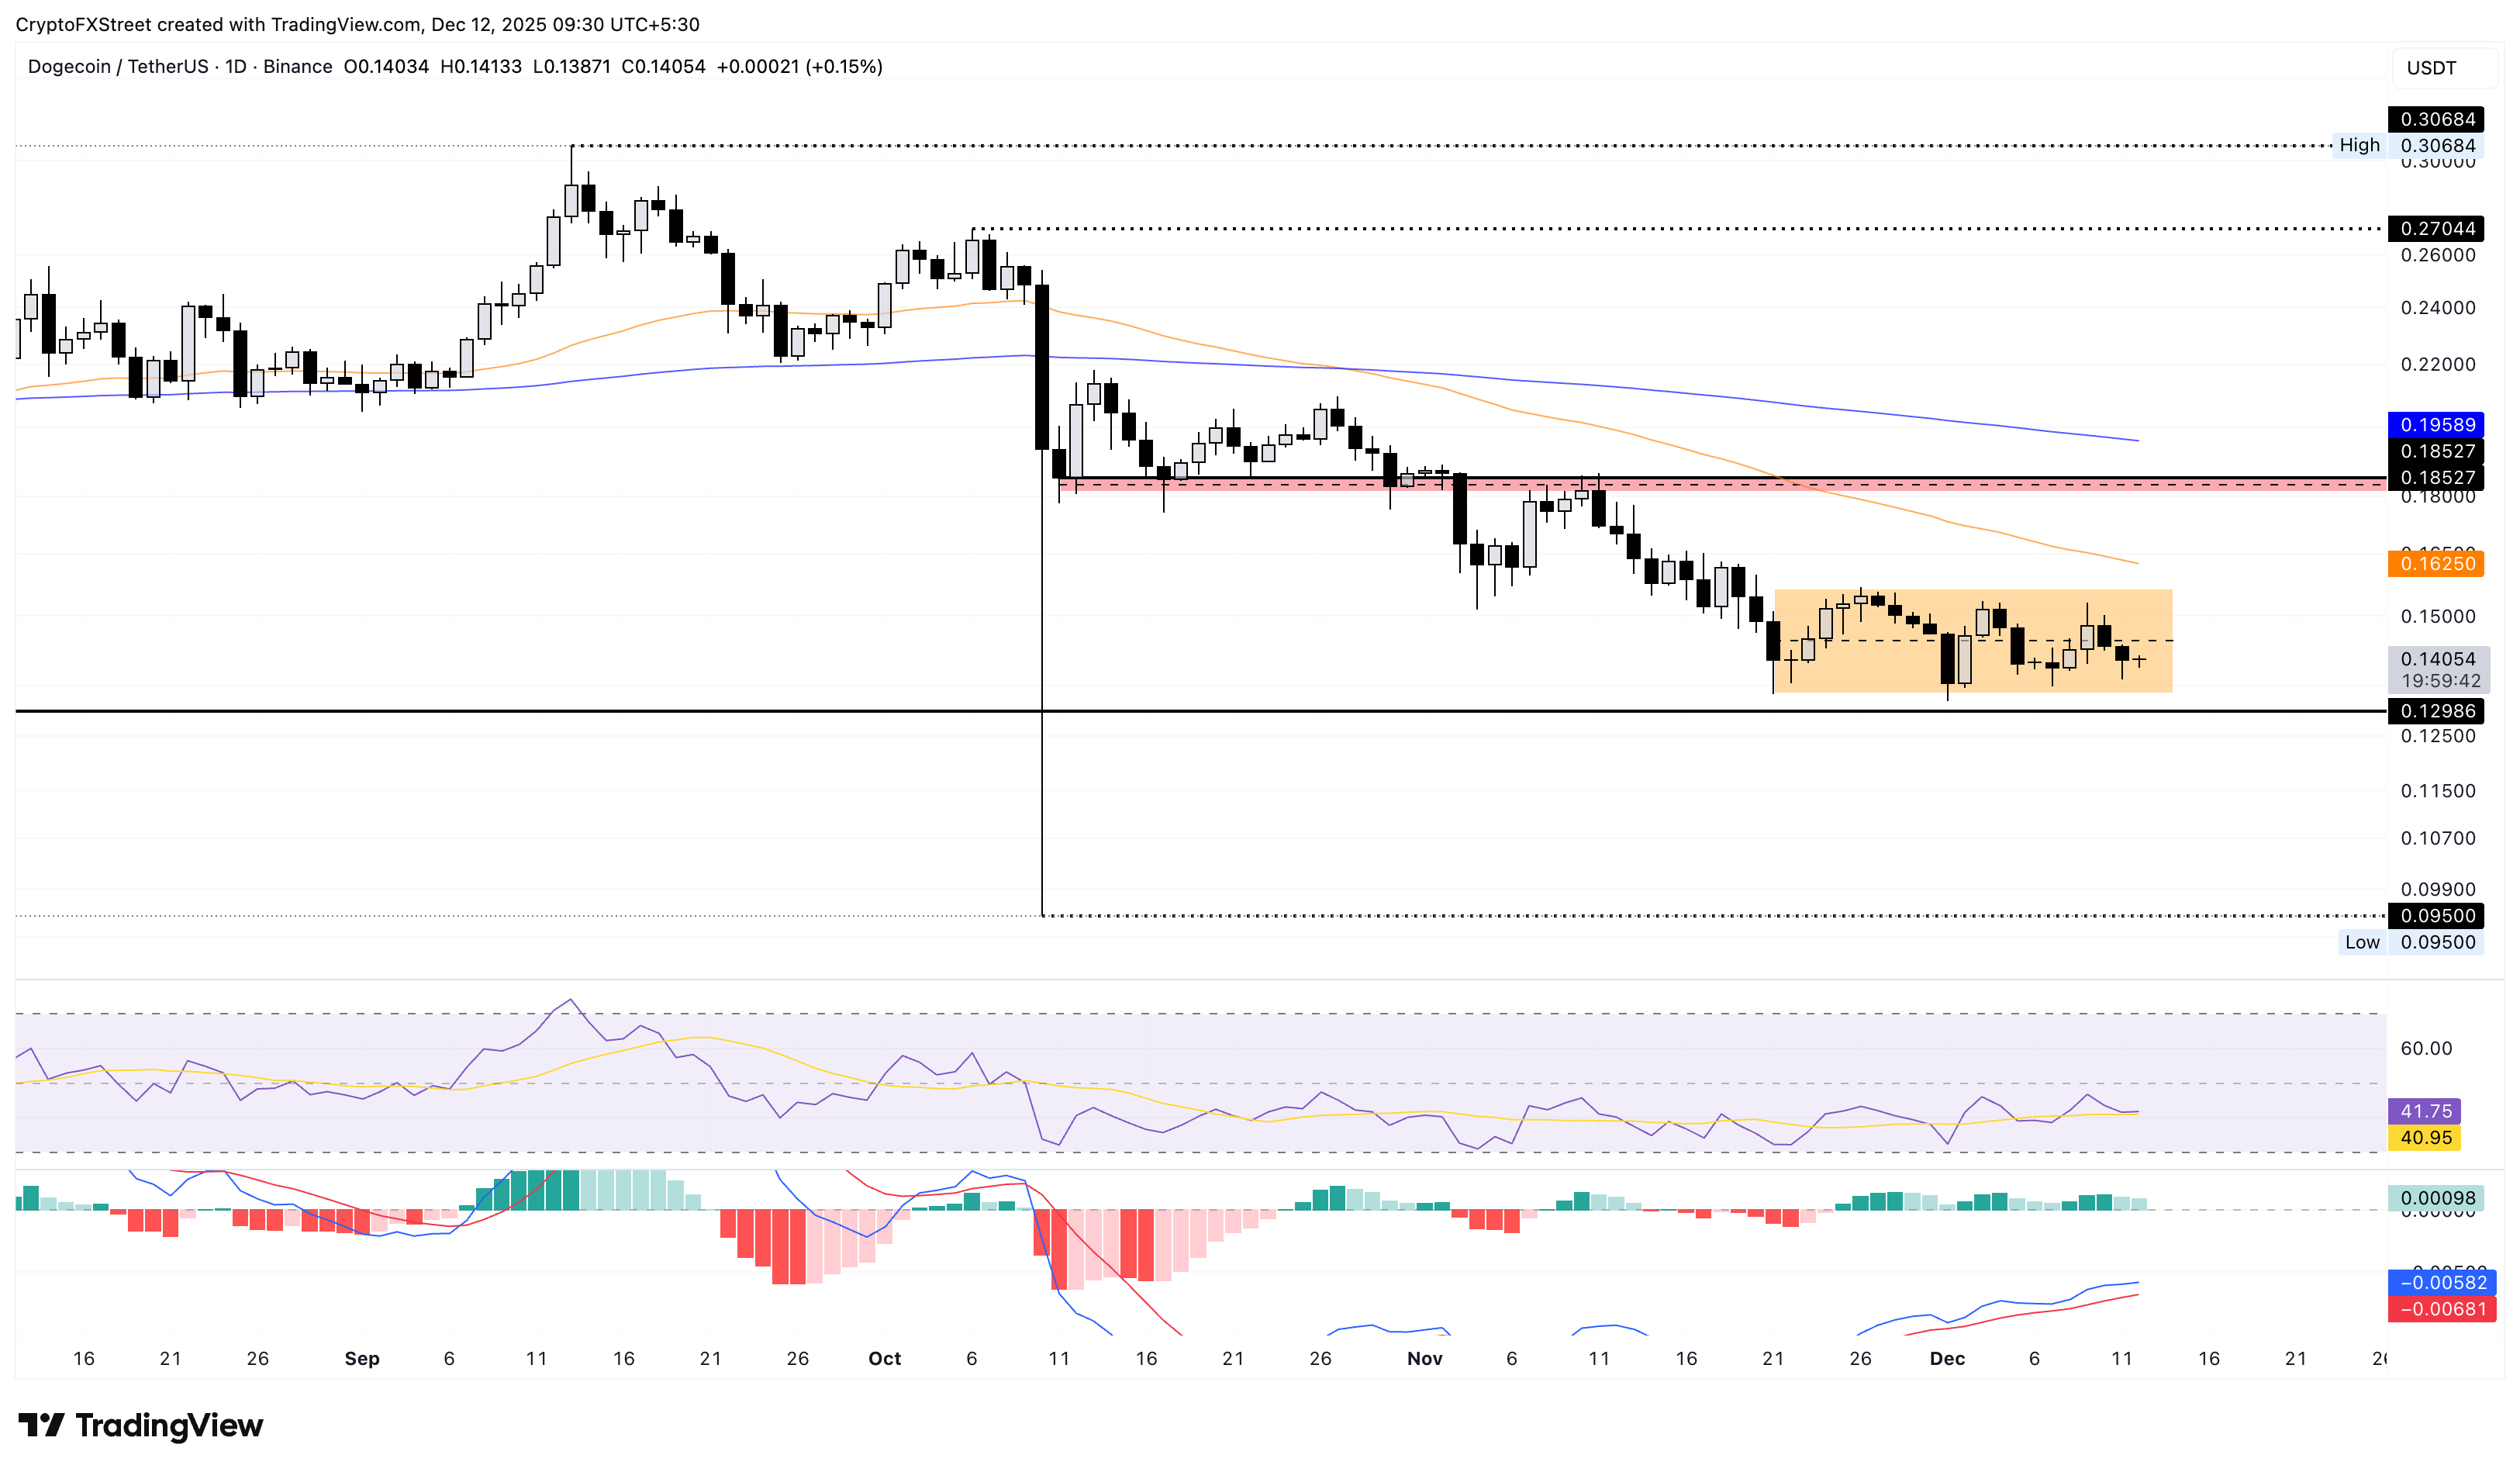
If DOGE slips below $0.1332, it could risk a steeper correction to the $0.1000 psychological support.
Shiba Inu rebounds from local support trendline, boosting breakout chances
Shiba Inu edges lower by nearly 1% at the time of writing on Friday, marking its third straight day in the red. However, the rebound from $0.00000817 (Thursday’s low) at the support trendline connecting the November 21 and December 1 lows indicates underlying demand for SHIB.
If SHIB slips below $0.00000817, it would nullify the support trendline, potentially extending the decline to the November 21 low at $0.00000755.
The RSI on the daily chart is at 46, extending a lateral move, which indicates a lack of momentum at neutral levels. Meanwhile, the MACD and signal line struggle to stretch the uptrend toward the zero line as bullish momentum wanes.
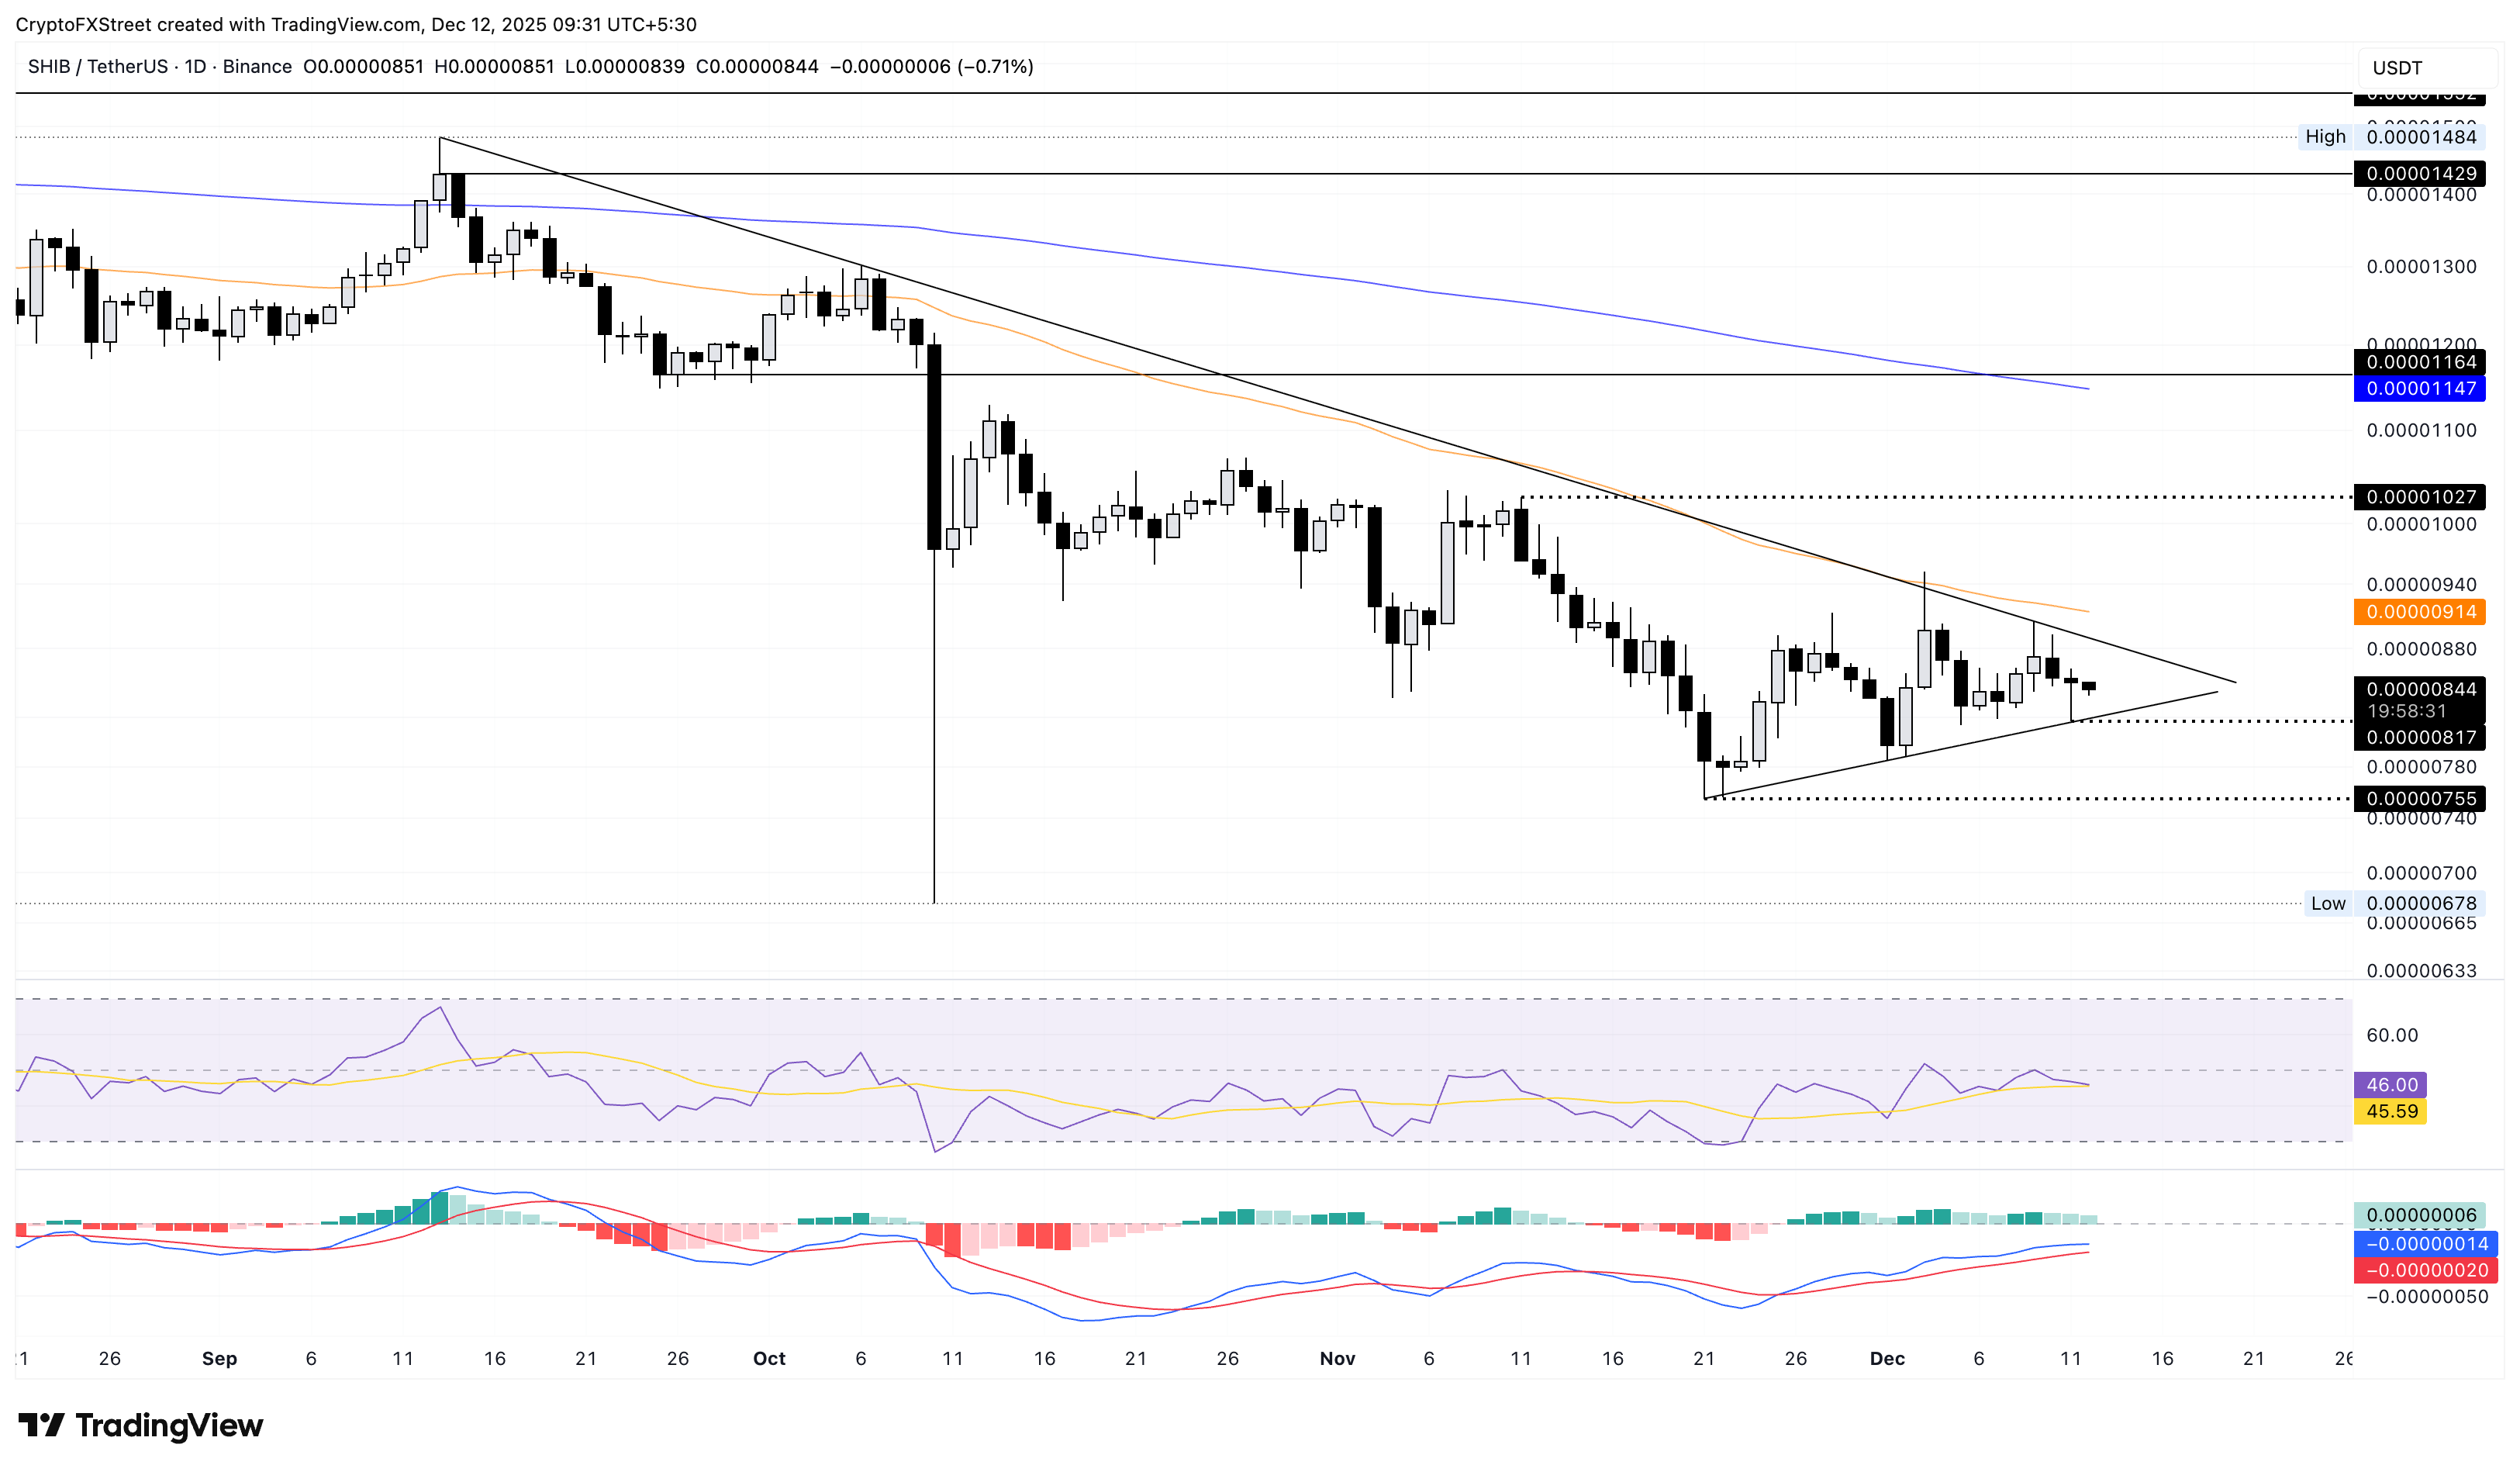
To reinstate an uptrend, SHIB should surpass the overhead trendline connecting the highs of September 13 and October 6 at $0.00000900. A potential breakout rally could push SHIB prices to the $0.00001000 psychological level.
Pepe’s downcycle in a range risks testing crucial support
Pepe holds steady within a consolidation range, stretching from the lows of November 4 and November 21 at $0.00000521 and $0.00000395, respectively. The meme coin is in a downcycle, risking a revisit to the $0.00000395 level.
Similar to SHIB, the RSI at 45 hovers in the neutral zone while MACD and signal line inch closer toward the positive territory.
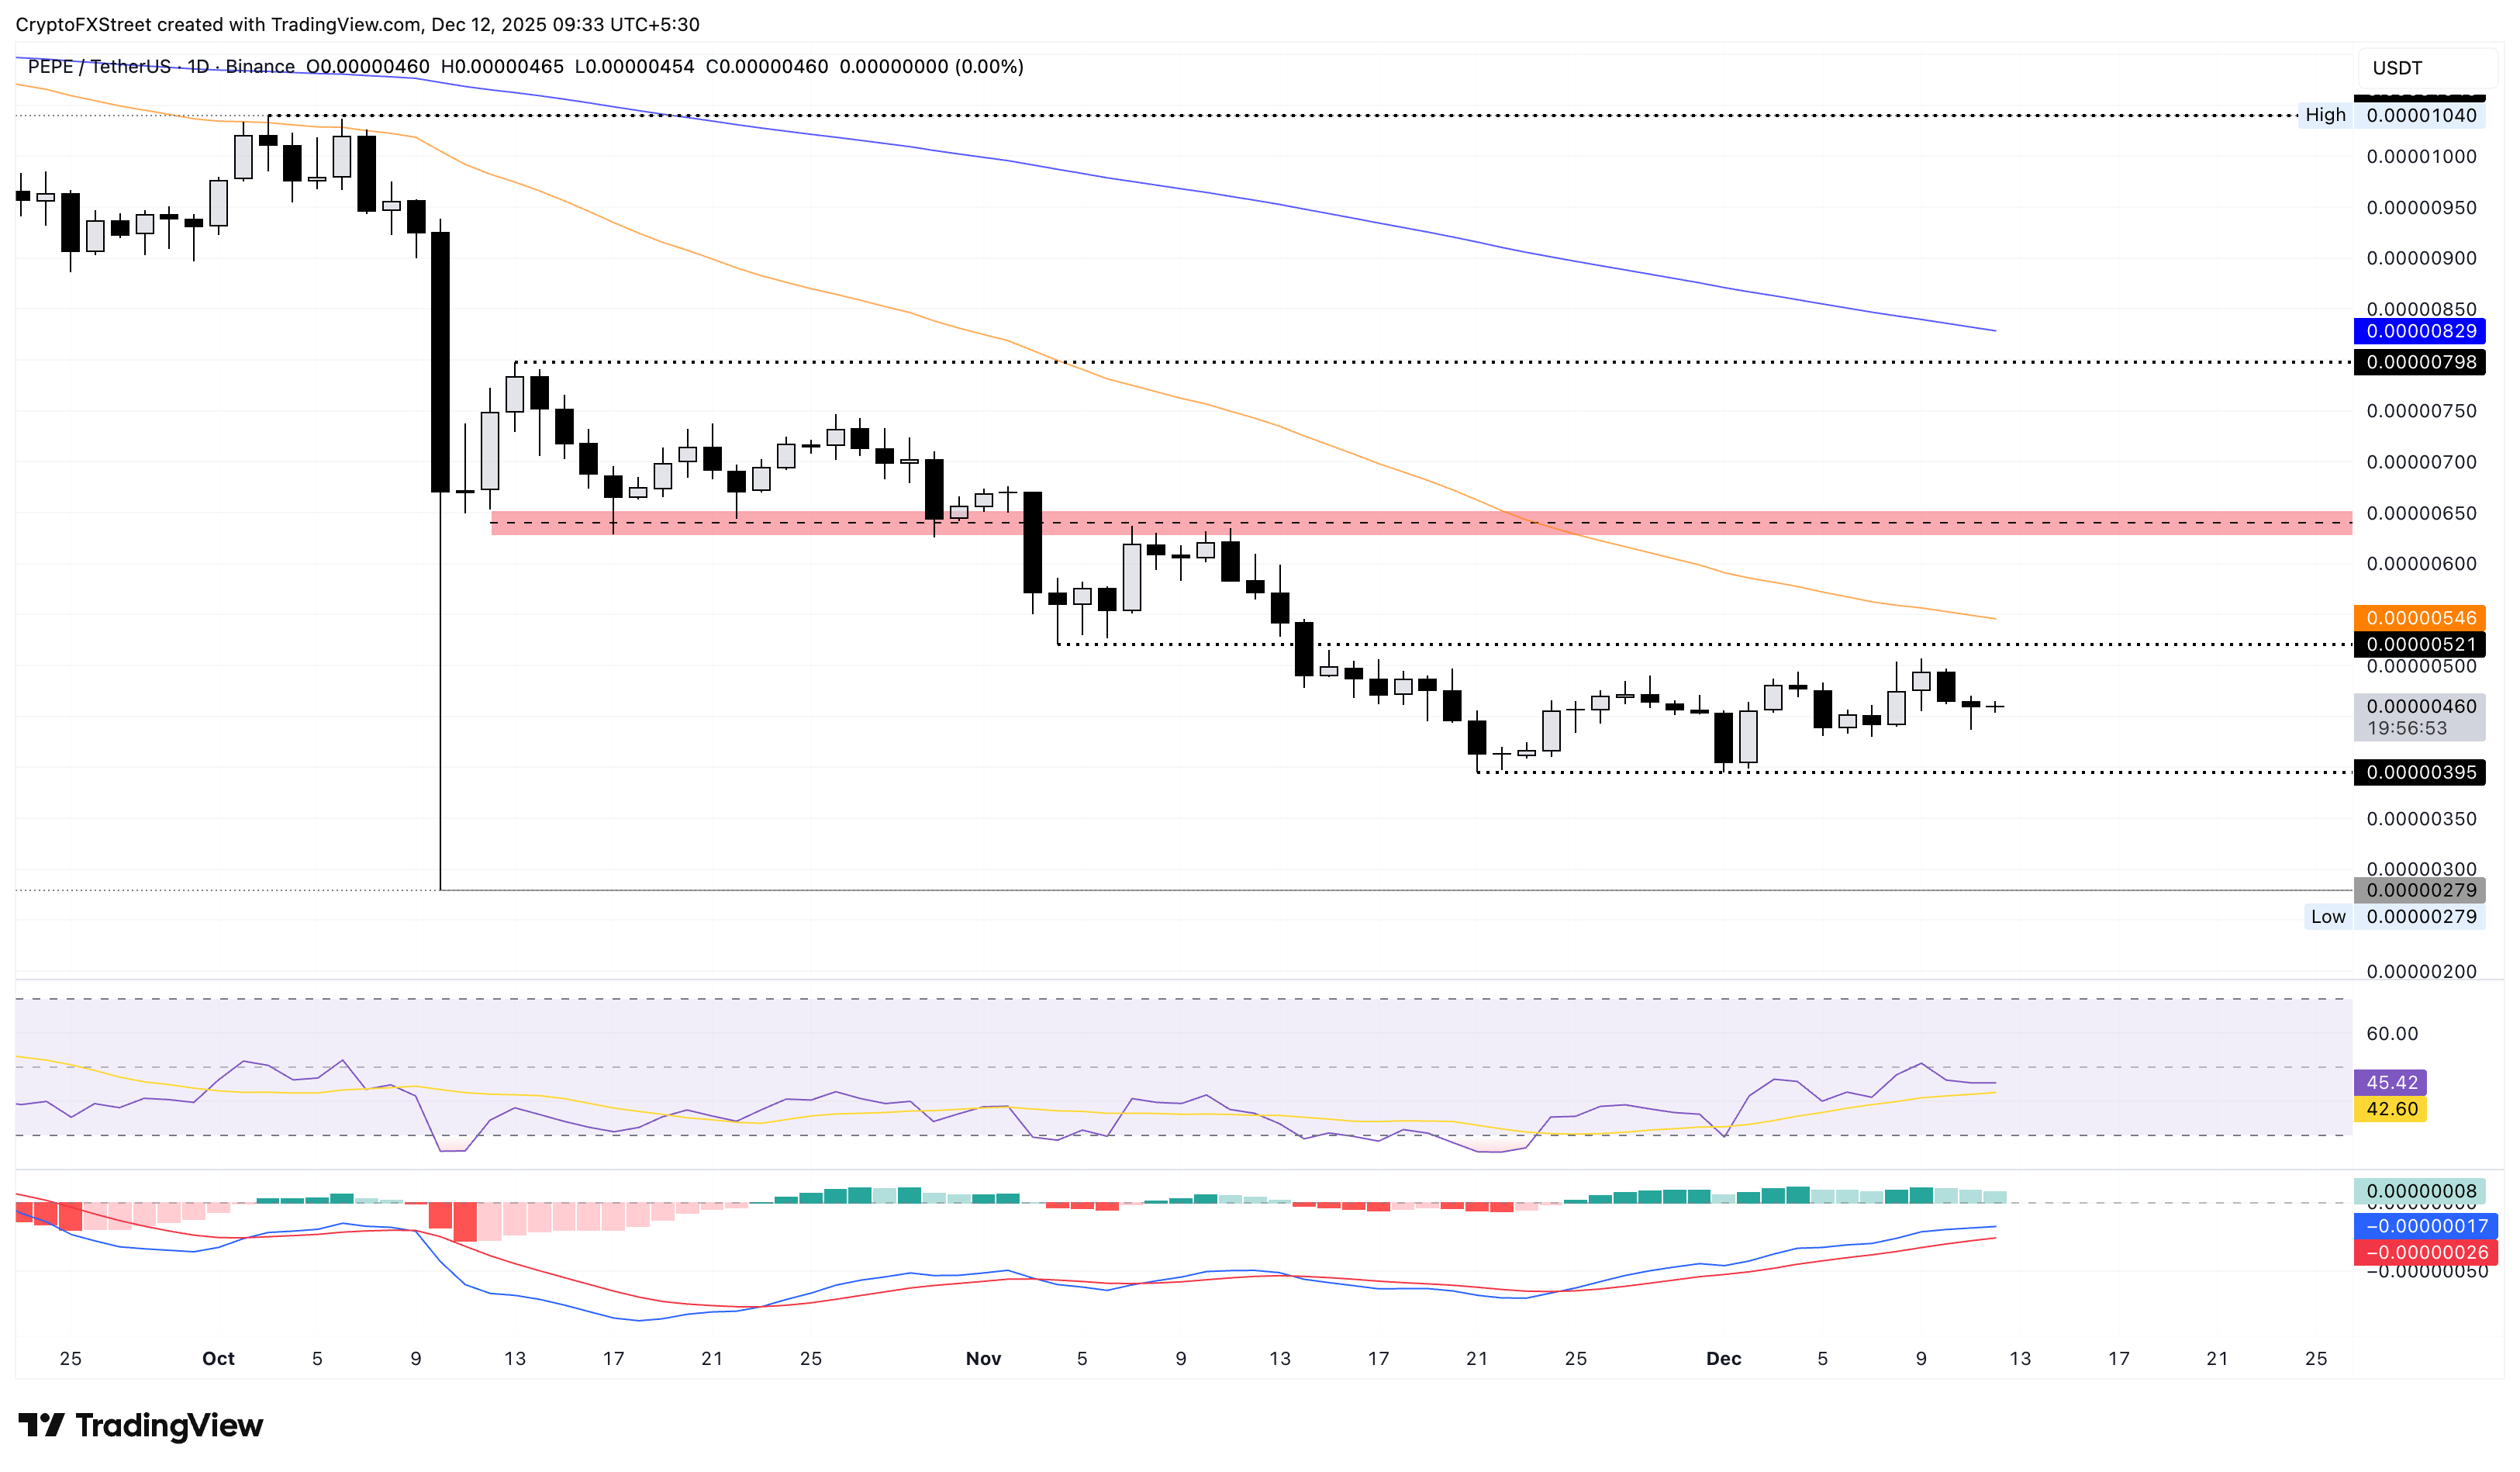
Looking up, a potential rebound in PEPE above $0.00000521, confirming a bullish breakout of the range, could test the $0.00000650 supply zone.

Plus d’un million d’utilisateurs se tournent vers FXStreet pour des données de marché en temps réel, des outils de graphiques, des analyses d’experts et des actualités Forex. Leur calendrier économique complet et leurs webinaires éducatifs aident les traders à rester informés et à prendre des décisions éclairées. FXStreet s’appuie sur une équipe d’environ 60 professionnels répartis entre le siège de Barcelone et diverses régions du monde.
Lire la suite


