

Meme Coins Price Prediction: Dogecoin, Shiba Inu and Pepe sell-off deepens as bearish momentum accelerates
- Dogecoin extends its correction on Monday after being rejected at the weekly resistance near $0.119.
- Shiba Inu slips toward the lower consolidation boundary near $0.0000056 after losing over 13% in the previous week.
- Pepe momentum indicators show bearish signals, hinting at deeper losses.
Meme coins continue to trade under pressure at the start of the week as the broader crypto market struggles, with Bitcoin (BTC) slipping below $77,000 on Monday. Dogecoin (DOGE) faces renewed selling after failing to break above a key weekly resistance zone, while Shiba Inu (SHIB) drifts closer to its lower consolidation support following massive losses in the previous week. Meanwhile, Pepe (PEPE) remains vulnerable to further downside, as momentum indicators continue to signal a bearish outlook.

Dogecoin faces rejection from the weekly resistance zone
Dogecoin rose and retested the weekly resistance at $0.119 on Thursday, but faced rejection, declining nearly 6% through Sunday. At the time of writing on Monday, DOGE is extending its correction, trading below $0.106.
If DOGE continues its pullback and closes below the 100-day Exponential Moving Average (EMA) at $0.106 on a daily basis, it could extend the decline toward the 50-day EMA at $0.103. A close below this level could trigger further losses toward the trendline breakout level near $0.090.
The Relative Strength Index (RSI) on the daily chart is 48, slipping below the neutral 50 level, indicating bearish momentum is gaining traction. The Moving Average Convergence Divergence (MACD) showed a bearish crossover on Saturday, which remains intact, further supporting the negative outlook.
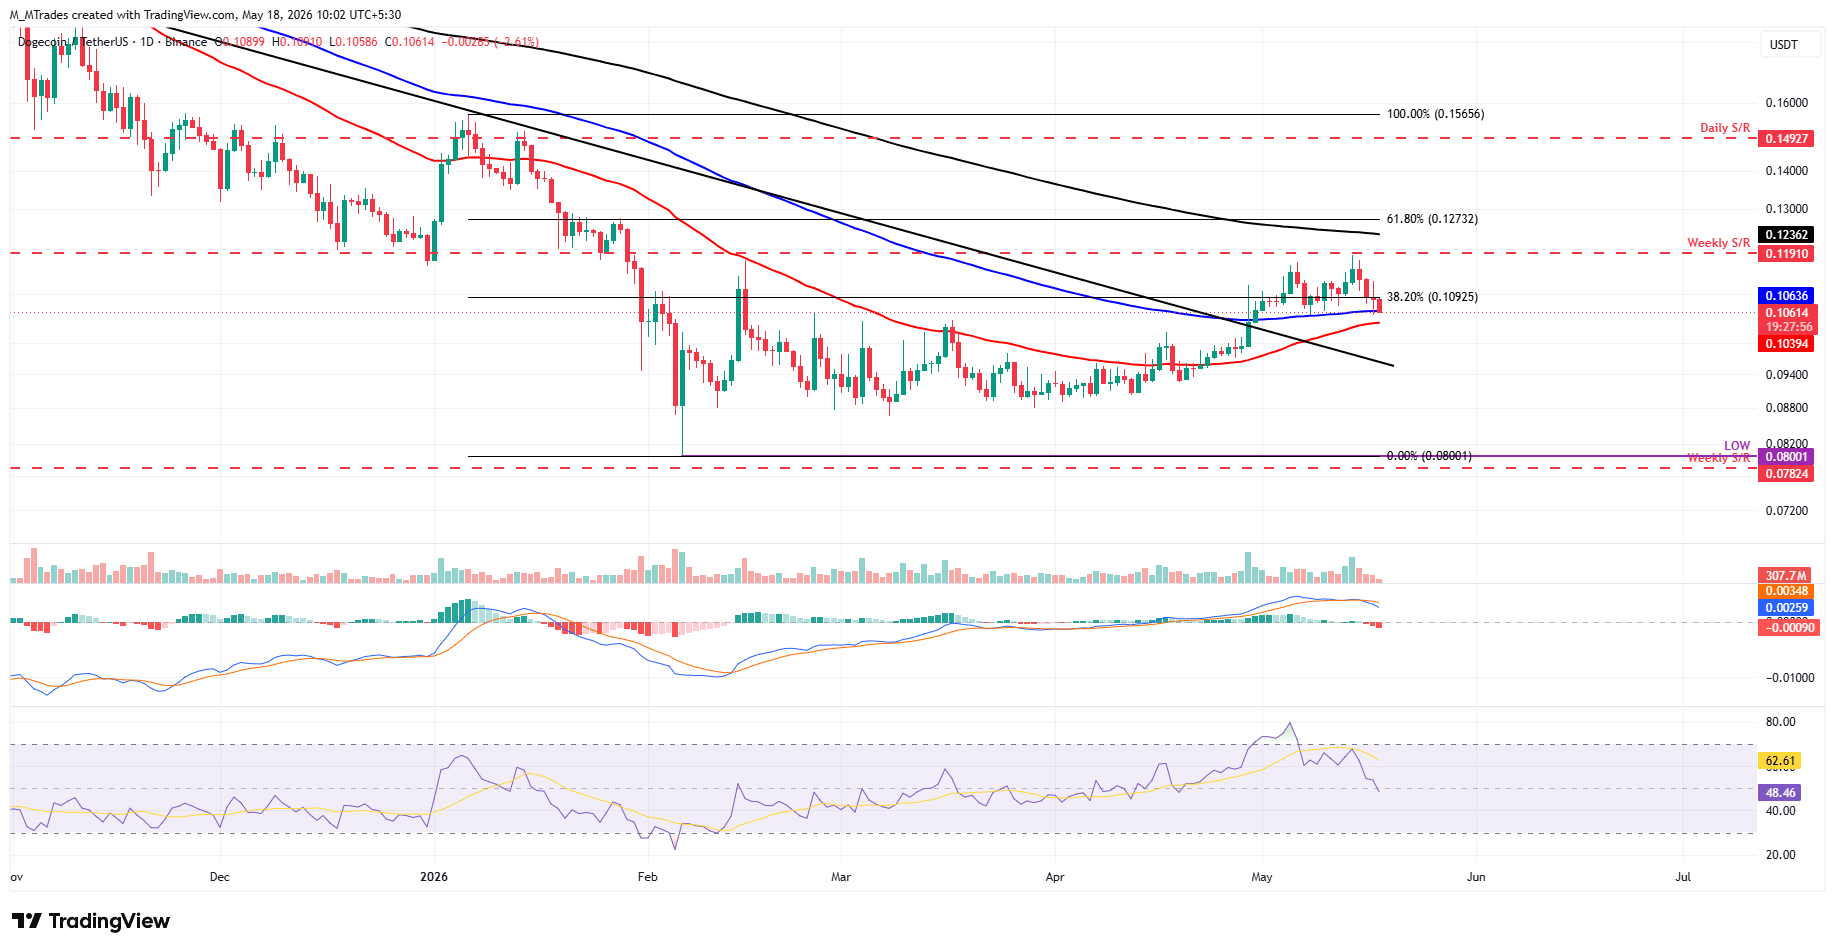
On the other hand, if DOGE finds support around the 100-day EMA at $0.106, it could recover toward the weekly resistance at $0.119.
Shiba Inu dips toward the lower consolidation boundary
Shiba Inu broke above its nearly two-month range-bound zone, closing above the upper consolidation boundary at $0.0000063 on May 10, but failed to sustain this breakout, declining over 13% last week. At the time of writing on Monday, SHIB is extending its ongoing correction, nearing the lower boundary of its consolidation at $0.0000056.
If SHIB closes below the lower consolidation boundary at $0.0000056, it could extend losses toward the February 6 low at $0.0000050.
Like Dogecoin, SHIB’s momentum indicators, RSI and MACD, also support the negative outlook.
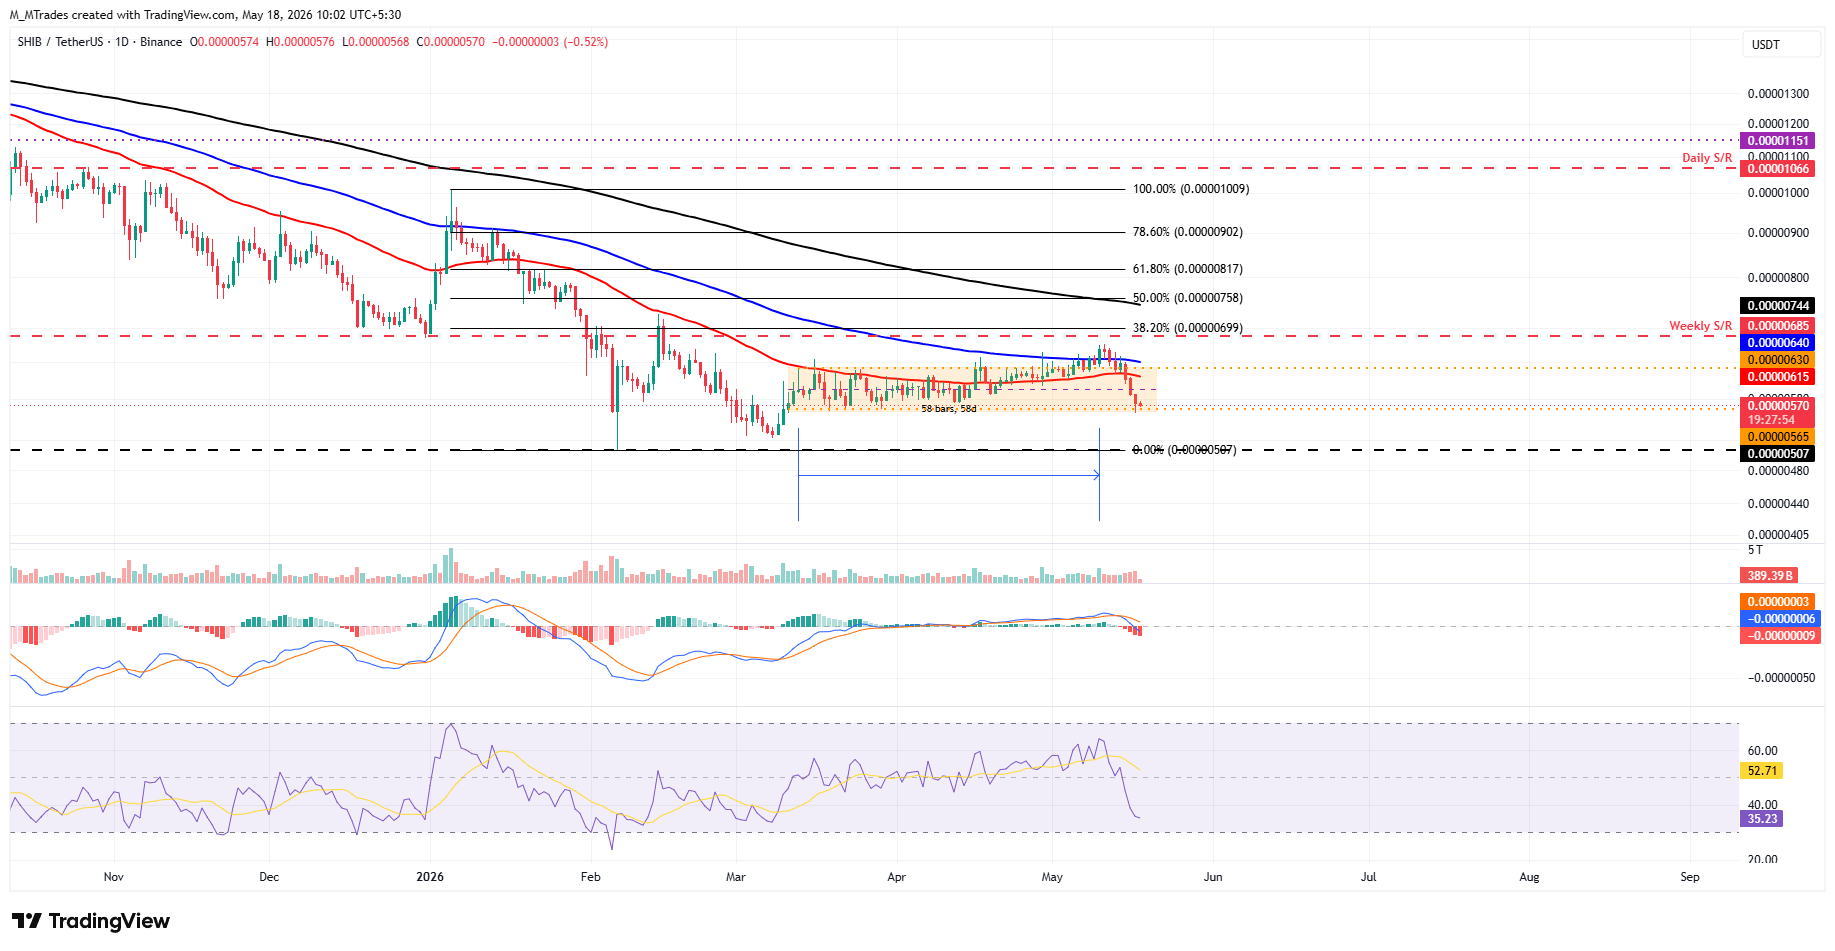
However, if SHIB recovers, it could extend the advance toward the 50-day EMA at $0.0000061.
Pepe bears are in control of the momentum
Pepe price corrected more than 16% in the previous week, closing below the 50-day and 100-day EMAs support zone. At the time of writing on Monday, PEPE is extending its correction, trading below $0.0000036.
If PEPE continues its decline, it could extend the fall toward the April 7 low of $0.0000033, which roughly coincides with the former trendline breakout level.
Like Dogecoin and Shiba Inu, Pepe’s momentum indicators, RSI and MACD, hint at further correction and negative bias.
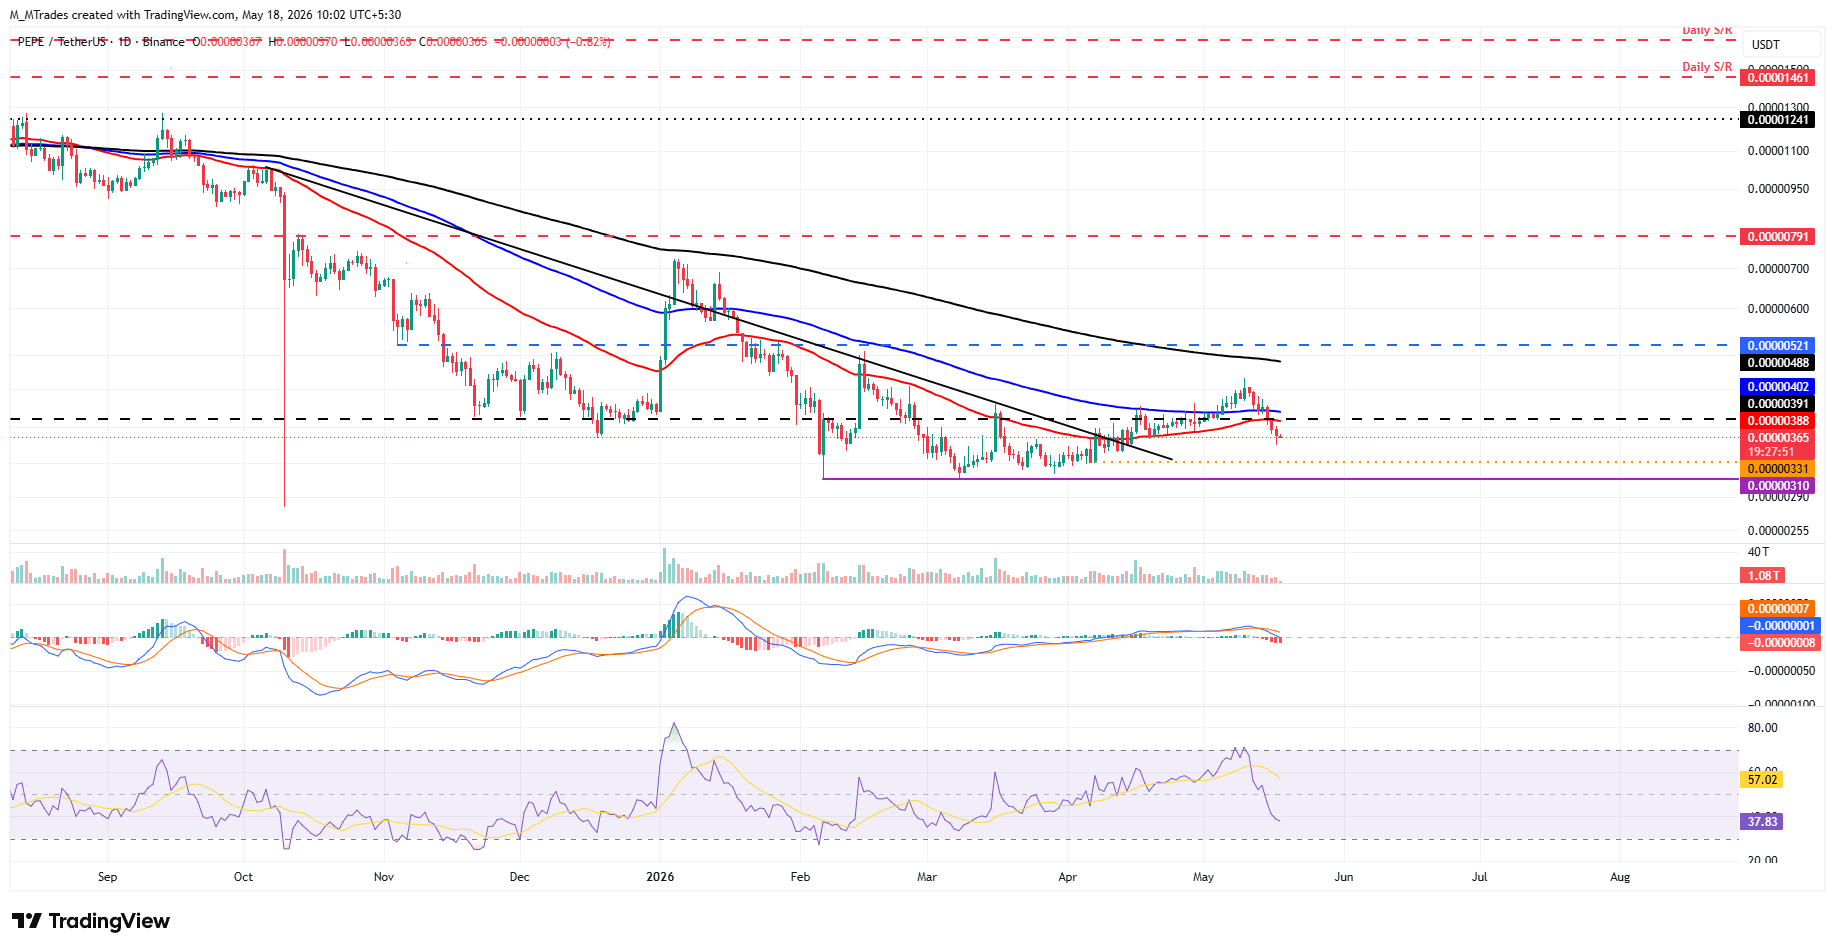
Conversely, if PEPE recovers, it could extend the advance toward the 50-day EMA at $0.0000038.














