
Meme Coins Price Prediction: Dogecoin, Shiba Inu, and Pepe show bearish signals at key levels
Par Manish Chhetri
Date de publication: 2 Mar 2026 | Date de modification: 2 Mar 2026


ARTICLES POPULAIRES

Meme coins are hovering around key support zones at the start of this week on Monday, after extending losses in the previous week. Dogecoin (DOGE) signals a neutral near-term bias with a slight bearish tilt.
- Dogecoin price hovers around key support at $0.091, with neutral near-term biasand a slight bearish tilt.
- Shiba Inu momentum indicators show bearish momentum gaining traction.
- Pepe price trades at $0.0000034 on Monday after falling over 15% in the previous week.
Meme coins are hovering around key support zones at the start of this week on Monday, after extending losses in the previous week. Dogecoin (DOGE) signals a neutral near-term bias with a slight bearish tilt. Meanwhile, Shiba Inu (SHIB) and Pepe (PEPE) traders should be cautious as technical indicators show bearish momentum gaining traction. In addition, the broader market sentiment remains risk-off, as the escalating military aggression in the Middle East over the weekend continues to weigh on the crypto market.
Dogecoin shows a slight bearish tilt
Dogecoin is trading at $0.093 as of writing on Monday. The near-term bias is neutral with a slight bearish tilt, as price holds well below the 50- and 100-day Exponential Moving Averages (EMAs) clustered around $0.108–$0.125, keeping the broader downtrend intact. The pair continues to trade under the long-running descending resistance trend line from $0.218, reinforcing overhead supply despite the recent bounce from sub-$0.091 levels.
Momentum remains subdued, with the Relative Strength Index (RSI) on the daily chart recovering from oversold territory but still hovering in the low-40s, while the Moving Average Convergence Divergence (MACD) line stays marginally above the signal line around the zero area, hinting at fragile upside pressure within a corrective phase rather than a confirmed trend reversal.
Immediate support is seen at the horizontal level of $0.091, which aligns just above the 23.6% Fibonacci retracement at $0.091 measured from the $0.080 low to the $0.127 high, forming a key floor for the current consolidation.
A daily close below this band would expose the lower retracement zone and refocus attention on the $0.080 swing low.
On the topside, initial resistance emerges near the 38.2% retracement at $0.098, ahead of the more important barrier at the 50% retracement at $0.103, where the declining moving averages start to weigh.
A sustained break above $0.103 would open the path toward the 61.8% level at $0.109, but as long as the price trades beneath the $0.124 horizontal resistance and the descending trend line, rallies remain vulnerable to renewed selling.
Shiba Inu bears aiming for February 6 lows
Shiba Inu price was rejected around the weekly resistance level of $0.0000068 in mid-February and then declined by over 22% over the next two weeks. As of Monday, SHIB is trading at $0.0000056.
If SHIB continues its downward trend, it could extend the correction toward the February 6 low of $0.0000050.
The RSI on the daily chart stands at 37, below the neutral 50 level, indicating bearish momentum is gaining traction. Moreover, the MACD showed a bearish crossover on Saturday, further supporting the negative outlook.
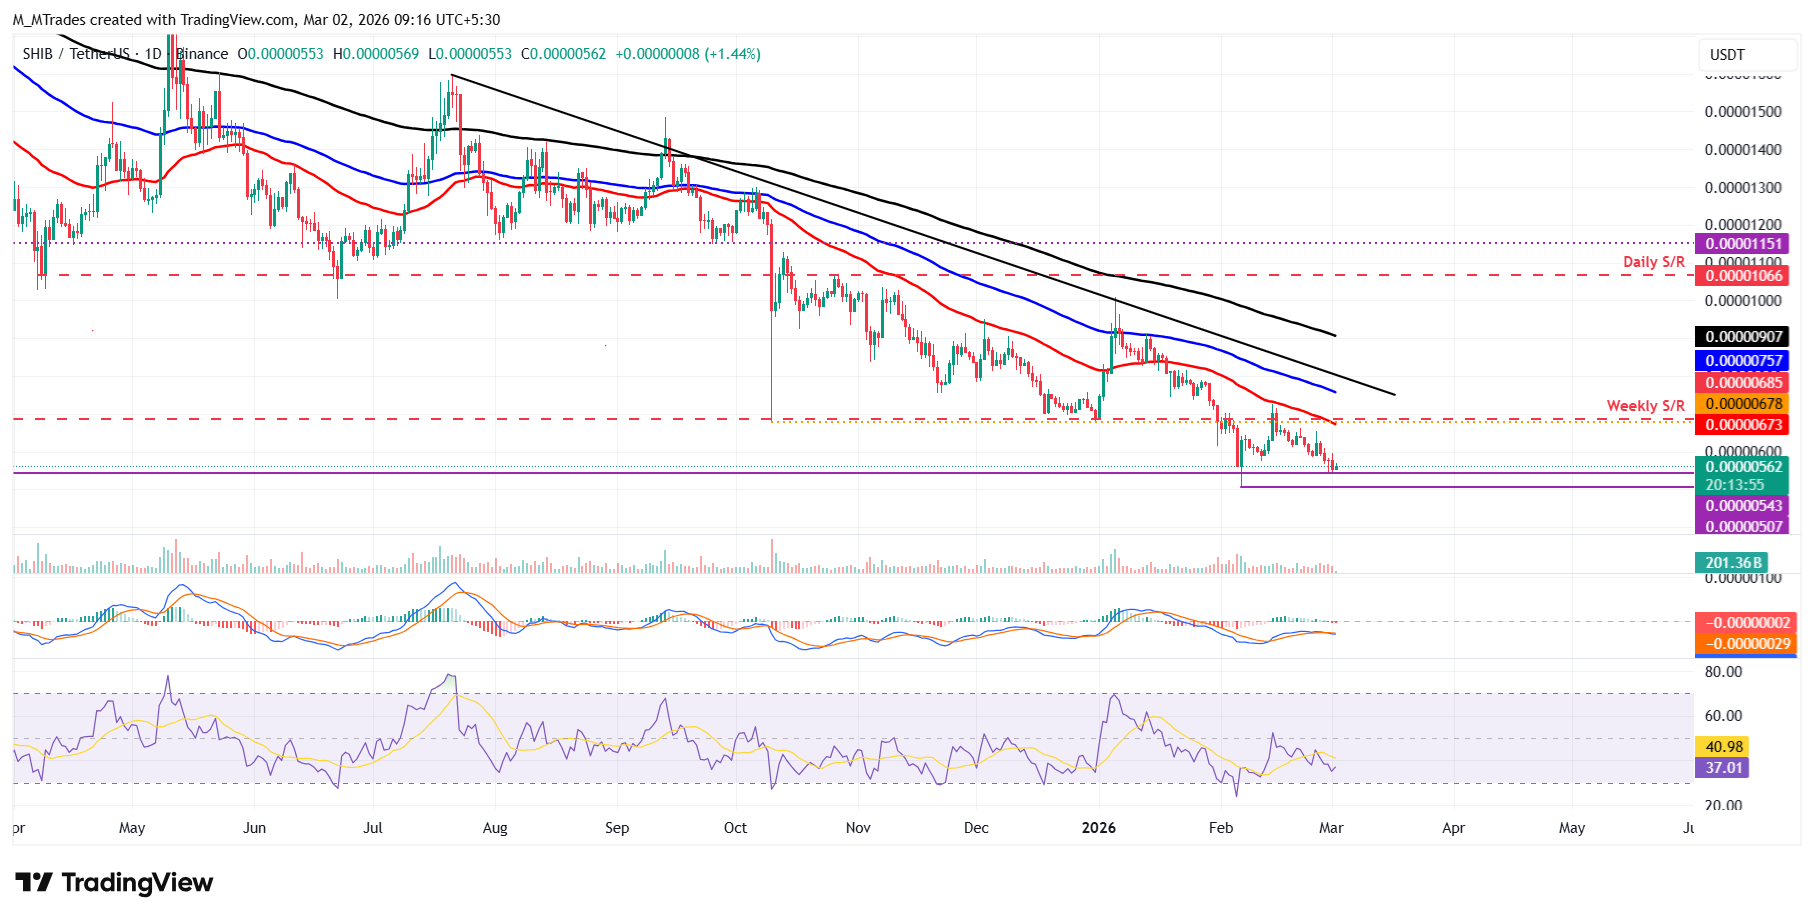
However, if SHIB recovers, it could extend the advance toward the weekly resistance at $0.0000067.
Pepe momentum indicators show bearish signs
Pepe price was rejected from the 50-day EMA at $0.0000043 on Wednesday and declined by over 17% through Sunday. As of writing, PEPE is trading at $0.0000034.
If PEPE continues its correction, it could extend the decline toward the February 6 low of $0.0000031.
Like Shiba Inu, PEPE's momentum indicators, RSI and MACD, also support a negative outlook.
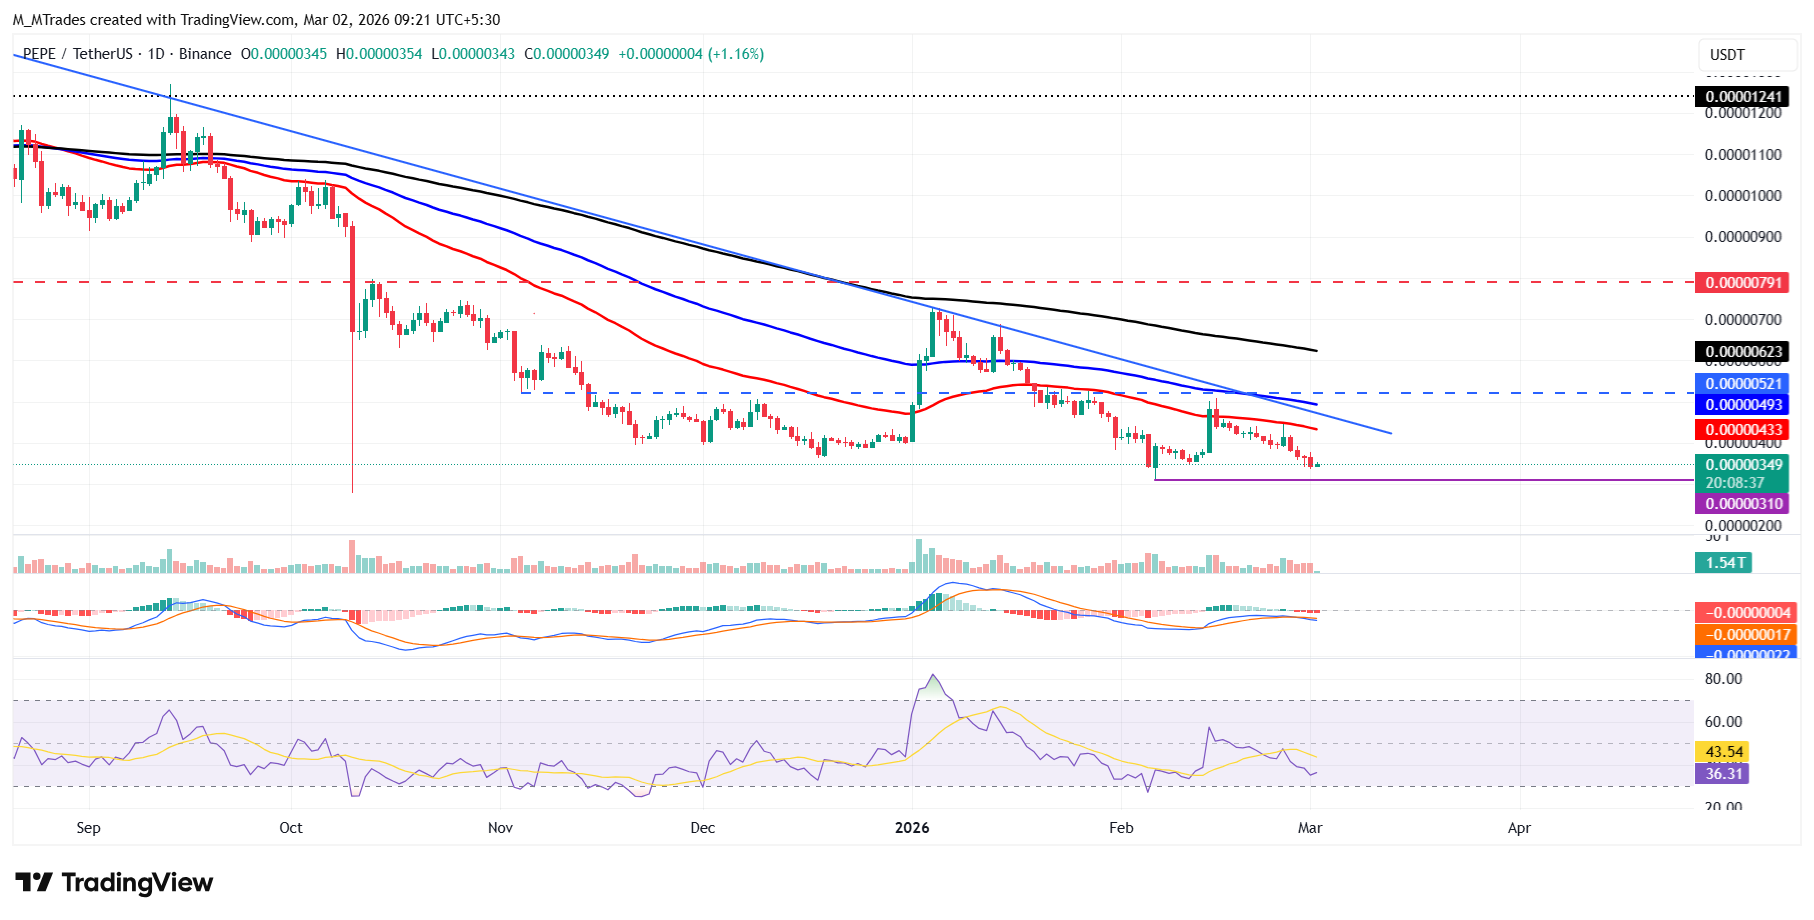
Conversely, if PEPE recovers, it could extend the advance toward the 50-day EMA at $0.0000043.
(The technical analysis of this story was written with the help of an AI tool.)

Plus d’un million d’utilisateurs se tournent vers FXStreet pour des données de marché en temps réel, des outils de graphiques, des analyses d’experts et des actualités Forex. Leur calendrier économique complet et leurs webinaires éducatifs aident les traders à rester informés et à prendre des décisions éclairées. FXStreet s’appuie sur une équipe d’environ 60 professionnels répartis entre le siège de Barcelone et diverses régions du monde.
Lire la suite


