
Meme Coins Price Prediction: Dogecoin, Shiba Inu, Pepe struggle to extend gains
Par Vishal Dixit
Date de publication: 26 Feb 2026 | Date de modification: 26 Feb 2026


ARTICLES POPULAIRES

Meme coins, including Dogecoin (DOGE), Shiba Inu (SHIB), and Pepe (PEPE), have remained stable so far on Thursday after rising around 5%-10%-5% respectively on Wednesday, suggesting a lack of sustained bullish momentum.
- Dogecoin hovers around $0.10 so far on Thursday, holding the 10% gains from the previous day.
- Shiba Inu loses steam after a 5% rebound on Wednesday, struggling to reach the 50-day EMA.
- Pepe remains under bearish pressure, with the 50-day EMA capping recovery.
Meme coins, including Dogecoin (DOGE), Shiba Inu (SHIB), and Pepe (PEPE), have remained stable so far on Thursday after rising around 5%-10%-5% respectively on Wednesday, suggesting a lack of sustained bullish momentum. The derivatives market witnessed increased support for DOGE, while SHIB and PEPE futures' Open Interest declined. Still, the large wallet investors, commonly referred to as whales, remained interested in the top-tier meme coins.
The technical outlook for Dogecoin, Shiba Inu, and Pepe remains bearish, with the 50-day Exponential Moving Average (EMA) as the immediate resistance.
Derivatives market, whales prefer Dogecoin over Shiba Inu and Pepe
CoinGlass data shows that the Dogecoin Open Interest (OI) is at $1.04 billion on Thursday, up 5.36% over the last 24 hours, signaling increased capital inflows and retail demand. However, Shiba Inu and Pepe struggle to capitalize on the market recovery and regain retail strength as the SHIB OI is at $62.75 million, holding relatively stable, while the PEPE OI is at $195.92 million, down more than 6% in the same time period.
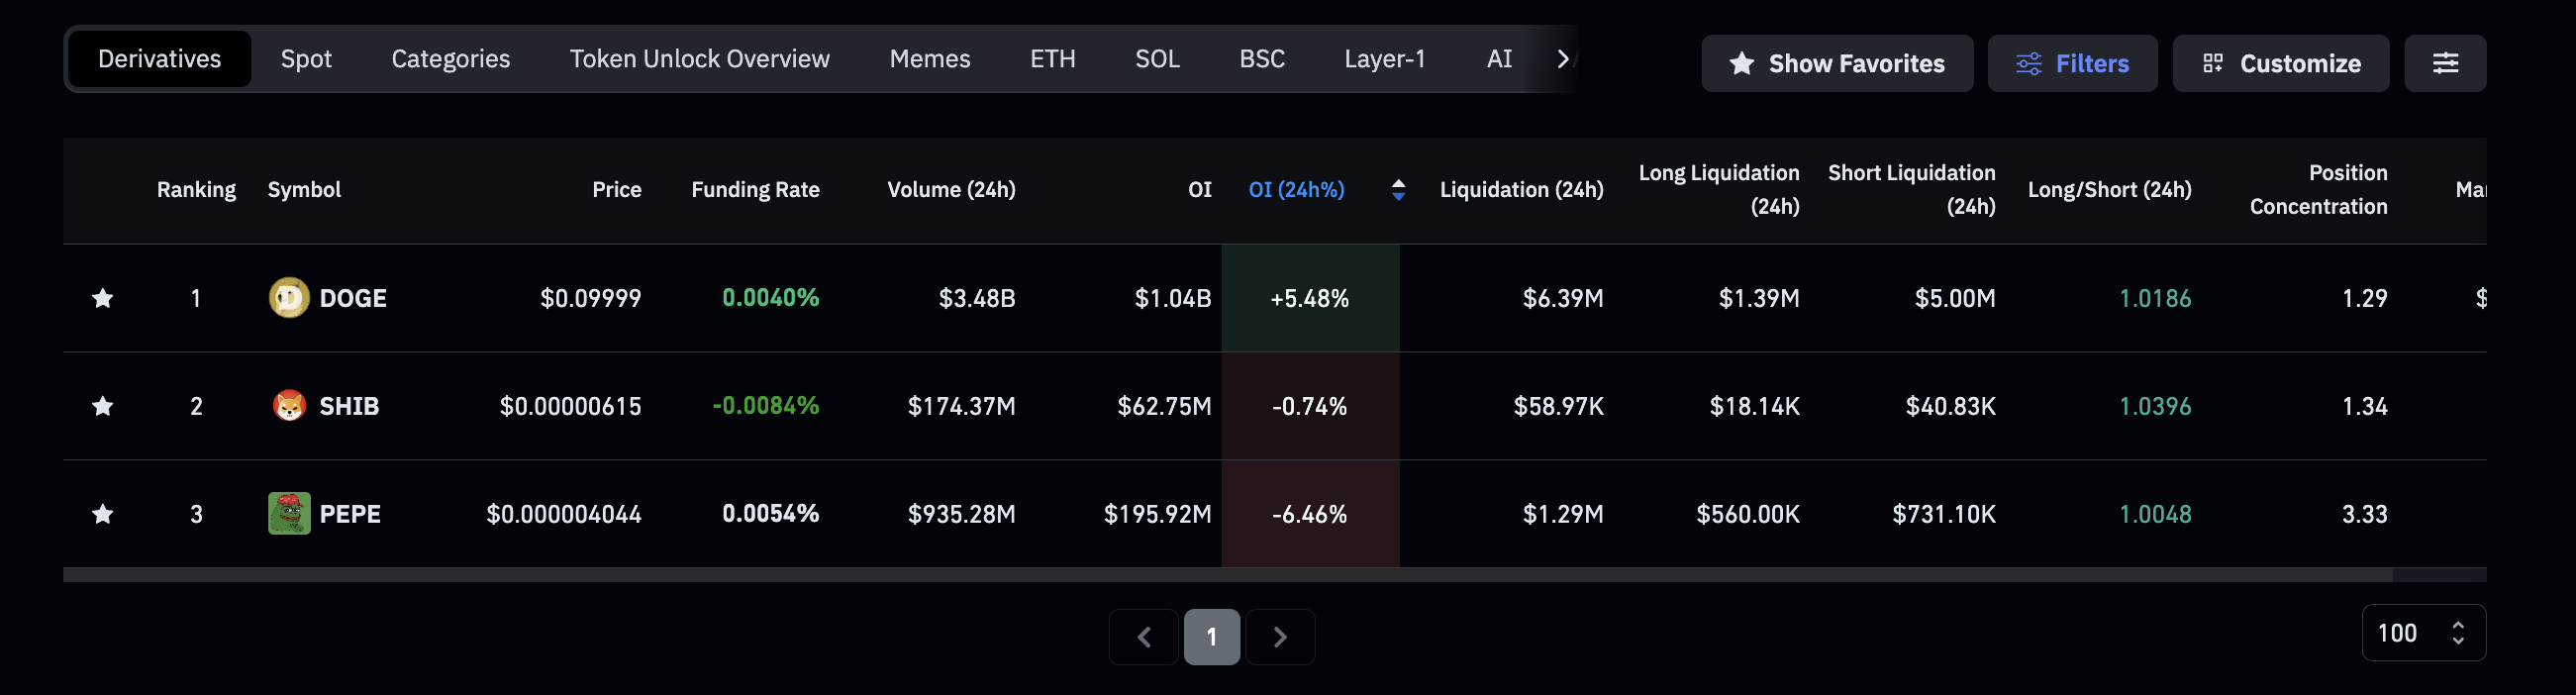
The derivatives data reflect a preference for Dogecoin, the market leader, as the segment leader as per market capitalization, over SHIB and the Frog team, the meme coin.
Meanwhile, CryptoQuant data shows increased whale interest in DOGE, SHIB, and PEPE, as measured by the average size of executed futures market orders. However, Dogecoin is the only meme coin with the taker-buy dominant order flow, as measured by the Cumulative Volume Delta (CVD), which tracks the difference between the market buy and sell volumes over the last 90 days.
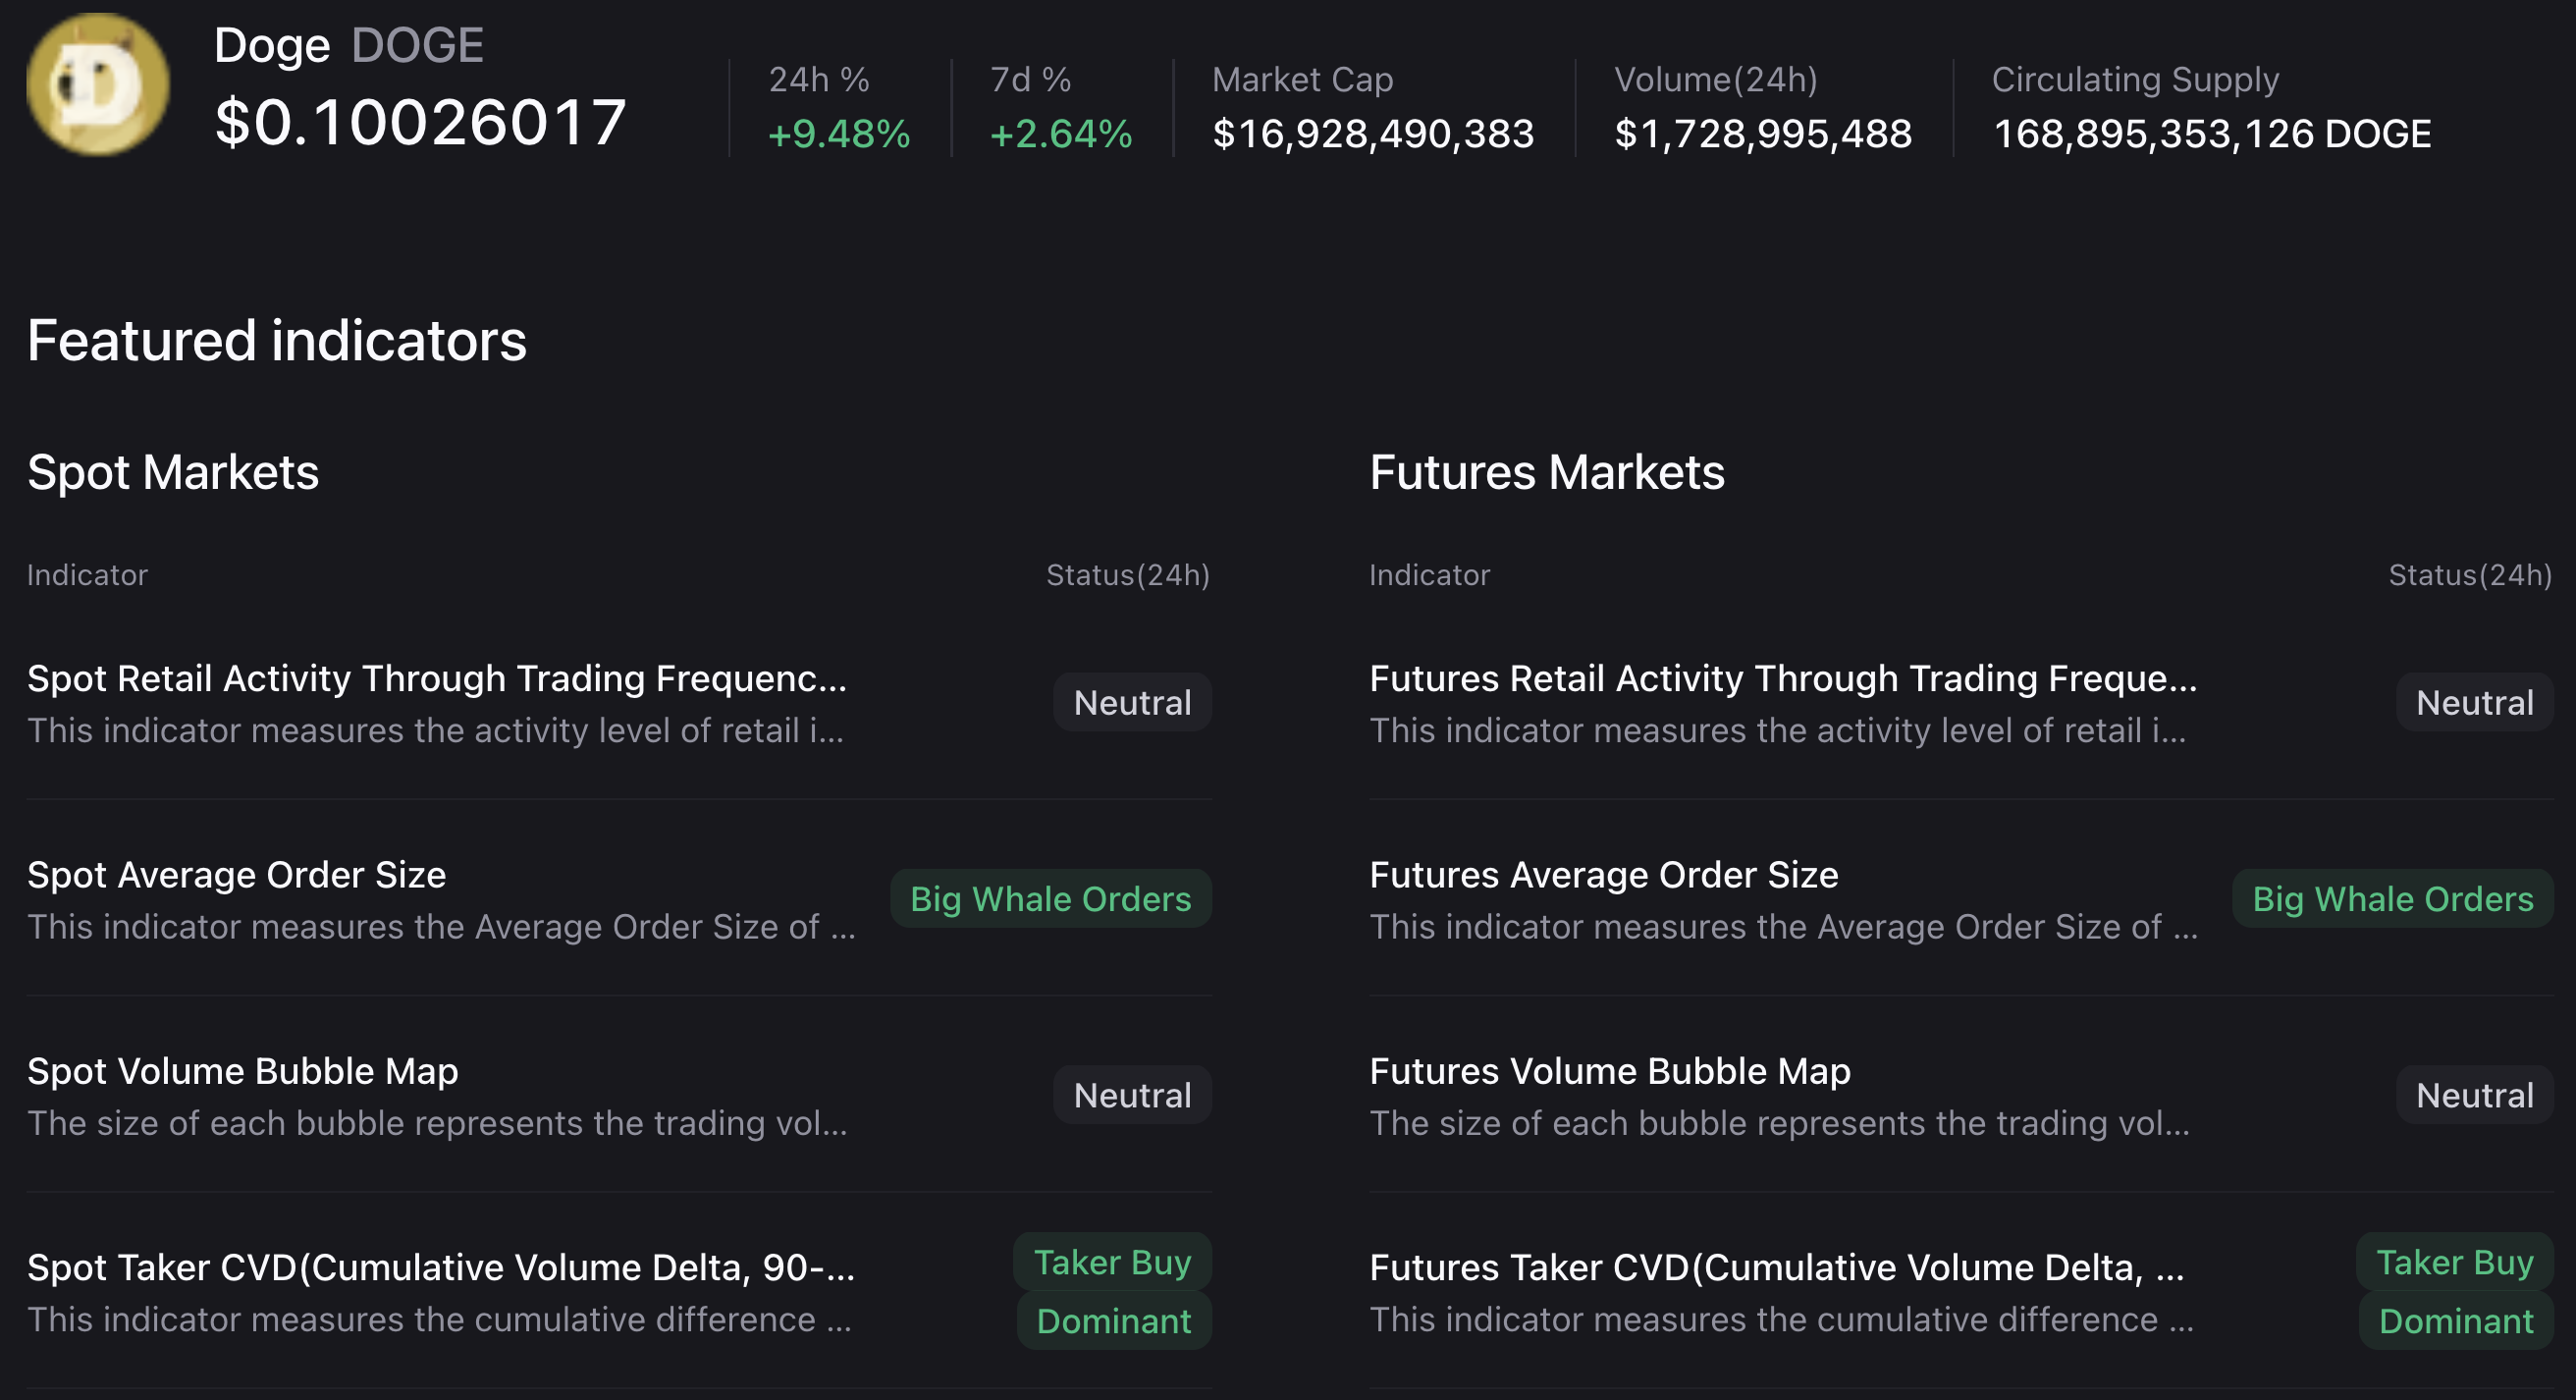
The futures taker CVD remains taker sell dominant for Shiba Inu, while it remains neutral for Pepe. This reaffirms Dogecoin's preference among derivative traders.

Dogecoin recovery tests the 50-day EMA
Dogecoin trades around $0.1000 at press time on Thursday, holding the 10% gains from the previous day after the 50-day EMA near $0.1108 capped the intraday recovery.
DOGE could face immediate resistance at the descending 50-day EMA at $0.1108 that caps recovery attempts, followed by the December 31 low at $0.1161.
The Moving Average Convergence Divergence (MACD) extends higher on the daily chart after bouncing off the signal line on Tuesday, suggesting improving bullish momentum. The Relative Strength Index (RSI) at 48 stays close to the midline on the same chart, reaffirming a reduced bearish bias.
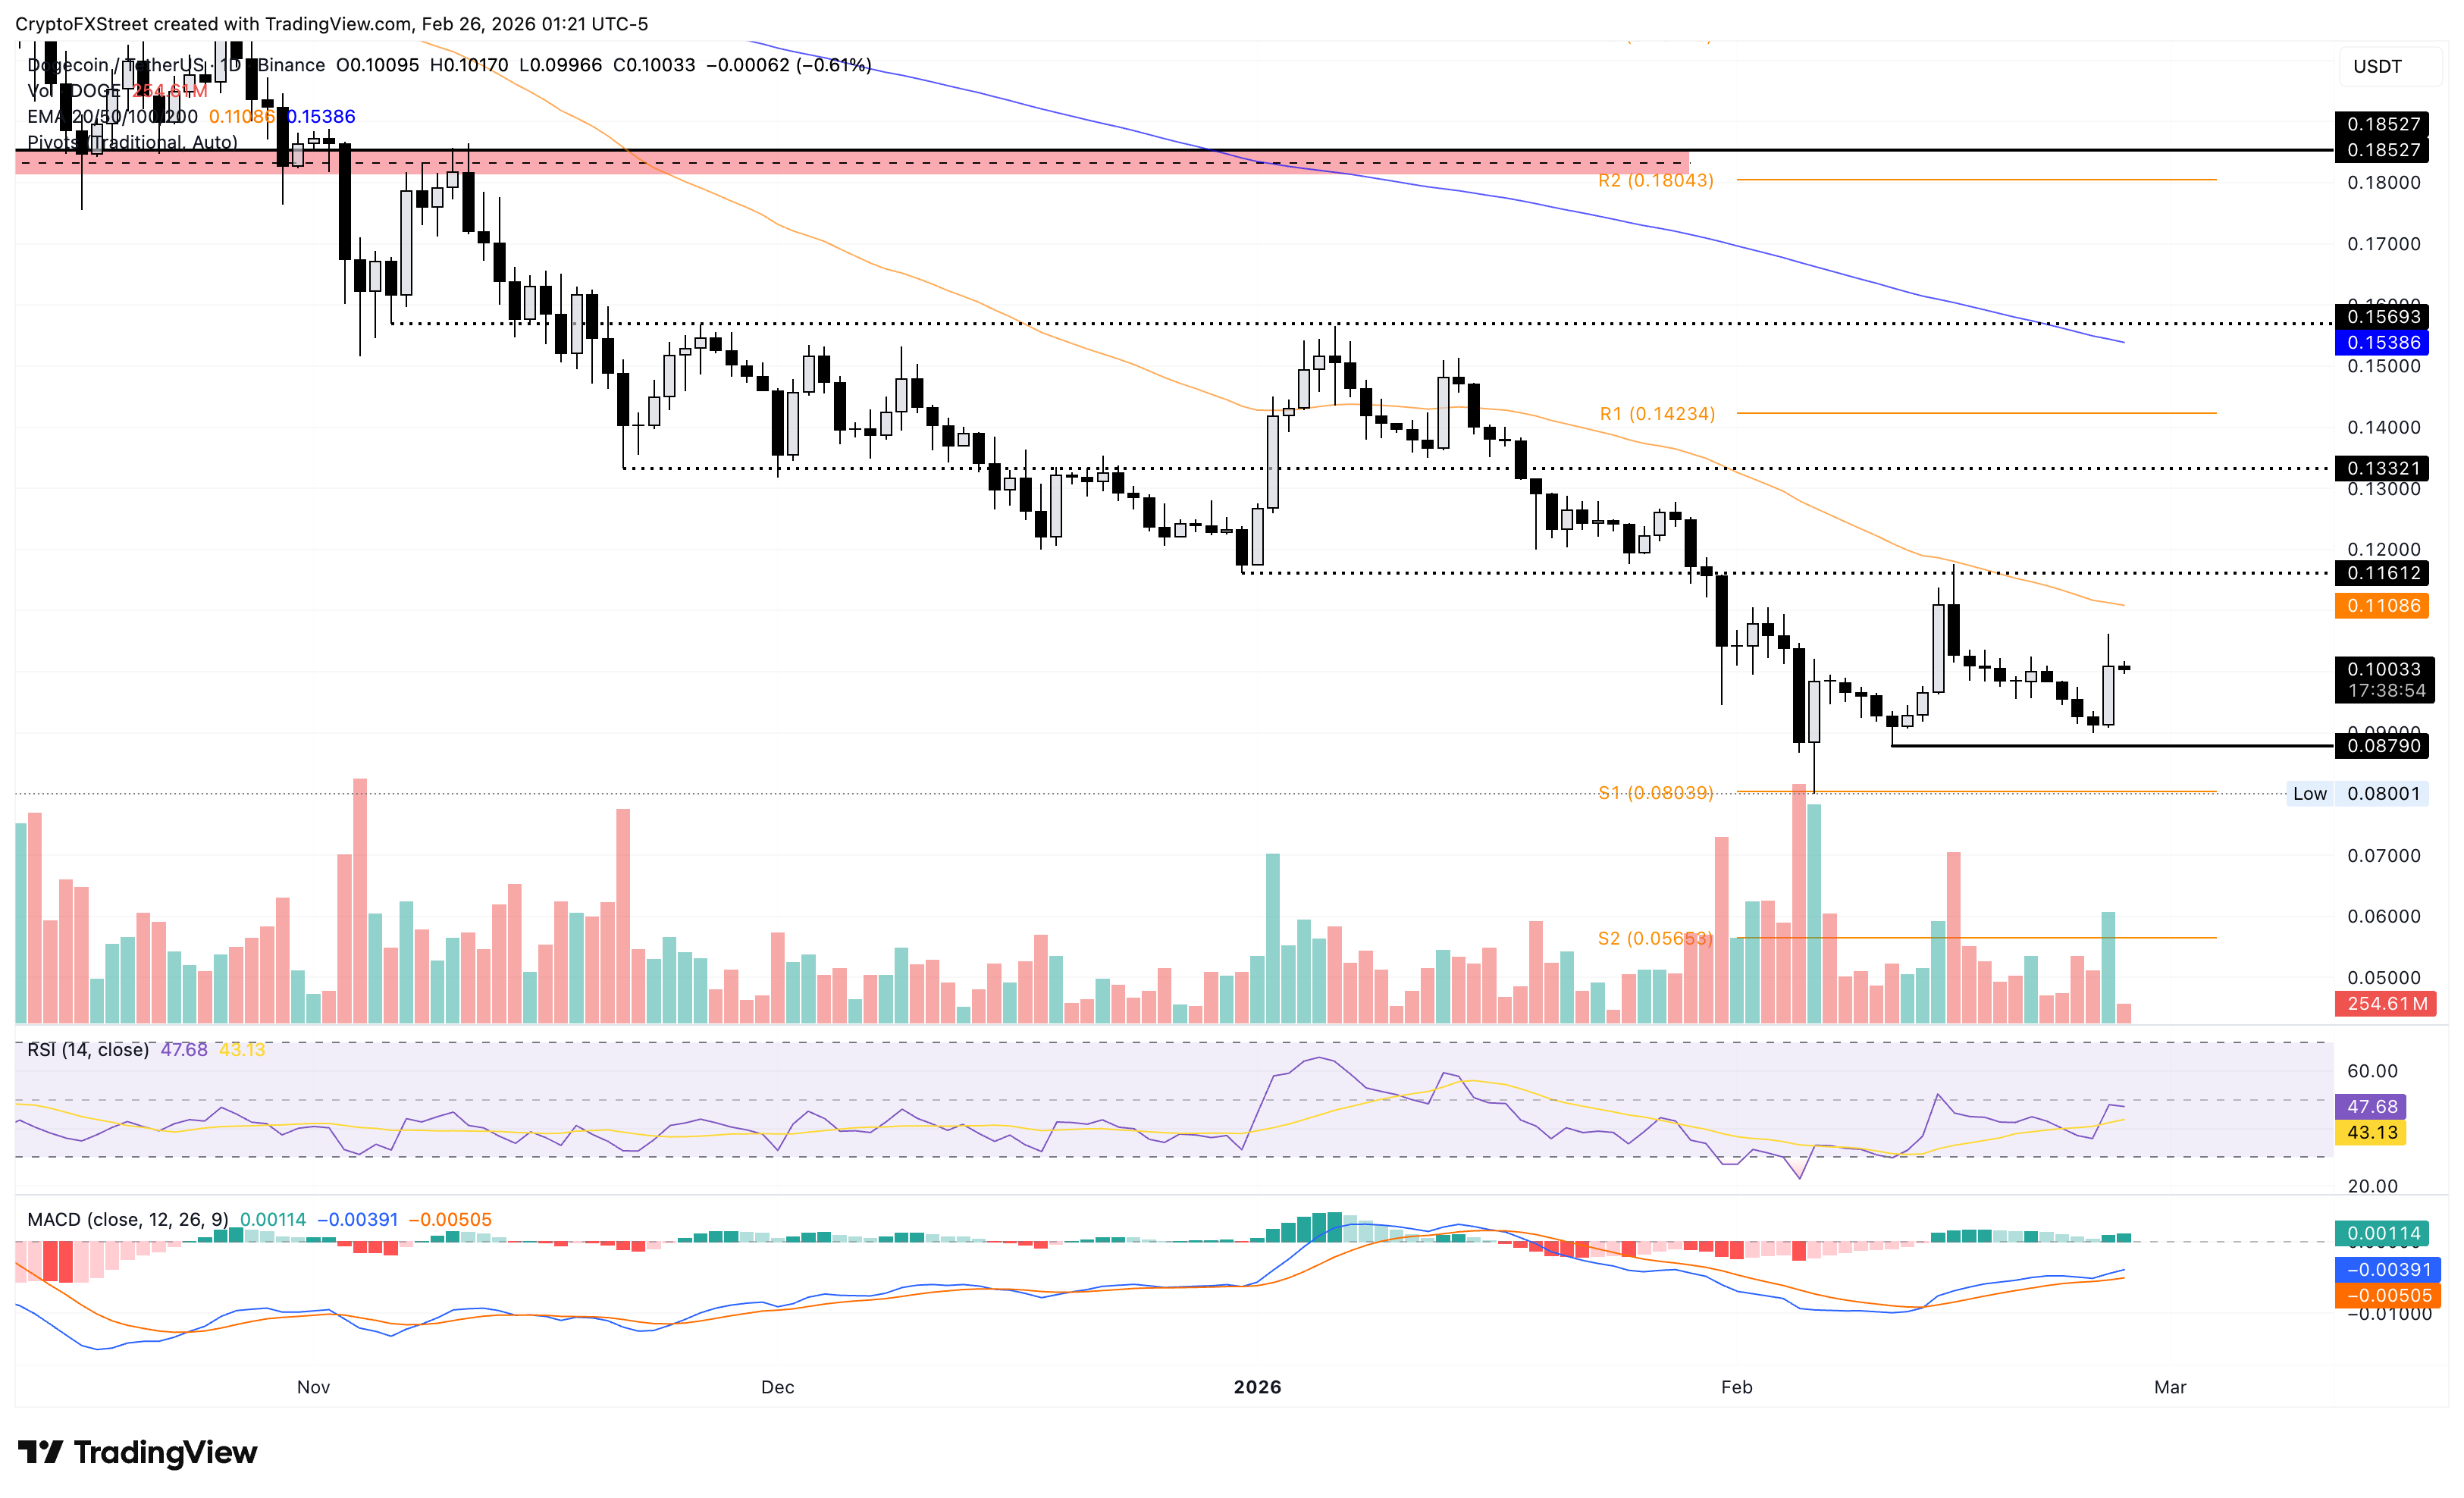
However, a negative close to the day would reinstate downside pressure, opening the door to the February 11 low at $0.0879.
Shiba Inu struggles to sustain gains
Shiba Inu is down nearly 2% at the time of writing on Thursday, losing strength after the 5% recovery on the previous day. The meme coin is trading significantly below its 50-day and 200-day EMAs at $0.00000692 and $0.00000921, respectively, reaffirming the prevailing bearish bias.
The immediate resistance for Shiba Inu lies at the the $0.00000700 supply zone, close to the 50-day EMA.
The RSI at 43 remains below the halfway line on the daily chart, with further downside before reaching the oversold zone. Meanwhile, the MACD and signal line are moving closer together, risking a bearish crossover.
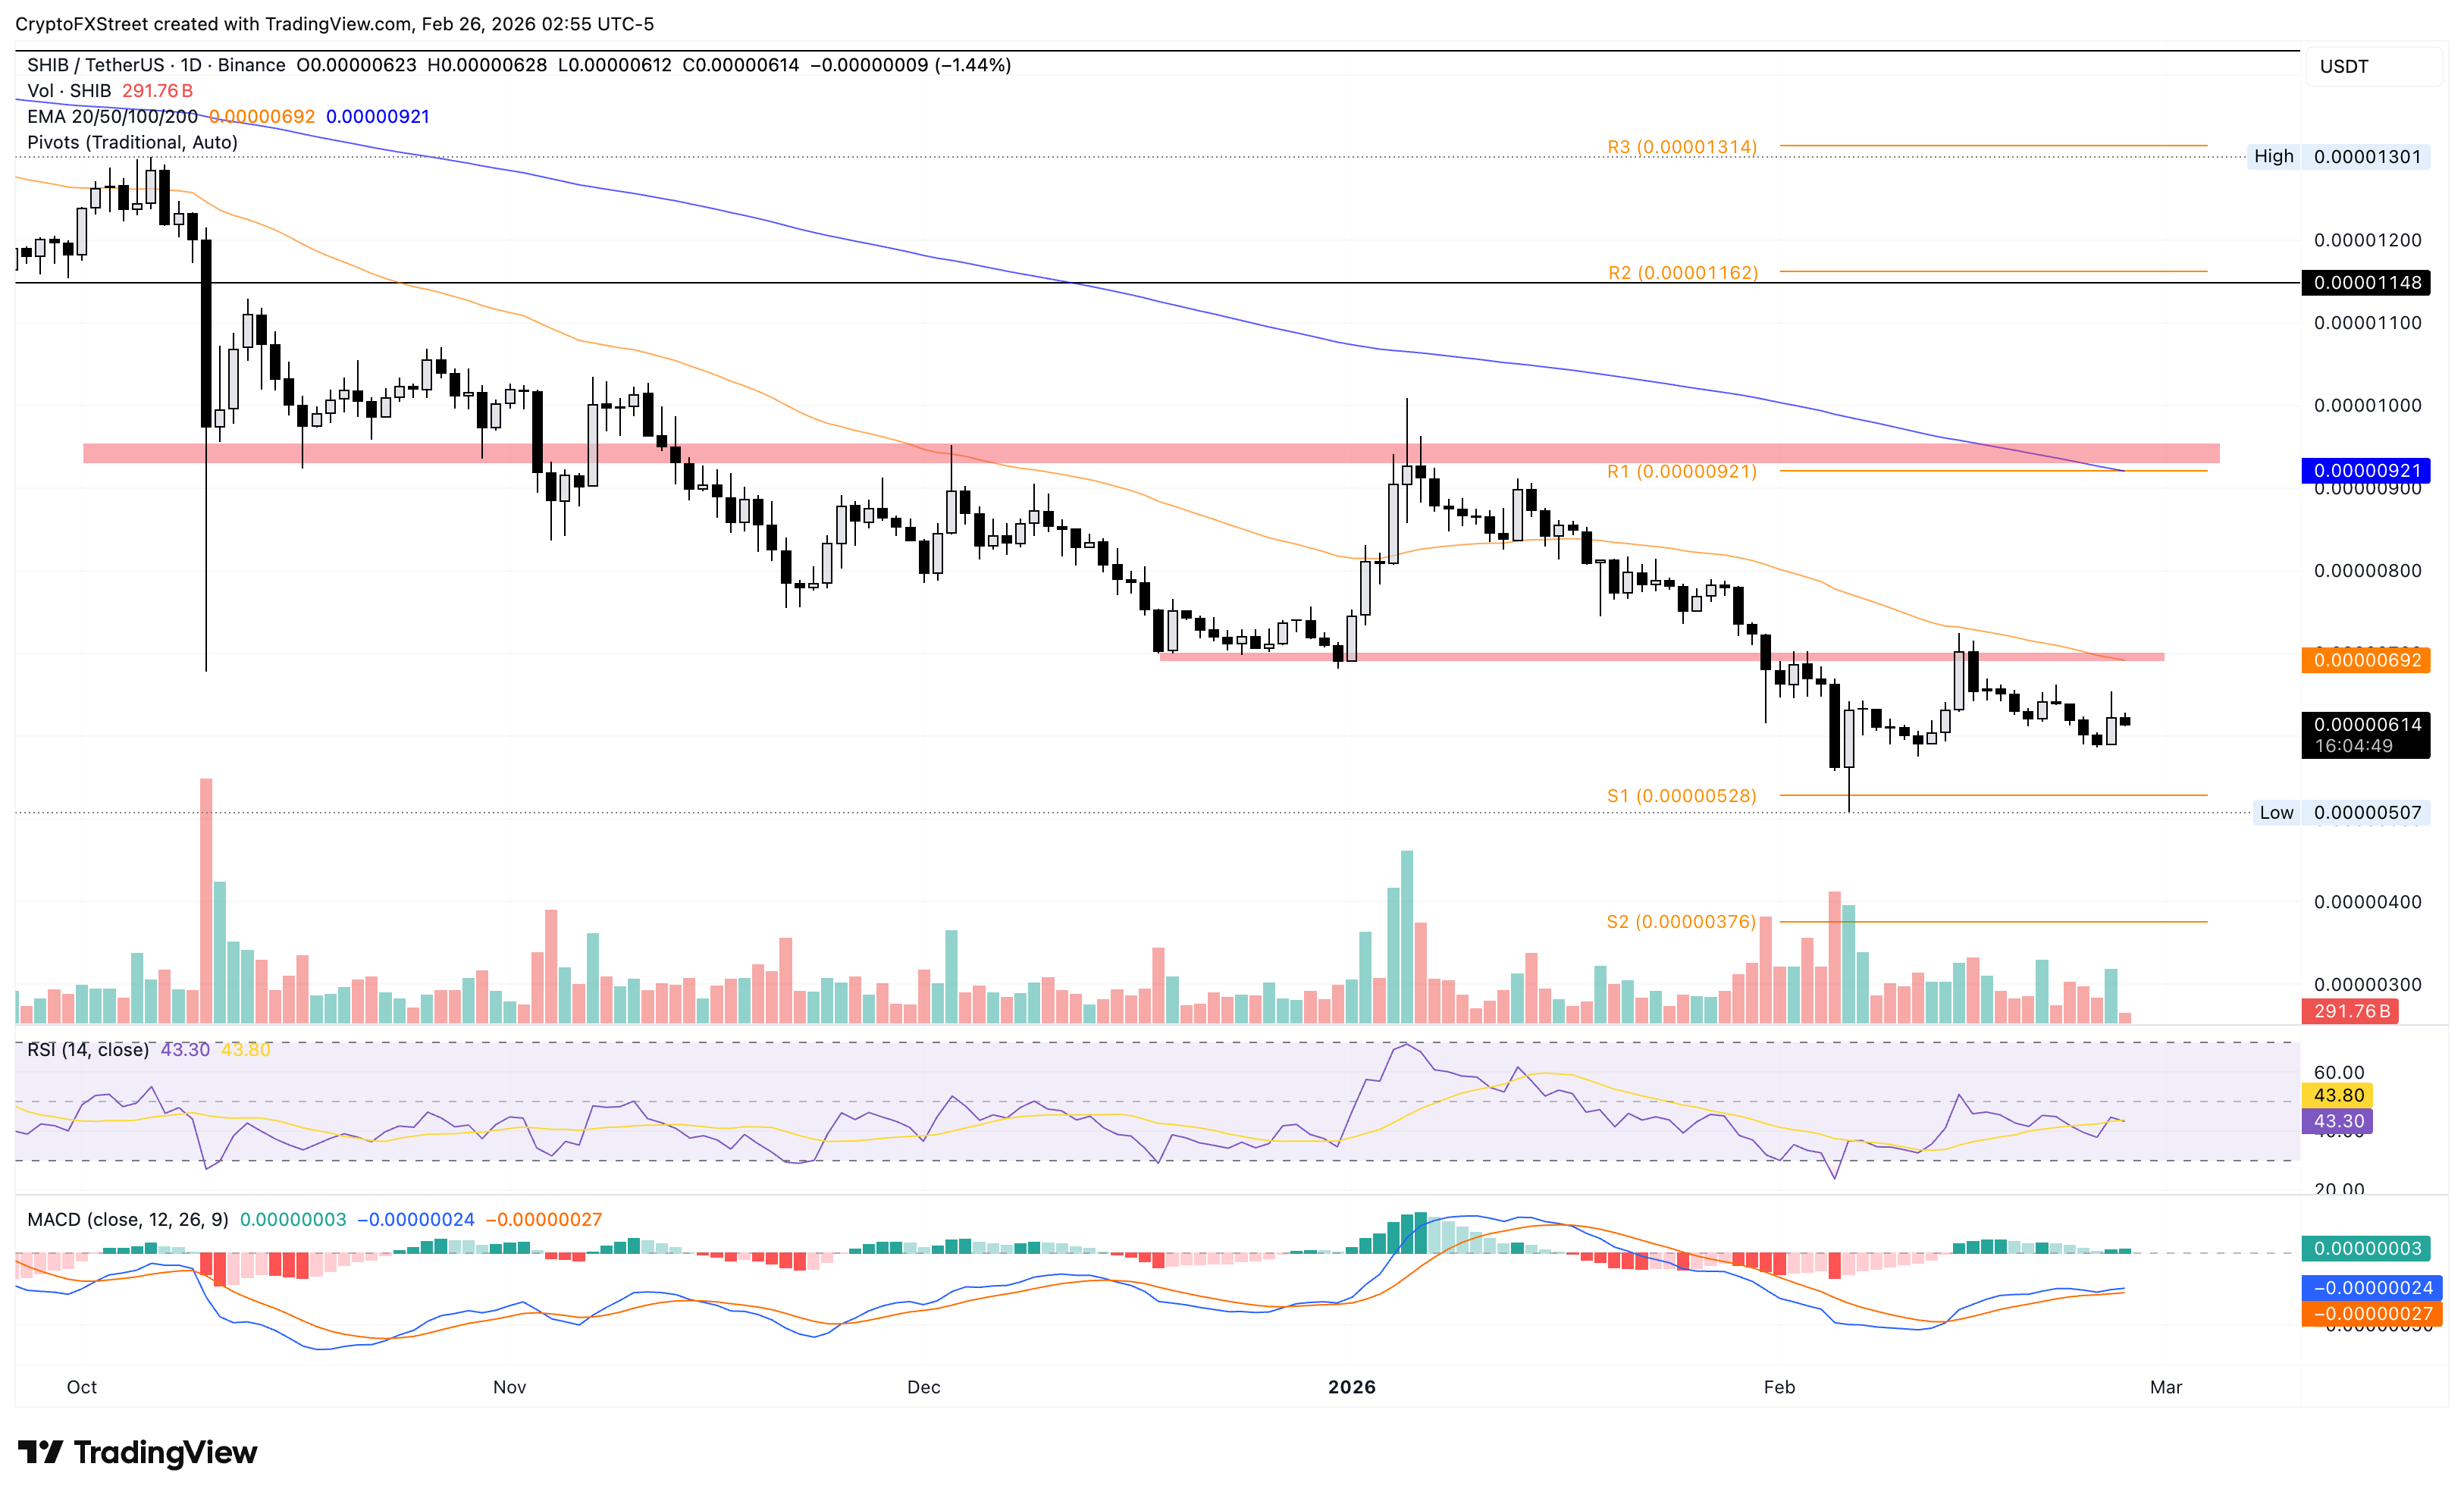
On the downside, the S1 pivot point at $0.00000528 could serve as the immediate support level. A decisive close below this level could threaten the $0.00000500 psychological support, opening the door to the S2 pivot point at $0.00000376.
Pepe remains under pressure
Pepe is down over 2% at the time of writing on Thursday, retracing after a roughly 5% rise the previous day. PEPE trades below the 50-day and 200-day EMAs, suggesting that the broader trend is bearish.
The MACD line converges with the signal line on the daily chart amid muted histogram bars, indicating reduced buying pressure that could lead to renewed bearish momentum. The RSI at 46 remains below the midline on the same chart, suggesting mild bearish pressure and further downside.
With price anchored at $0.00000400, with the immediate support at the December 18 low of $0.00000363, followed by a deeper zone at the S1 Pivot Point of $0.00000290.
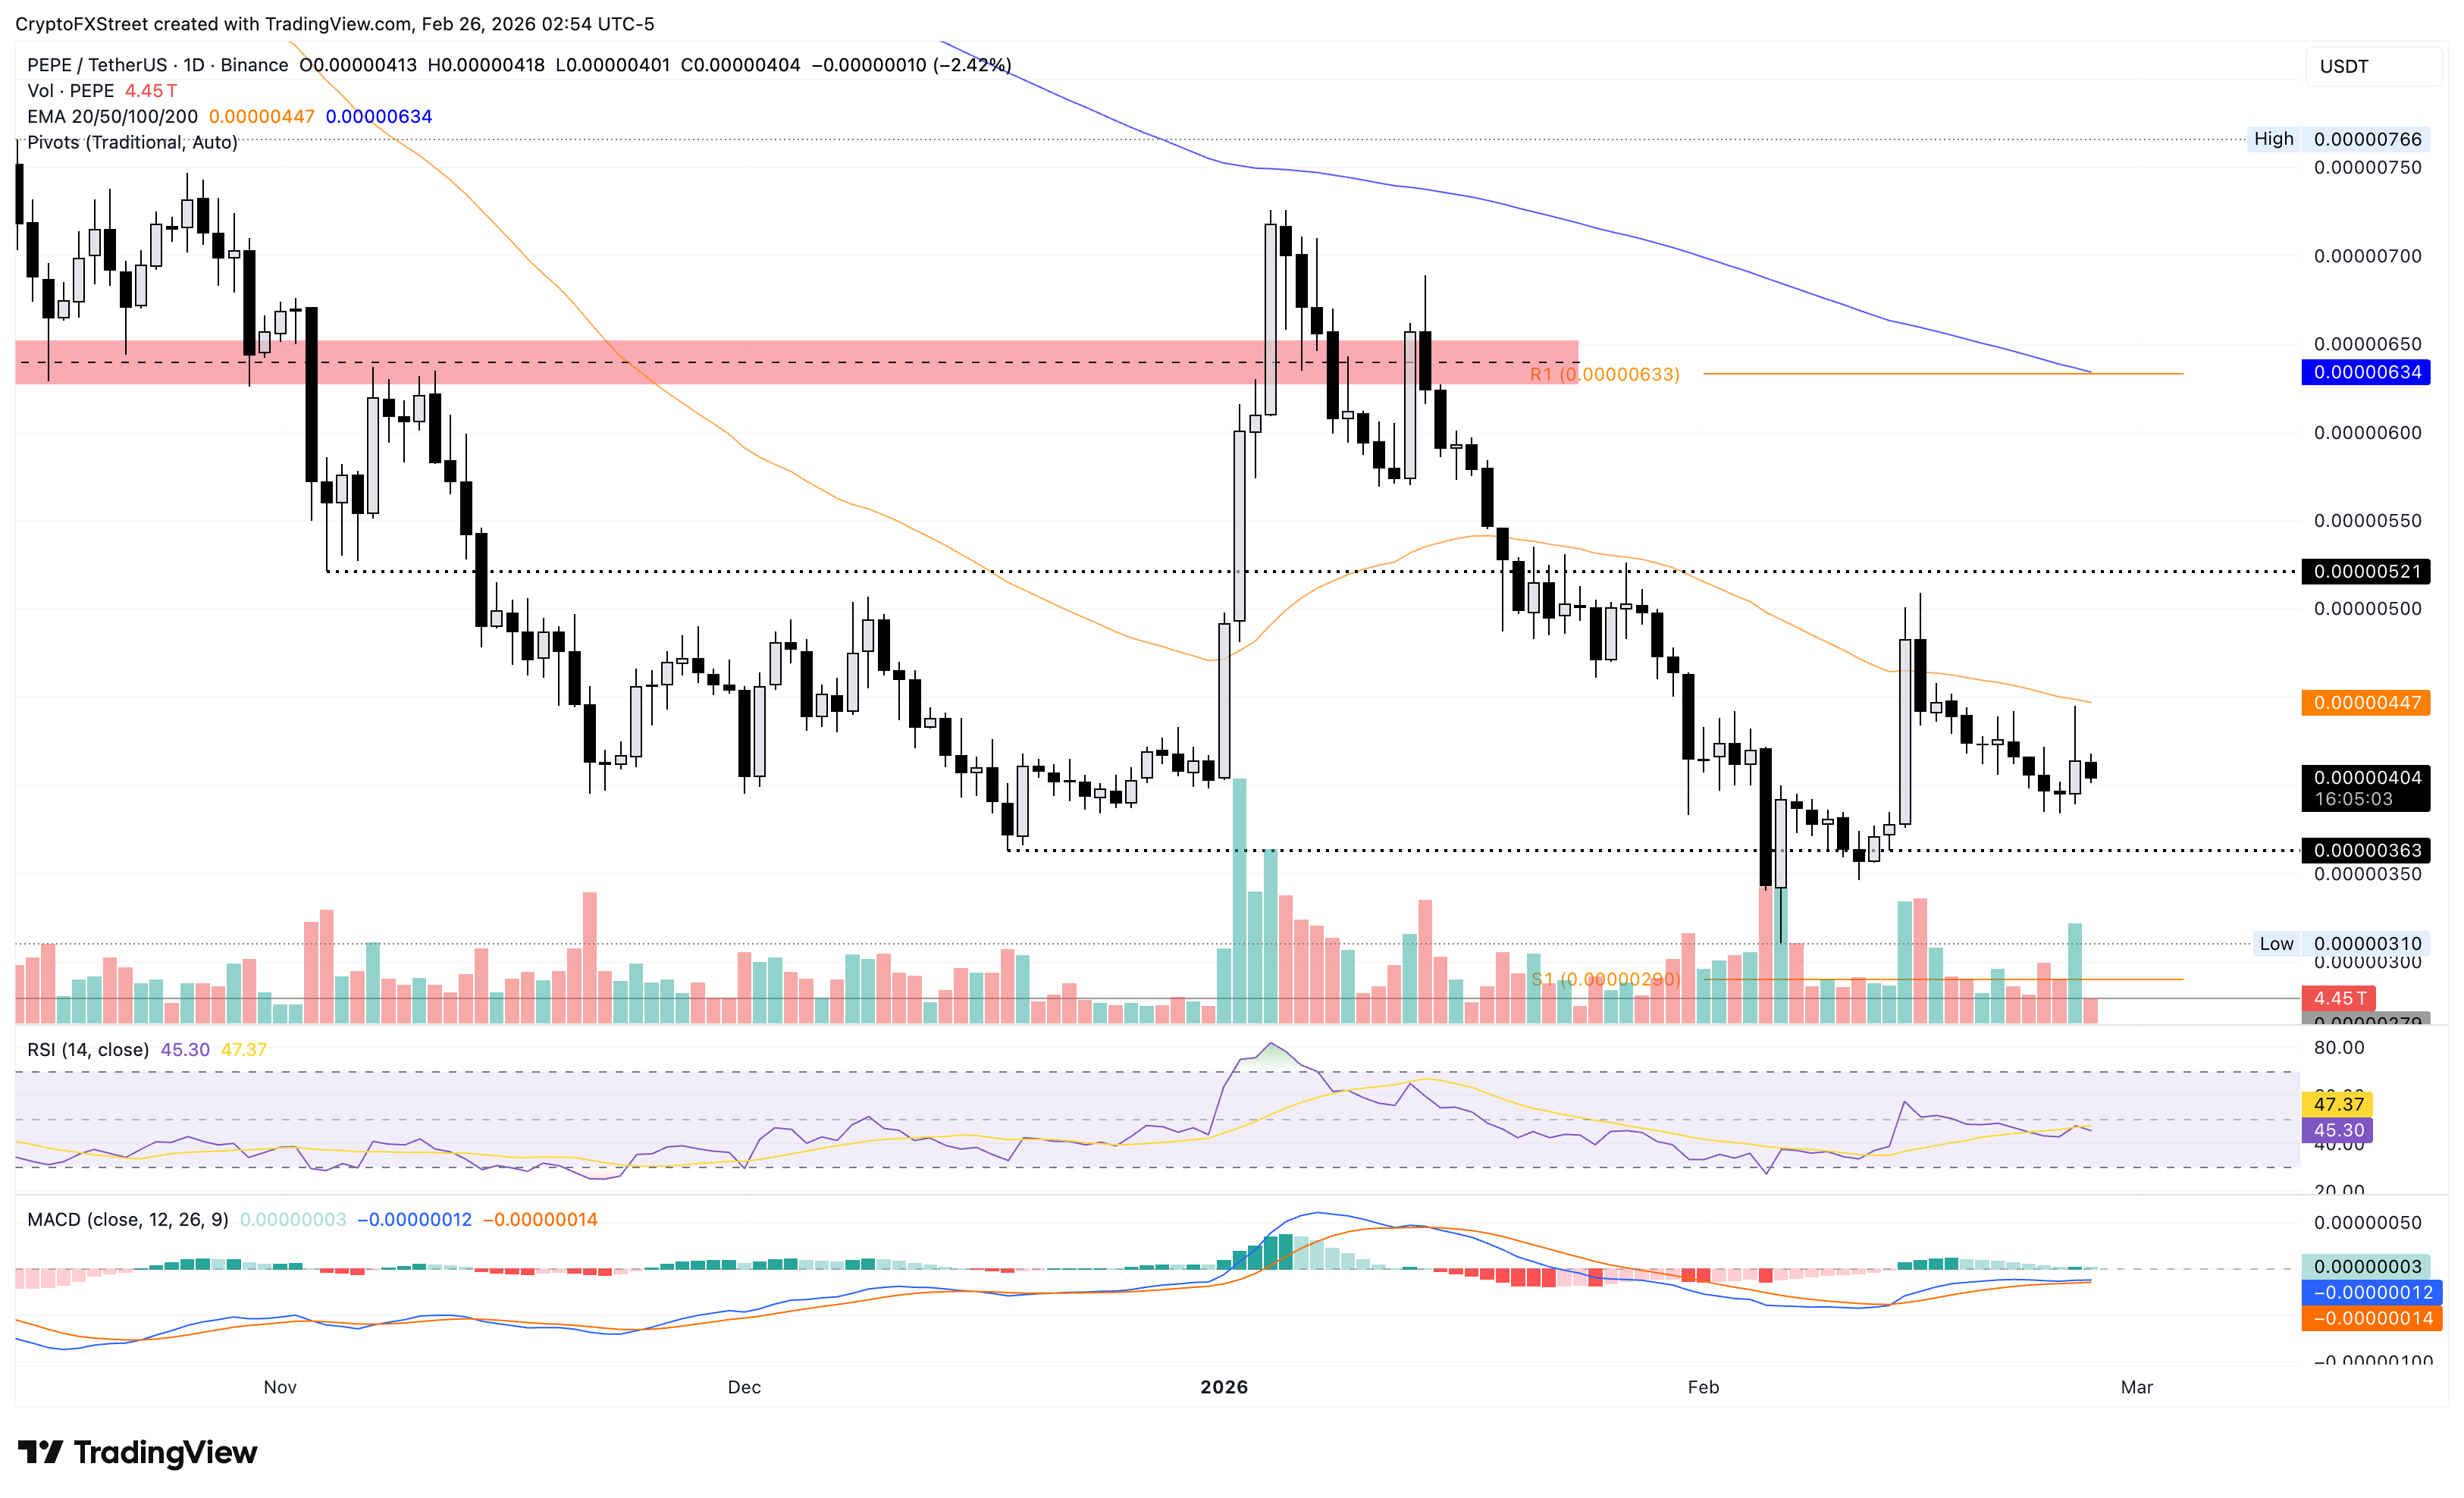
Looking up, PEPE should clear the 50-day EMA at $0.00000447 for any chances of a sustained recovery, which could target the November 4 low at $0.00000521.
(The technical analysis of this story was written with the help of an AI tool.)

Plus d’un million d’utilisateurs se tournent vers FXStreet pour des données de marché en temps réel, des outils de graphiques, des analyses d’experts et des actualités Forex. Leur calendrier économique complet et leurs webinaires éducatifs aident les traders à rester informés et à prendre des décisions éclairées. FXStreet s’appuie sur une équipe d’environ 60 professionnels répartis entre le siège de Barcelone et diverses régions du monde.
Lire la suite


