

NEAR Protocol Price Forecast: Revenue-backed buybacks fuel recovery momentum
- NEAR Protocol is up over 2% on Tuesday, extending its third consecutive day of recovery.
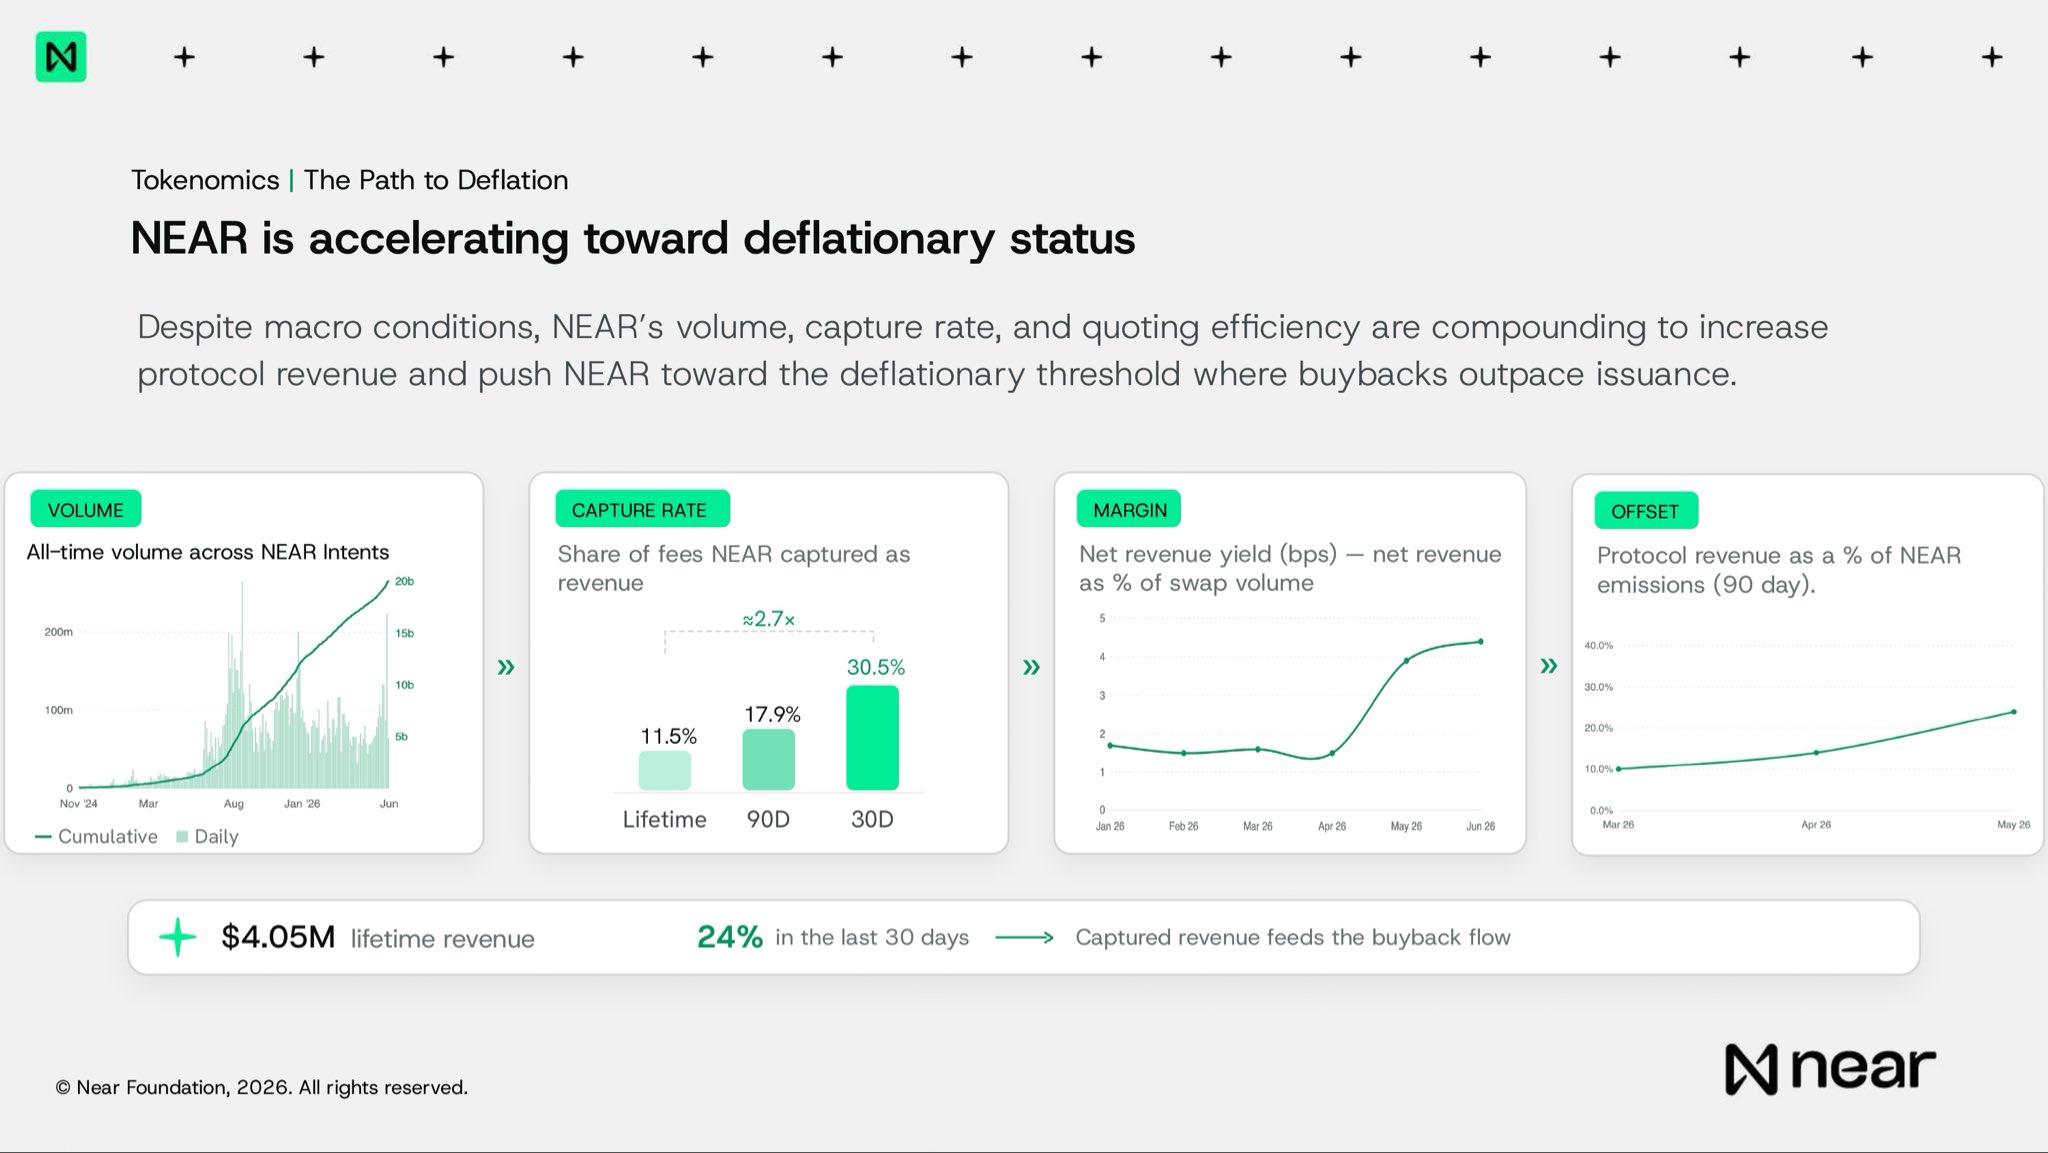
- On-chain data show that 24% of 30-day revenue feeds buybacks, while the capture rate jumps to 30% over the same period.
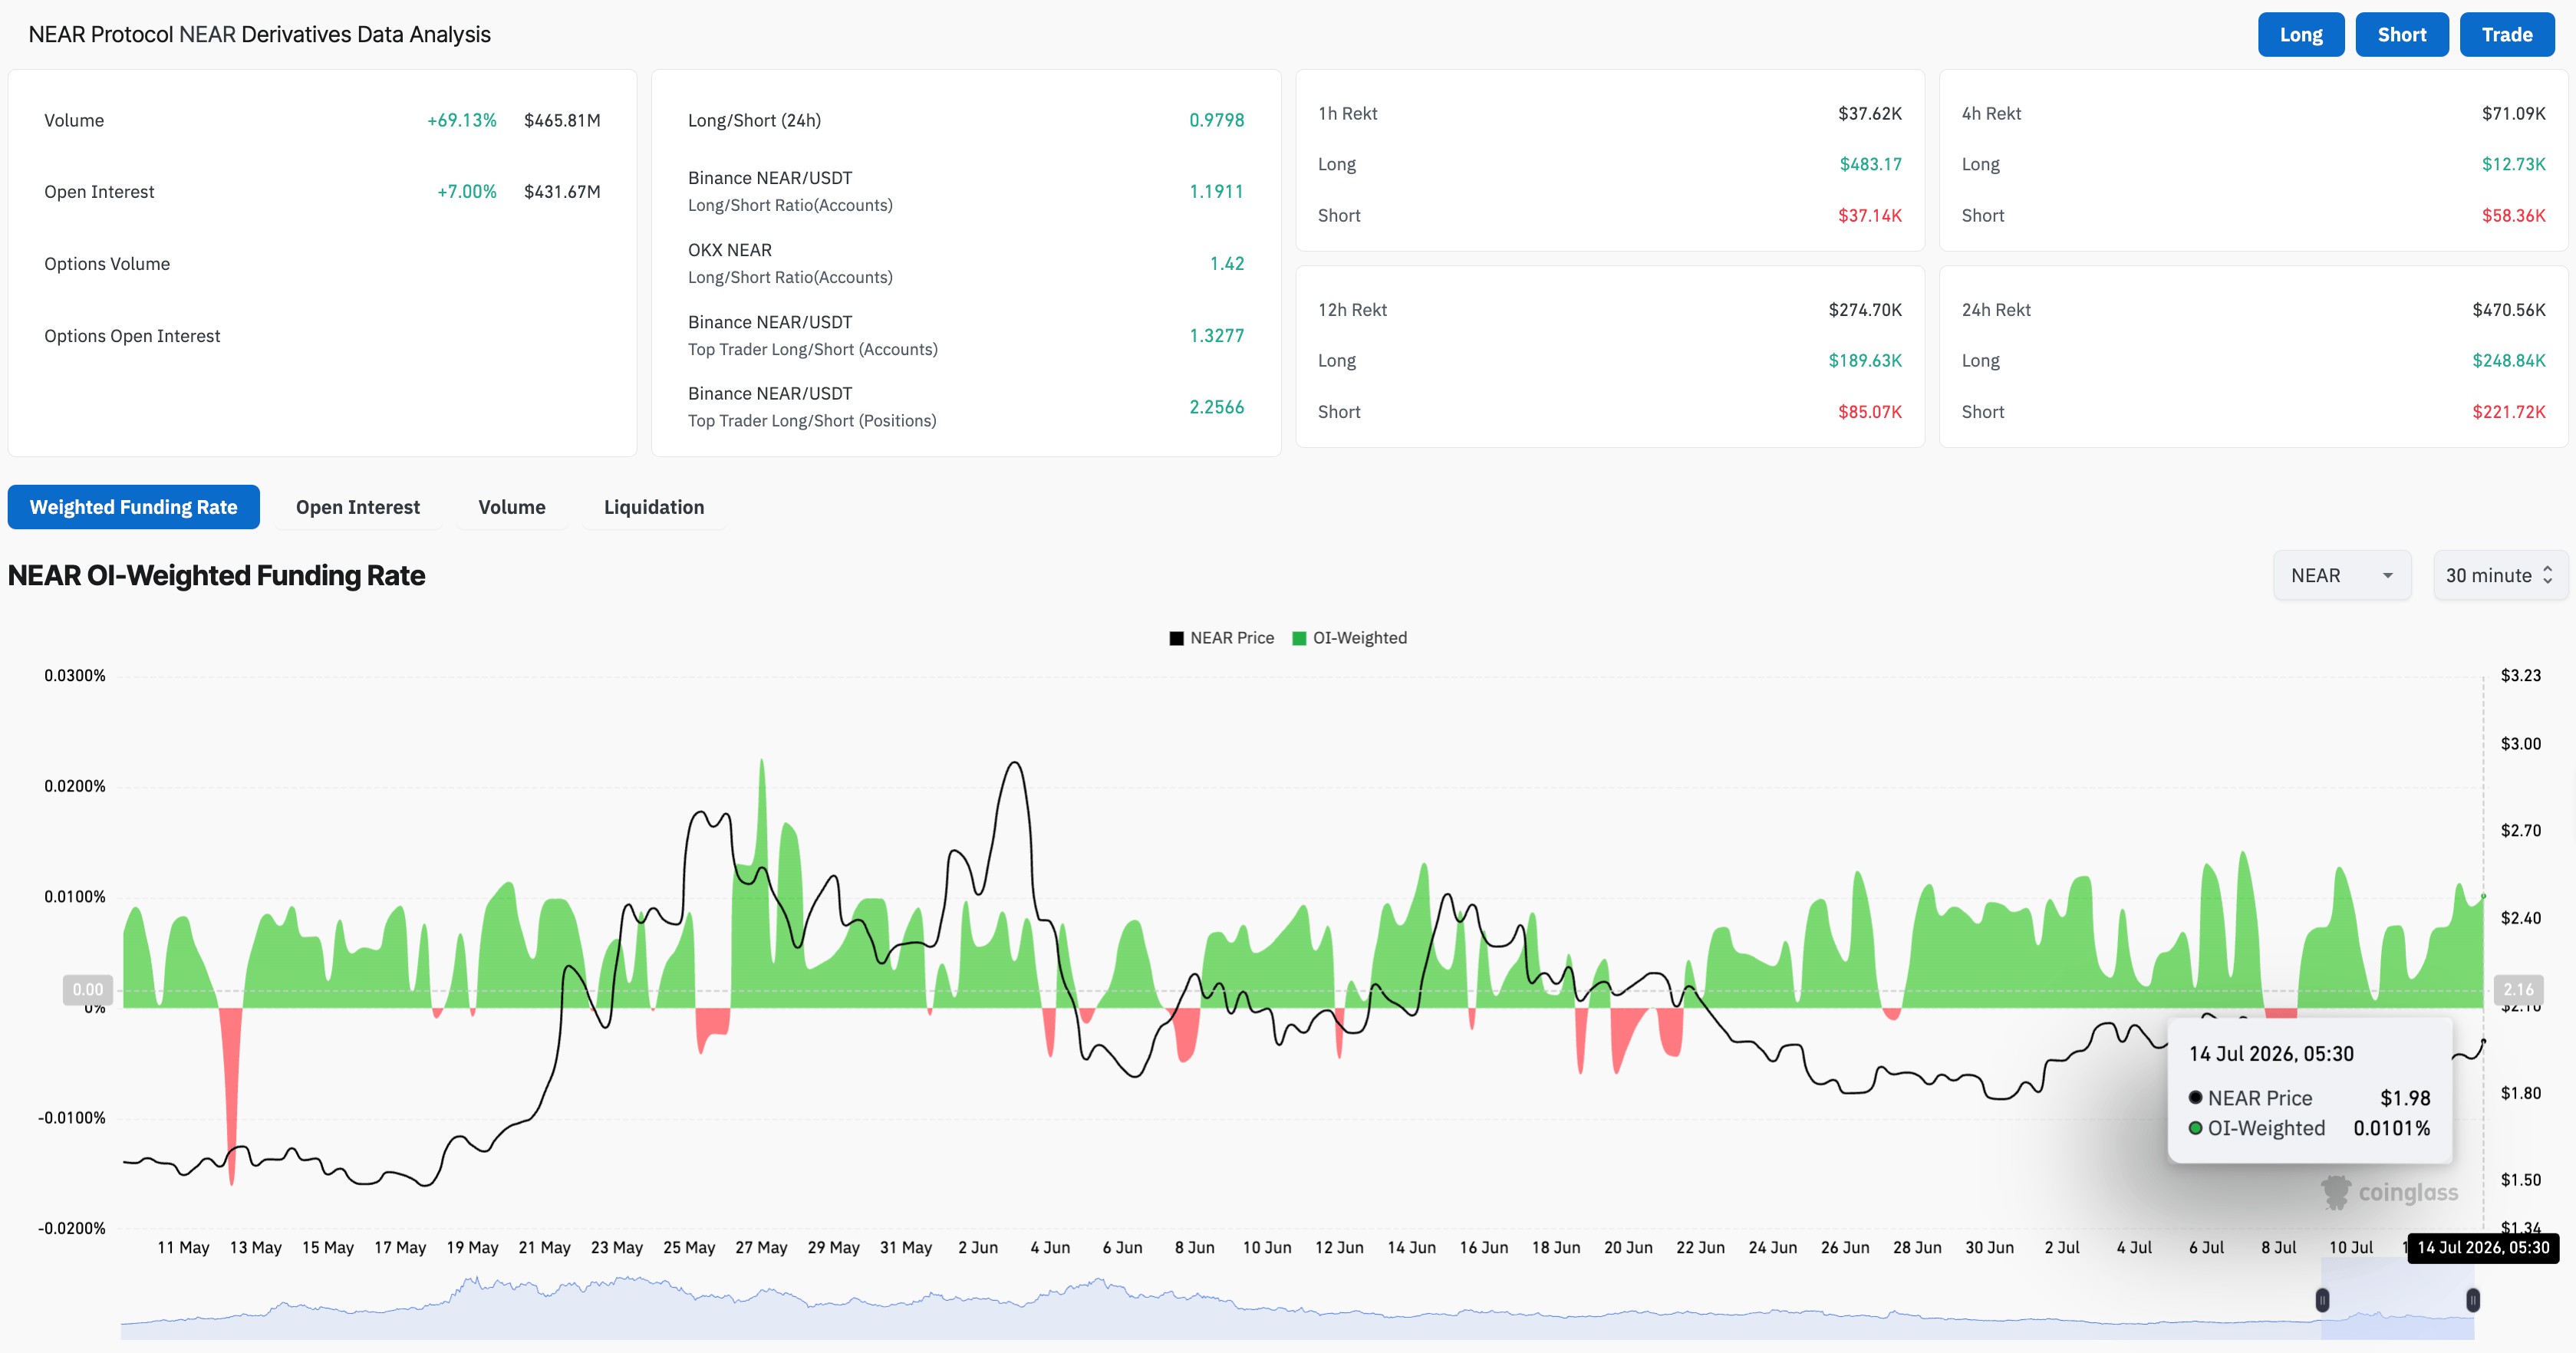
- Retail demand holds firm, with Open Interest up 7% over 24 hours, while funding rates remain positive.
NEAR Protocol (NEAR) price is up 2% on Tuesday, testing the breakout of its 50-day Exponential Moving Average (EMA) at $1.95. On-chain data show early signs of a deflationary mechanism, with the capture rate rising to 30% over 30 days and 24% of revenue being shifted toward buybacks. A 7% jump in NEAR futures Open Interest and a positive funding rate reflect retail support amid a near-term recovery phase.

Technically, NEAR must sustain a daily close above its 50-day EMA at $1.95 to extend its recovery toward $2.54.
Early signs of deflationary tokenomics
NEAR Intents, a new transaction primitive on NEAR Protocol, has increased revenue per similar transaction volume, indicating greater efficiency and fueling its buyback program. Typically, an increase in buybacks leads to greater demand for the token due to thinner supply and improved sentiment.
In a recent X post, NEAR Protocol announced that its all-time trading volume surpassed $22 billion, with lifetime revenue of $4.05 million. However, the capture rate – the share of NEAR captured as revenue – has jumped 30% over the last 30 days, with Net Revenue Yield (NRY) rising over 4% in June, up from around 1.50% in April. This increase in NRY suggests a higher percentage of revenue generated from swap volume, reaffirming the heightened revenue associated with Intents efficiency.
In addition, 24% of captured revenue feeds the buyback flow over the last 30 days, indicating early signs of a deflationary start.
On the retail side, CoinGlass data show that NEAR futures Open Interest (OI) is up 7% to $431.67 million over the last 24 hours, indicating a surge in the notional value of active positions. The positional buildup shows a bullish bias, with the funding rate at 0.0101% on Tuesday, indicating buyers are willing to hold long positions at a premium.
Will NEAR price rise above $2?
NEAR Protocol shows a steady recovery on Tuesday, inching closer to the $2.00 mark. The recovery is testing a breakout of a crucial resistance barrier, which includes the overhead trendline near the 50-day EMA at $1.95 and the 50% retracement at $1.96, measured over the $1.24-$3.08 upswing. A decisive close above the zone could test the 78.6% Fibonacci retracement level at $2.54, projecting an upside potential of roughly 20%.
Momentum stays supportive, with the Moving Average Convergence Divergence (MACD) rising above its signal line with renewed positive histograms, as the Relative Strength Index (RSI) rises toward to the neutral 50 mark, hinting at room for further upside move.
On the downside, initial support is seen at the reclaimed support trendline level near $1.87, reinforced by the 200-day EMA at $1.79.
(The technical analysis of this story was written with the help of an AI tool. Know more.)














