
Official Trump Price Forecast: TRUMP meme coin drops on bearish derivatives data and whale token sale
Par Manish Chhetri
Date de publication: 27 Feb 2026 | Date de modification: 27 Feb 2026


ARTICLES POPULAIRES

Official Trump (TRUMP) continues to face selling pressure, trading below $3.50 at the time of writing on Friday after being rejected at a key resistance level earlier this week.
- Official Trump price extends its decline on Friday after being rejected at key resistance earlier this week.
- Derivatives metrics support a bearish bias, with funding rates turning negative alongside short positions increasing.
- Lookonchain reports whale deposited 5 million TRUMP tokens over the past 24 hours, most of which originated from Official Trump Meme Team allocation wallets.
Official Trump (TRUMP) continues to face selling pressure, trading below $3.50 at the time of writing on Friday after being rejected at a key resistance level earlier this week. TRUMP’s short-term structure remains fragile, with derivatives data showing negative funding rates and rising short positioning, signaling growing bearish conviction. In addition, Lookonchain reported that a whale linked to the Official Trump Meme Team allocation wallets deposited tokens, raising concerns.
Derivatives data shows bearish bias
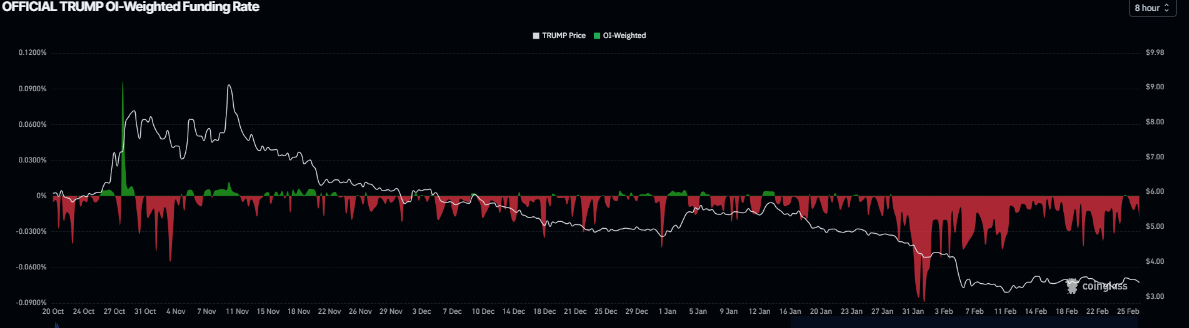
TRUMP’s derivatives data supports a bearish bias. The meme coin funding rate flipped negative on Wednesday and stands at -0.019% on Friday, according to CoinGlass. The negative metric suggests that shorts are paying longs, suggesting bearish sentiment toward Official Trump.
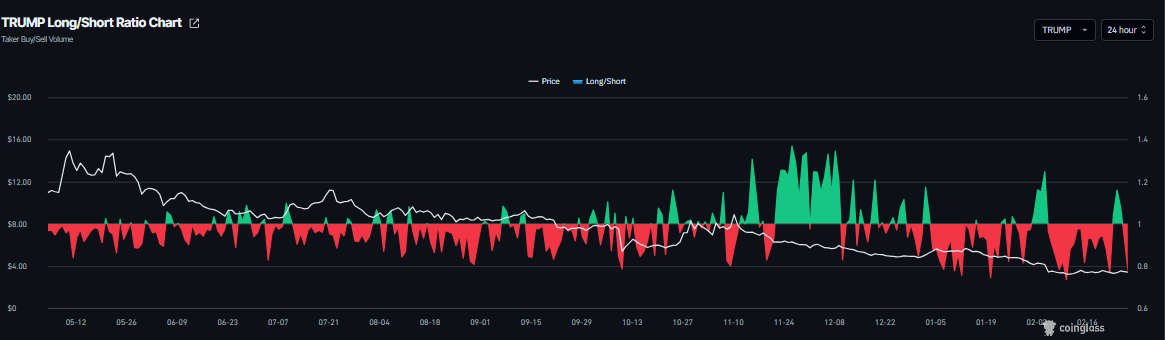
In addition, TRUMP’s long-to-short ratio stands at 0.78 on Friday, nearing its lowest level in over a month. This ratio below 1 indicates bearish sentiment as traders are betting on the meme coin price to fall.
Whales offloading tokens increase selling pressure
On-chain tracker Lookonchain reported on Friday via its X account that a whale deposited 5 million TRUMP tokens worth $17.3 million into the Binance exchange over the past 24 hours.
The post further explained that most of these meme tokens were received from Official Trump Meme Team allocation wallets, and that such a transfer could potentially increase near-term supply pressure, thereby increasing selling pressure.
Official Trump Price Forecast: Extends declines after rejection from key resistance level
Official Trump price is trading down at $3.40 as of writing on Friday. The near-term tone stays mildly bearish below the broken descending trend-line resistance around $3.94 and under the 50- and 100-day Exponential Moving Averages, which continue to slope lower and cap the upside.
Momentum has stabilized but not reversed, with the Relative Strength Index (RSI) on the daily chart recovering from oversold territory yet holding below the 50 line, while the Moving Average Convergence Divergence (MACD) indicator remains in positive territory with the MACD line only modestly above the signal line, suggesting a weak recovery within a broader corrective phase.
Immediate resistance aligns at the recent horizontal barrier of $3.58, with the 23.6% Fibonacci retracement of the $3.03–$5.78 downswing at $3.67 reinforcing a nearby cap ahead of the broken trend-line region near $3.94.
On the downside, initial support is seen at $3.21, followed by the key psychological level at $3.00, while the swing low around $3.03 marks a key bearish target if sellers regain control.
A daily close back above $3.67 would ease immediate downside pressure, whereas a break beneath $3.2127 would open the way for a retest of the $3.03 floor.
(The technical analysis of this story was written with the help of an AI tool.)

Plus d’un million d’utilisateurs se tournent vers FXStreet pour des données de marché en temps réel, des outils de graphiques, des analyses d’experts et des actualités Forex. Leur calendrier économique complet et leurs webinaires éducatifs aident les traders à rester informés et à prendre des décisions éclairées. FXStreet s’appuie sur une équipe d’environ 60 professionnels répartis entre le siège de Barcelone et diverses régions du monde.
Lire la suite


