
Pi Network Price Forecast: PI holds on thin ice with 76 million tokens ready to be unlocked
Par Vishal Dixit
Mis à jour: 1 Jul 2026


ARTICLES POPULAIRES

Pi Network (PI) is holding steady around $0.1150 on Wednesday, stabilizing after three consecutive days of losses of around 10%. Pi remains under pressure, with more than 76 million tokens scheduled for unlocking in June, potentially accelerating the bearish trend.
- Pi Network holds steady above $0.1100 on Wednesday after three consecutive days of losses earlier this week.
- PiScan data shows over 76 million PI tokens to be unlocked in July, which could accelerate Pi Network’s declining trend.
- The technical outlook for PI signals a mild recovery in a broader correction phase as momentum remains oversold.
Pi Network (PI) is holding steady around $0.1150 on Wednesday, stabilizing after three consecutive days of losses of around 10%. Pi remains under pressure, with more than 76 million tokens scheduled for unlocking in June, potentially accelerating the bearish trend. From a technical standpoint, the minor pause in the PI token’s decline, caused by oversold momentum, could be short-lived.
Scheduled token unlock could exert downside pressure
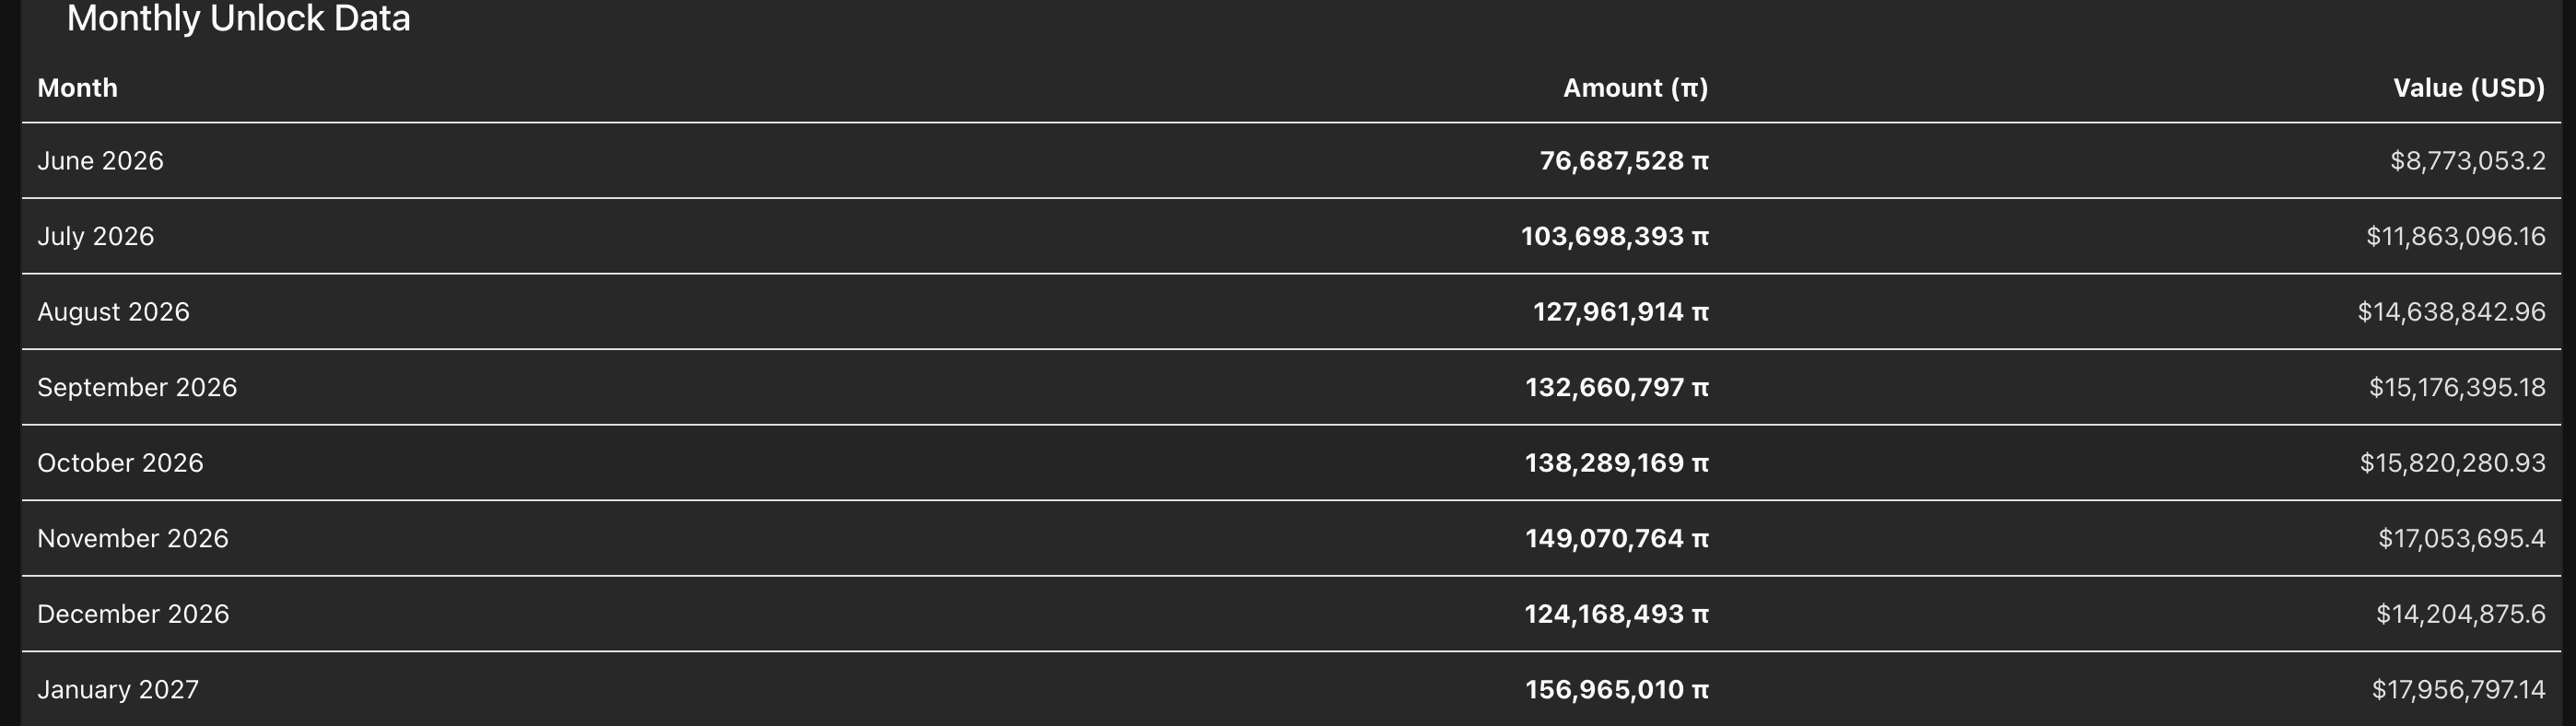
PiScan data shows 76.68 million PI tokens to be unlocked in July, with daily emissions. Despite the controlled release of PI tokens, the sheer volume of unlocked supply and the declining investors' confidence could result in a steady supply dump.
Pi Network risks extended correction after a brief pause
Pi Network makes a sideways move, trading around $0.1150 at press time on Wednesday, after a steady three-day decline of about 10%. Still, PI maintains a bearish near-term bias as price holds significantly beneath both the 50-period Exponential Moving Average (EMA) on the 4-hour chart at $0.1231 and the 200-period EMA near $0.1329.
The mild recovery retraces toward the 23.6% Fibonacci retracement level at $0.1156, measured over the three-day decline from $0.1341 to $0.1111, acting as immediate overhead supply. A decisive close above this level could trigger an extended recovery toward the 50% retracement at $0.1220, near the 50-day EMA at $0.1231.
The Relative Strength Index (RSI) is nearly flat at 32 on the 4-hour chart, suggesting oversold momentum, while the Moving Average Convergence Divergence (MACD) shows an uptick toward its signal line, hinting at slowing downside momentum rather than a confirmed reversal.
However, the mild recovery could succumb under pressure from the token unlocks and waning retail interest. Looking down, a slip below the $0.1111 record low could target the 127.2% Fibonacci extension level at $0.1055.
(The technical analysis of this story was written with the help of an AI tool.)

Plus d’un million d’utilisateurs se tournent vers FXStreet pour des données de marché en temps réel, des outils de graphiques, des analyses d’experts et des actualités Forex. Leur calendrier économique complet et leurs webinaires éducatifs aident les traders à rester informés et à prendre des décisions éclairées. FXStreet s’appuie sur une équipe d’environ 60 professionnels répartis entre le siège de Barcelone et diverses régions du monde.
Lire la suite


