
Pi Network Price Forecast: PI loses steam despite the launch of smart contracts on testnet
Par Vishal Dixit
Mis à jour: 22 Apr 2026


ARTICLES POPULAIRES

Pi Network (PI) is trading around $0.1700 at press time on Wednesday, reflecting a broader retracement within a falling channel pattern. The launch of smart contracts on the Pi Testnet under a subscription model marks functionality-focused expansion through consistent protocol upgrades.
- Pi Network hovers near $0.1700 on Wednesday after a roughly 3% drop the previous day.
- Pi Network launched subscription-based smart contract capabilities on its testnet, marking a step forward toward network expansion.
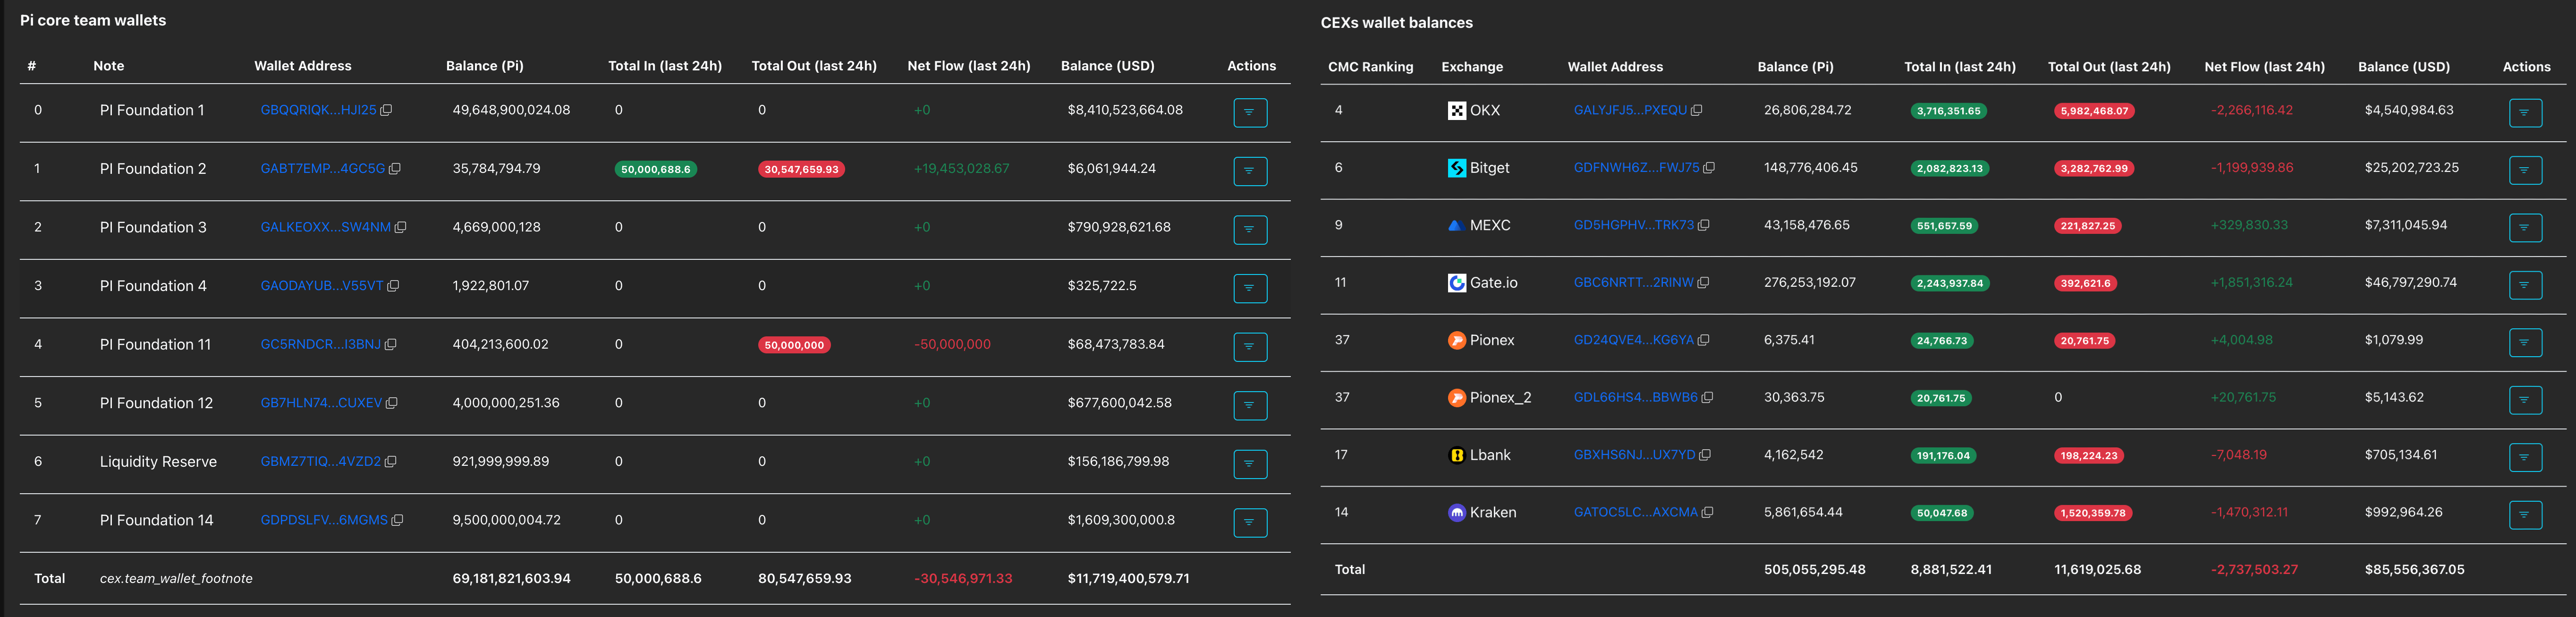
- PiScan data shows investors struggling to absorb supply as Pi Foundation offloads over 30 million PI tokens in 24 hours.
Pi Network (PI) is trading around $0.1700 at press time on Wednesday, reflecting a broader retracement within a falling channel pattern. The launch of smart contracts on the Pi Testnet under a subscription model marks functionality-focused expansion through consistent protocol upgrades.
Meanwhile, the over 30 million Pi tokens released by the Pi Foundation outweigh the roughly 2.75 million Pi tokens withdrawn from Centralized Exchanges (CEXs), suggesting increased supply pressure.
Pi Network focuses on added functionality
Pi Network announced the launch of its first smart contract capability on its testnet, made possible by its ongoing push for protocol upgrades. Pi Network is built on the Stellar blockchain, with the mainnet having completed its upgrade to version 22 and plans to reach version 26 by June.
Pi Core Team has released a second Pi Request for Comment (PiRC2) for a technical review and community feedback on the subscription-based smart contract functionality.
Smart contract capability on the mainnet, expected with the version 26 release, will add utility to the PI token and could boost investors' confidence.
Pi Token under pressure from Foundation wallet supply dump
Pi Network’s second migration phase, which enables Know Your Customer (KYC)-verified users to transfer PI tokens to CEXs from the testnet. The release of locked PI tokens from Pi Foundation serves as a consistent downside pressure on the spot price.
PiScan data shows the Pi Foundation wallets released 30.54 million tokens in the last 24 hours, while CEXs data shows 2.73 million PI tokens in outflows, suggesting an attempt to absorb the incoming supply pressure.
Pi Network under pressure risks further decline
Pi Network trails slightly below $0.1700 at press time on Wednesday and remains under clear downside pressure within a falling channel pattern on the daily chart. PI holds well below the 50-day, 100-day, and 200-day Exponential Moving Averages (EMAs), which collectively frame a capped bias.
The Moving Average Convergence Divergence (MACD) remains above the signal line but the positive declining histogram bars suggest a weakening bullish momentum. The Relative Strength Index (RSI) at 45 suggests subdued momentum, hinting that recent upside attempts lack strength.
On the downside, the April 13 low at $0.1633 serves as the immediate support level, close to the declining support trendline. A break below this level would expose fresh lows targeting the February 23 and 11 lows at $0.1556 and $0.1310, respectively.
On the topside, initial resistance emerges at the 50-day EMA at $0.1774, with the 100-day EMA at $0.1858 reinforcing a nearby ceiling ahead of the falling channel pattern.
(The technical analysis of this story was written with the help of an AI tool.)

Plus d’un million d’utilisateurs se tournent vers FXStreet pour des données de marché en temps réel, des outils de graphiques, des analyses d’experts et des actualités Forex. Leur calendrier économique complet et leurs webinaires éducatifs aident les traders à rester informés et à prendre des décisions éclairées. FXStreet s’appuie sur une équipe d’environ 60 professionnels répartis entre le siège de Barcelone et diverses régions du monde.
Lire la suite


