
Pi Network Price Forecast: PI recovers ahead of the New Year
Par Vishal Dixit
Date de publication: 31 Dec 2025 | Date de modification: 31 Dec 2025


ARTICLES POPULAIRES

Pi Network (PI) edges higher by almost 1% at press time on Wednesday, extending recovery after a Doji candle with 0.40% gains on the previous day. Data shows an increase in Pi Network’s social dominance, suggesting a boost in retail interest.
- Pi Network is up nearly 1%, extending a rebound from $0.20.
- A spike in social interest surrounding the Pi network reflects retail anticipation of a New Year rebound.
- The technical outlook for PI remains optimistic as it reverses from a key support.
Pi Network (PI) edges higher by almost 1% at press time on Wednesday, extending recovery after a Doji candle with 0.40% gains on the previous day. Data shows an increase in Pi Network’s social dominance, suggesting a boost in retail interest. The technical outlook for PI suggests a potential rebound from $0.20 amid a Morning Star pattern.
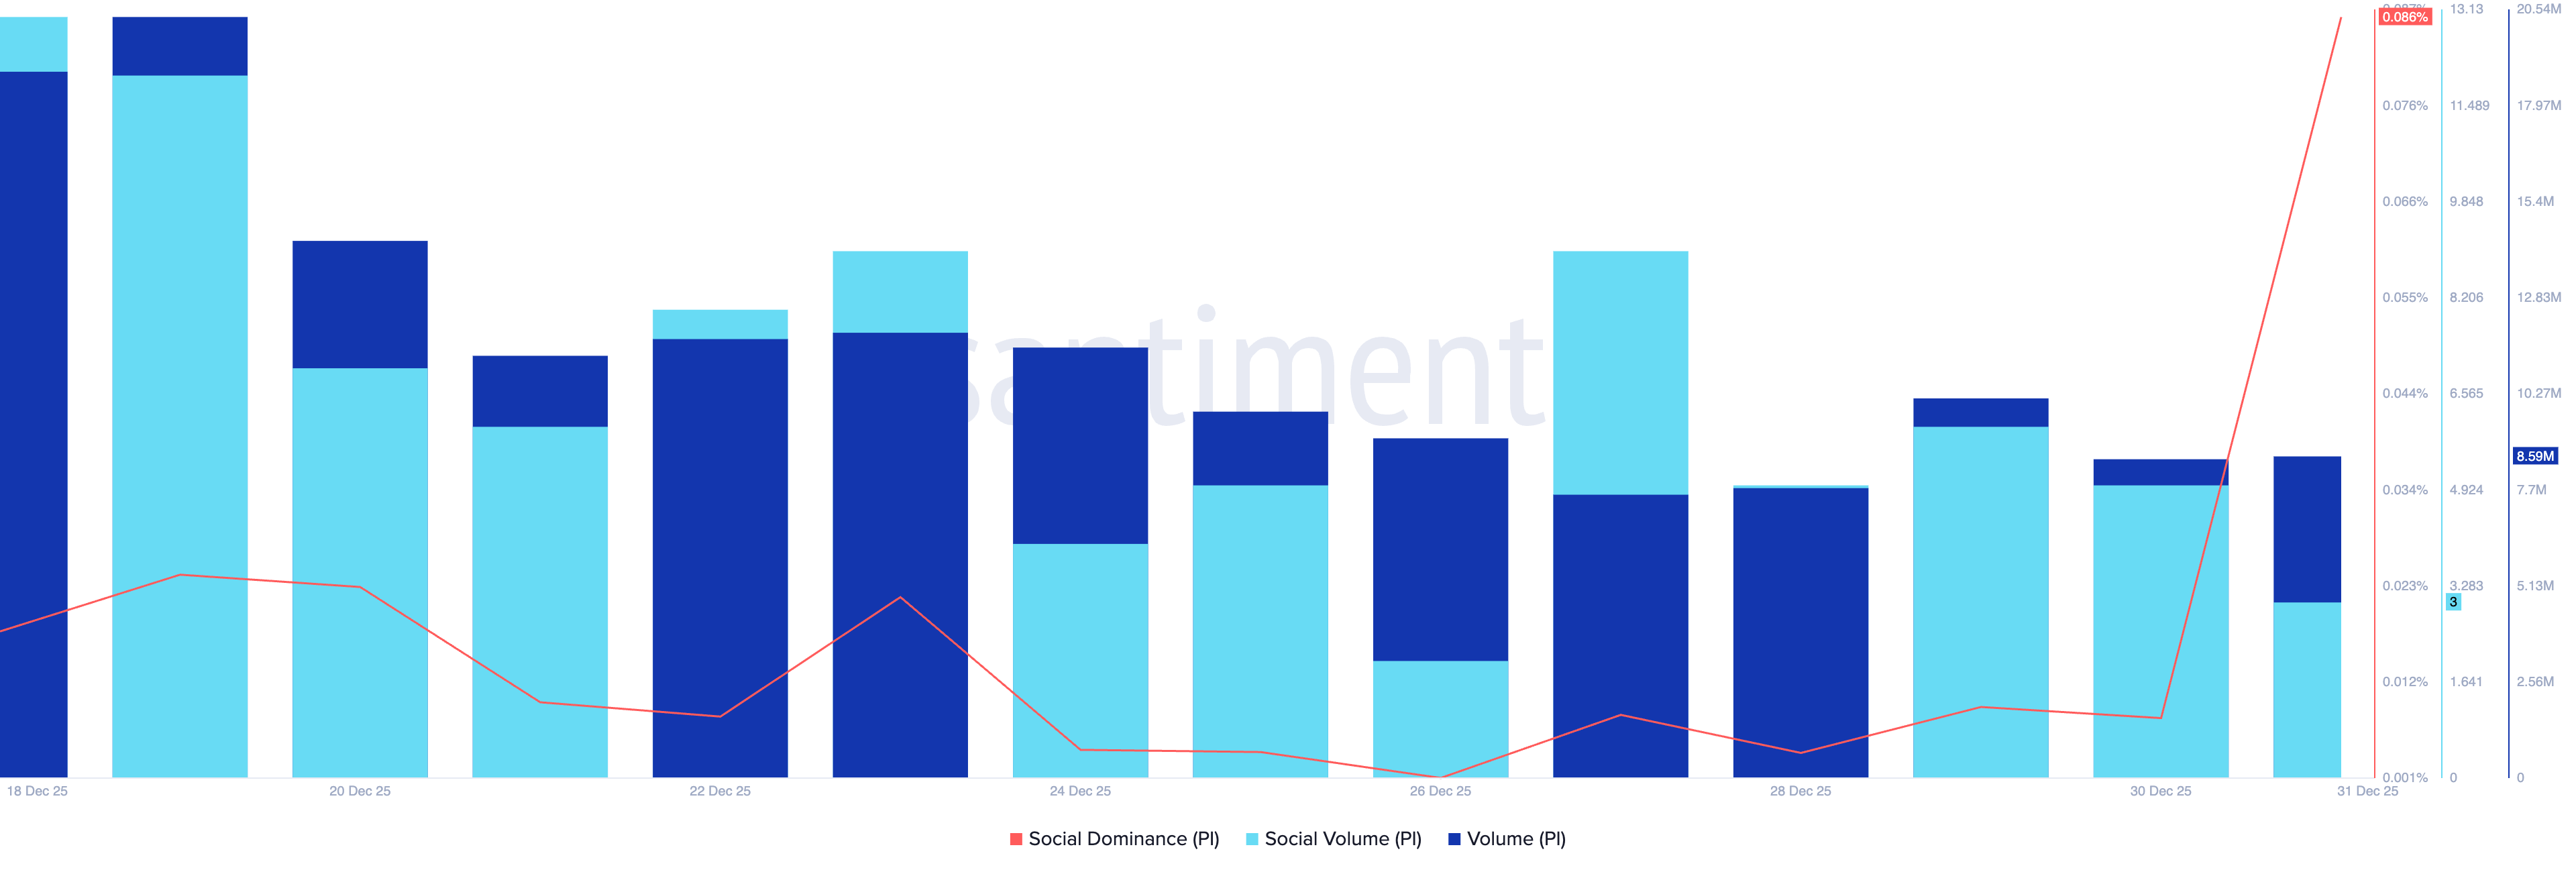
Social interest in Pi Network revives
Santiment data shows that Pi Network's social dominance – which tracks the share of discussion about PI in the crypto media – stands at 0.086%, up from 0.008% the previous day. This indicates a boost in social buzz surrounding PI, potentially anticipating a New Year rebound.
Meanwhile, the daily trading volume has held above 7 million PI in December but has declined to 8.58 million PI on Wednesday, from 38.65 million PI on December 1.
Technical outlook: Will PI rebound from $0.20?
Pi Network continues to trade above $0.20 despite multiple failed rebound efforts. At the time of writing, PI is up nearly 1% on Wednesday, which prepares a potential Morning Star pattern, combined with a Doji candle on the previous day and Monday’s 1.17% decline.
A successful completion of this pattern could boost the PI token price toward the 50-day Exponential Moving Average (EMA) at $0.2191.
The momentum indicators on the daily chart remain mixed, with Pi fluctuating above $0.20. The Relative Strength Index (RSI) is at 41, pointing toward the halfway line, indicating neutral to bearish pressure.
At the same time, the Moving Average Convergence Divergence (MACD) indicator shows a steady rise in the average lines accompanied by rising green histogram bars, indicating a gradual surge in bullish momentum.
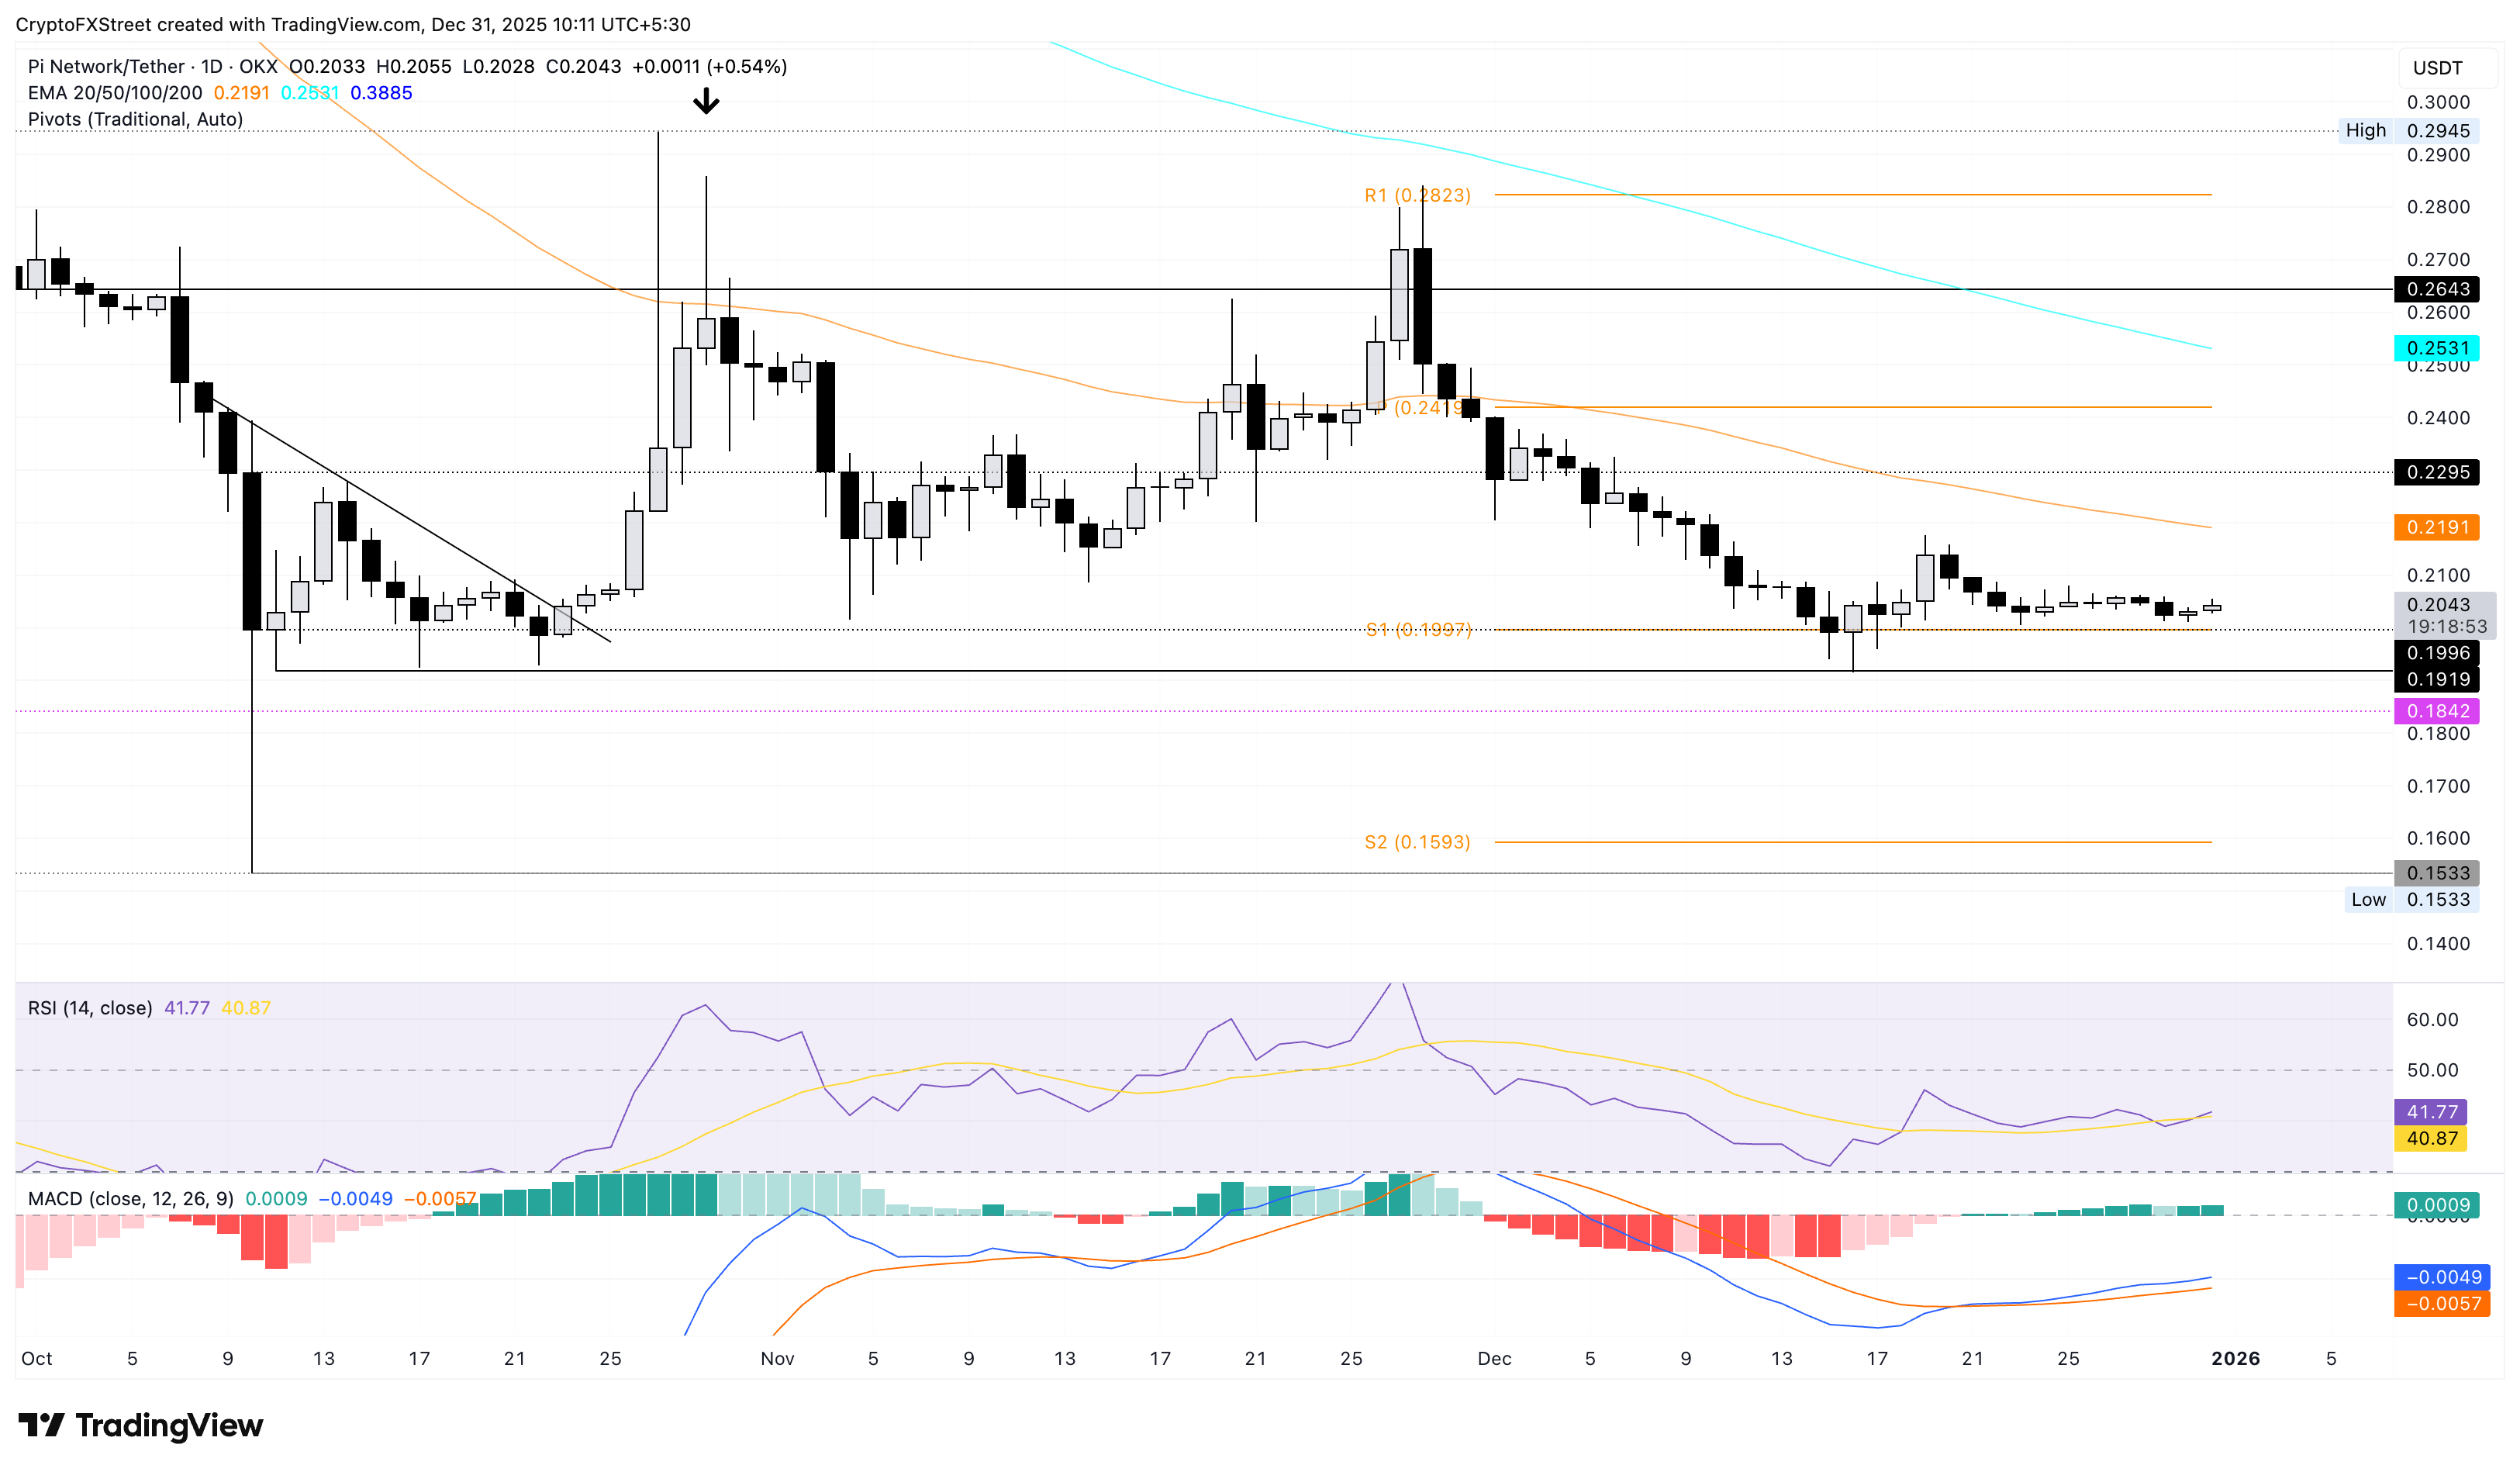
Looking down, if PI slips below the October 11 low of $0.1919, it could test the S2 Pivot Point at $0.1593.

Plus d’un million d’utilisateurs se tournent vers FXStreet pour des données de marché en temps réel, des outils de graphiques, des analyses d’experts et des actualités Forex. Leur calendrier économique complet et leurs webinaires éducatifs aident les traders à rester informés et à prendre des décisions éclairées. FXStreet s’appuie sur une équipe d’environ 60 professionnels répartis entre le siège de Barcelone et diverses régions du monde.
Lire la suite


