
Pi Network Price Forecast: PI recovers amid stabilizing social buzz
Par Vishal Dixit
Mis à jour: 16 Apr 2026


ARTICLES POPULAIRES

Pi Network (PI) extends gains by roughly 1.55% at press time on Thursday, crossing above the $0.1700 mark. The social buzz surrounding PI is stabilizing, while daily flows on Centralized Exchanges (CEXs) show renewed retail interest.
- Pi Network extends gains above $0.1700 so far on Thursday.
- Data shows social buzz surrounding Pi Network is stabilizing, hinting at steady retail interest.
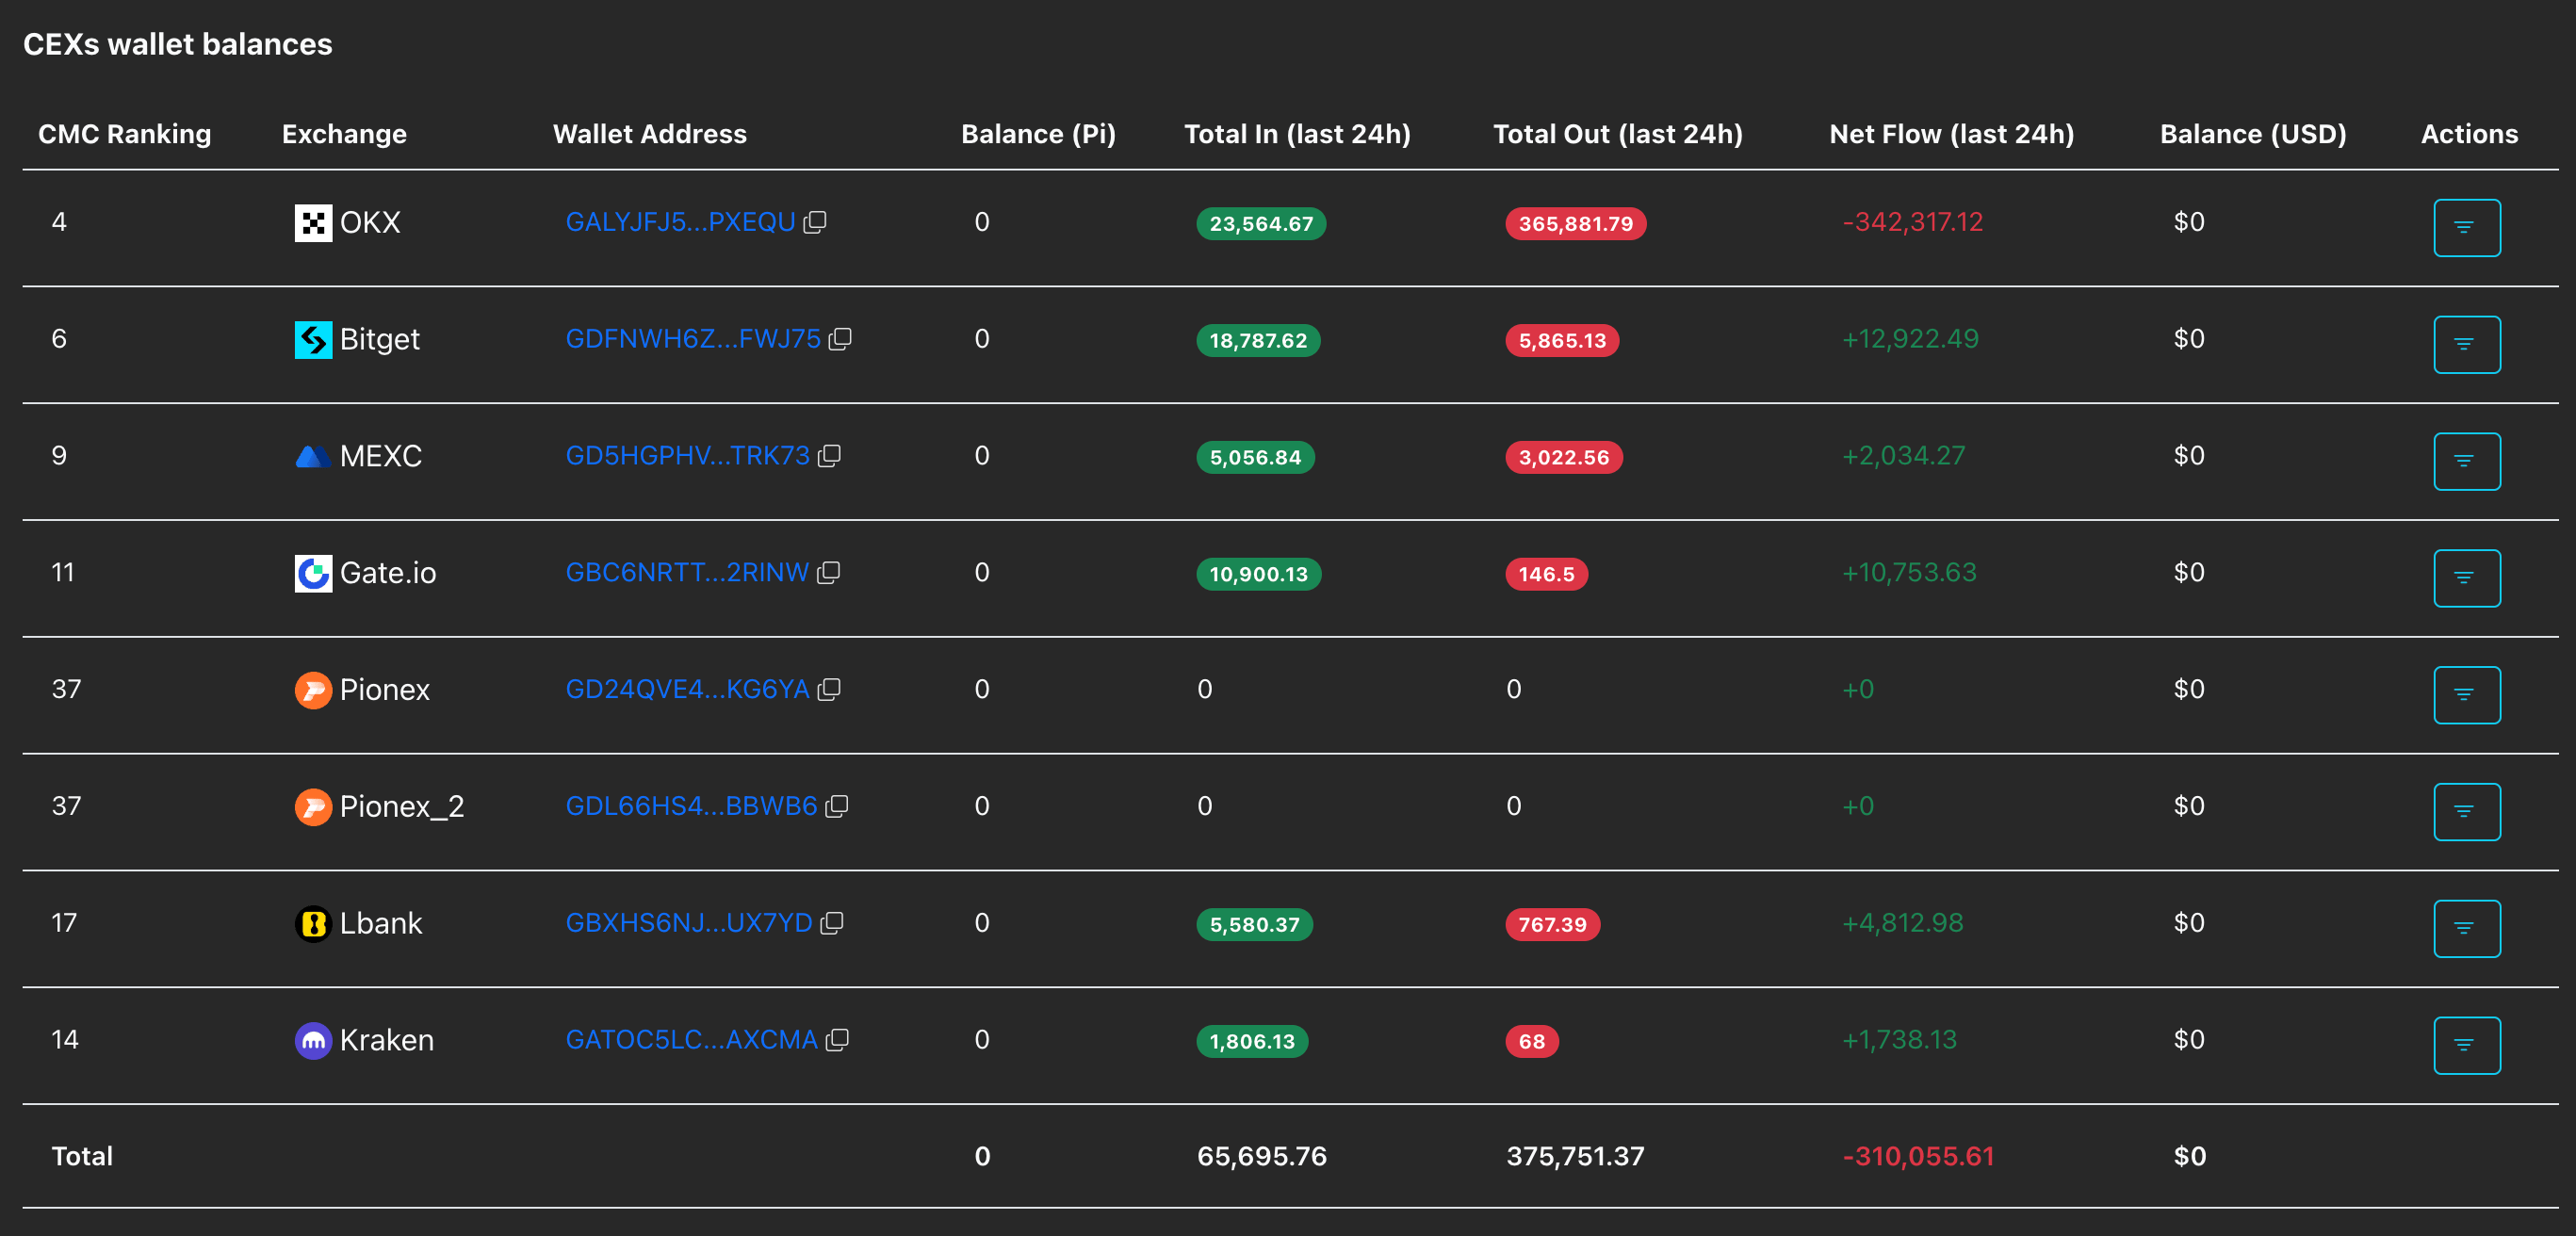
- CEXs recorded an outflow of over 300,000 PI tokens in the last 24 hours, pointing to reduced selling pressure.
Pi Network (PI) extends gains by roughly 1.55% at press time on Thursday, crossing above the $0.1700 mark. The social buzz surrounding PI is stabilizing, while daily flows on Centralized Exchanges (CEXs) show renewed retail interest.
Bearish pressure eases over Pi Network
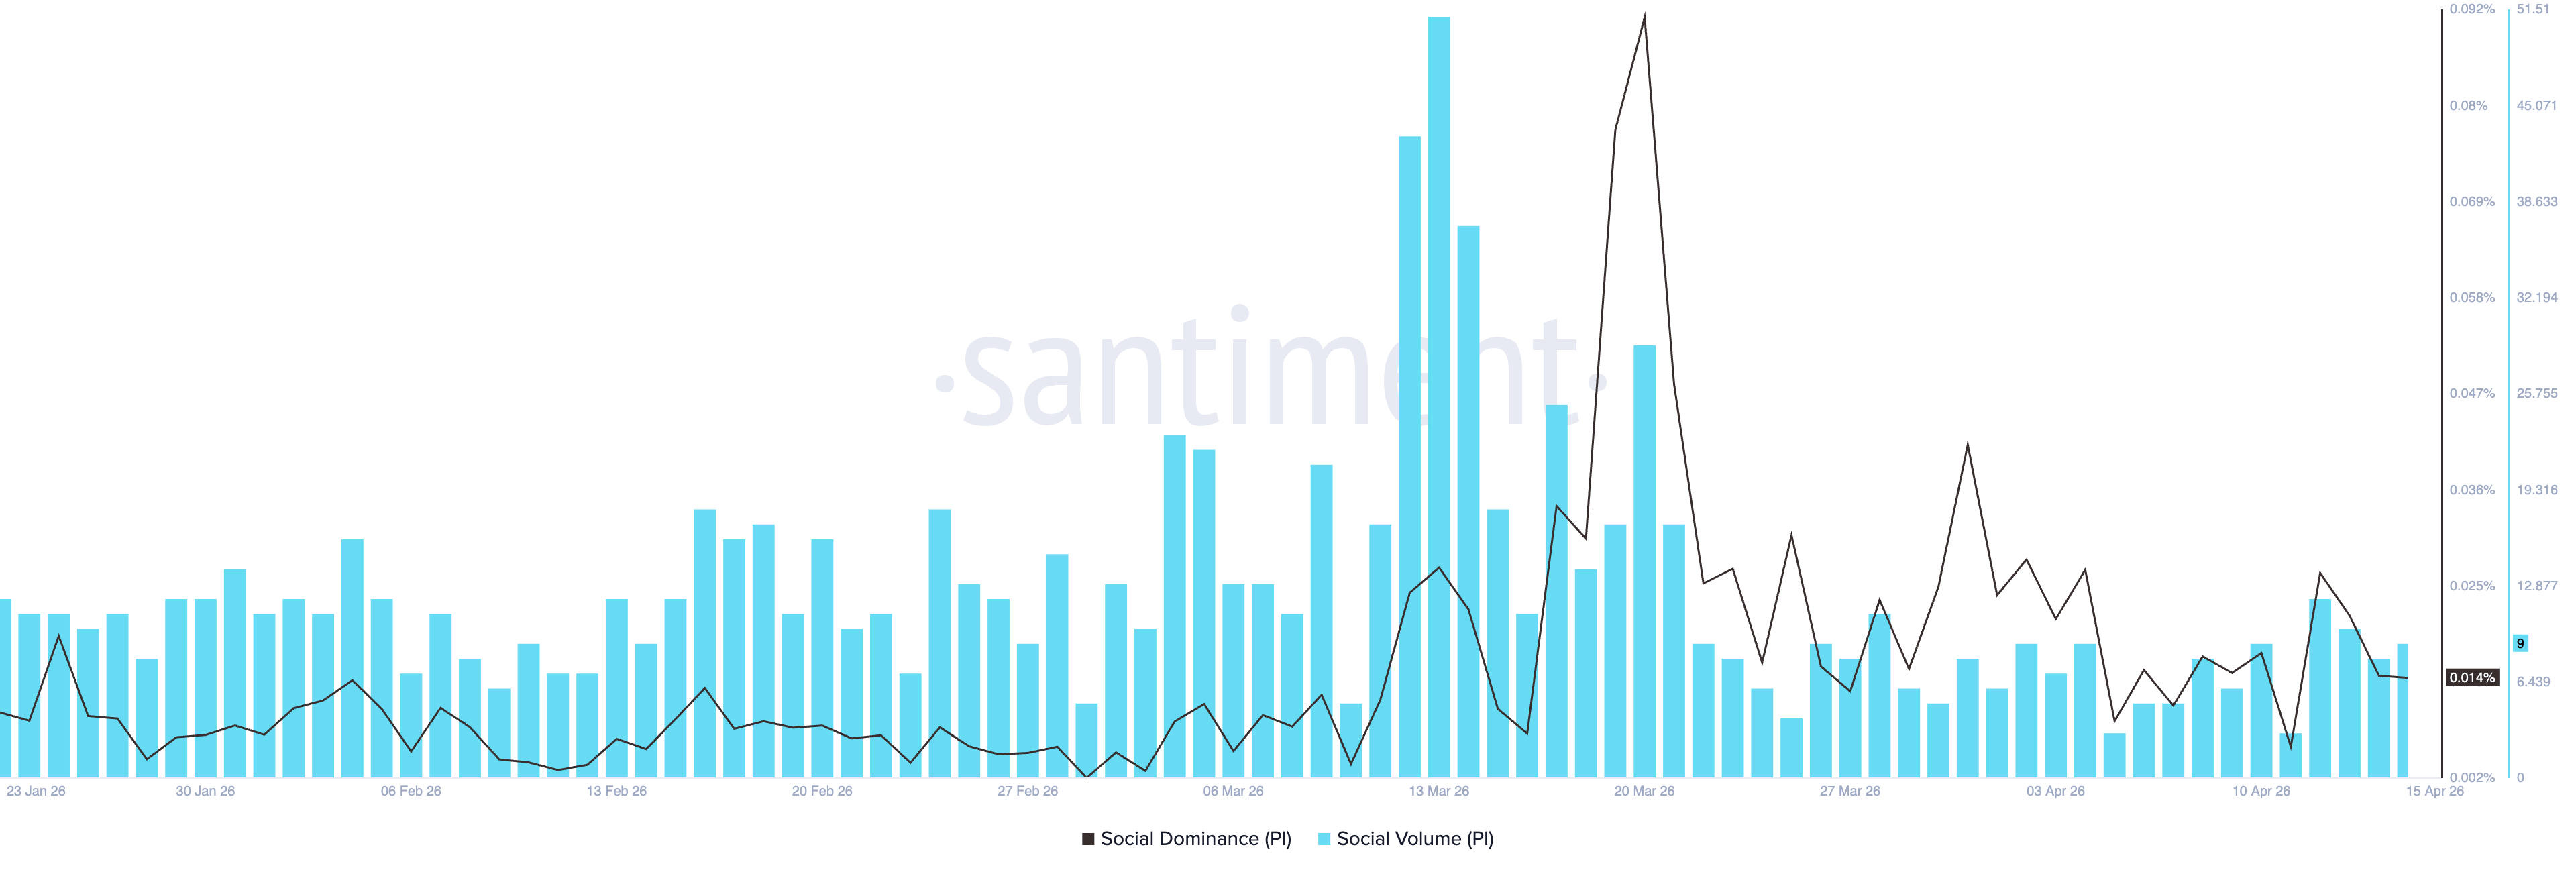
The risk-off sentiment surrounding Pi Network is gradually declining with a stabilizing retail mood as the broader market recovers. Santiment data shows the social volume and dominance hold steady at 9 and 0.014%, respectively, on Thursday, after weeks of sharp volatility.
Amid improving retail sentiment, PiScan data shows 310,055 PI tokens were withdrawn from CEXs over the last 24 hours, reflecting reduced selling pressure on the token.
Technical outlook: Will PI extend its recovery?
Pi Network shows a gradual recovery after days of consolidation below $0.1700. The PI token is in a broadly bearish configuration, as price remains below the 50-, 100-, and 200-day Exponential Moving Averages (EMAs) at $0.1786, $0.1881, and $0.2399, respectively.
The Moving Average Convergence Divergence (MACD) histogram bars have turned marginally positive after a bullish crossover on Wednesday. Meanwhile, the Relative Strength Index (RSI) at 44 shows an upside tick, suggesting easing bearish pressure.
On the topside, initial resistance lies at the February 25 high of $0.1730, followed by the 50-day EMA around $0.1786, where a daily close above would be needed to ease immediate downside pressure. The 100-day EMA at $0.1881 then comes into focus as the next hurdle.
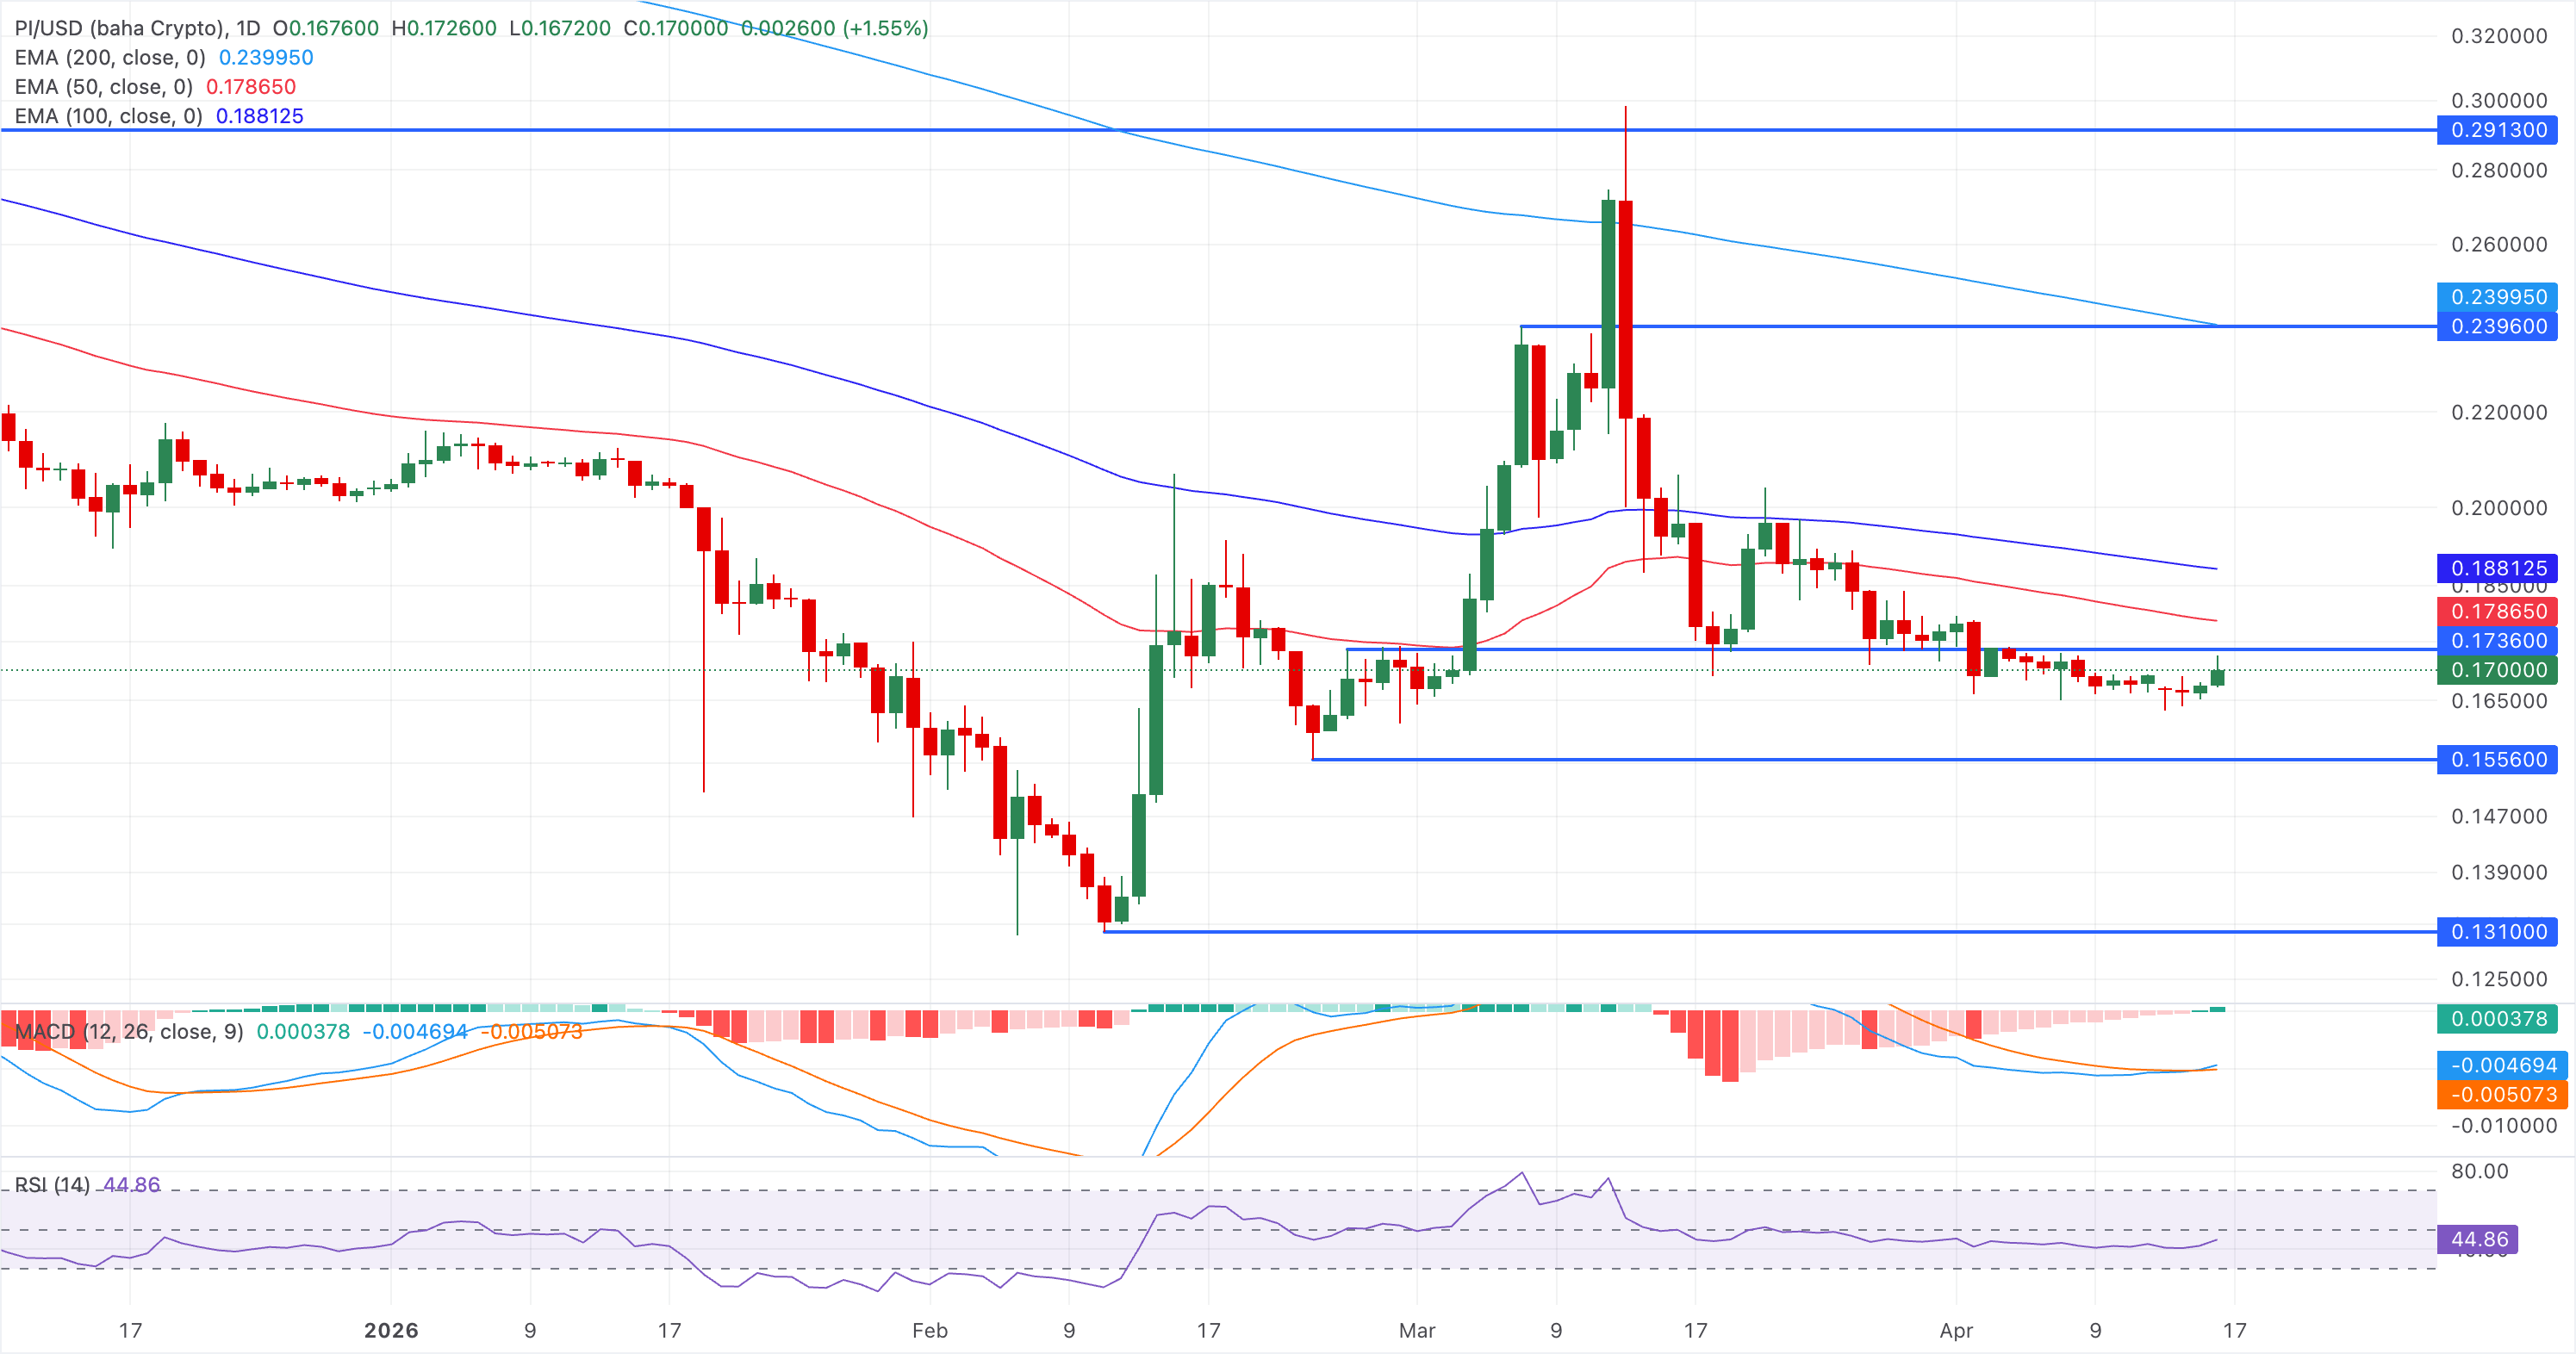
Looking down, the immediate support for PI remains at the February 23 low at $0.1556.
(The technical analysis of this story was written with the help of an AI tool.)

Plus d’un million d’utilisateurs se tournent vers FXStreet pour des données de marché en temps réel, des outils de graphiques, des analyses d’experts et des actualités Forex. Leur calendrier économique complet et leurs webinaires éducatifs aident les traders à rester informés et à prendre des décisions éclairées. FXStreet s’appuie sur une équipe d’environ 60 professionnels répartis entre le siège de Barcelone et diverses régions du monde.
Lire la suite


