
Pi Network Price Forecast: Renewed mainnet migration-driven CEX deposits weigh on PI
Par Vishal Dixit
Mis à jour: 14 May 2026


ARTICLES POPULAIRES

Pi Network (PI) is edging lower on Thursday, risking a steeper correction below $0.1700 and a bearish breakout to a short-term consolidation range.
- Pi Network extends losses on Thursday, risking a potential bearish breakdown of a short-term consolidation range.
- PiScan data shows renewed mainnet migration activity this week, resulting in fresh deposits on centralized exchanges.
- The technical outlook for PI is mildly bearish as the short-term support near $0.1687 could break under rising selling pressure.
Pi Network (PI) is edging lower on Thursday, risking a steeper correction below $0.1700 and a bearish breakout to a short-term consolidation range. The increase in selling pressure due to over 1 million deposits on Centralized Exchanges (CEXs) is likely driven by renewed mainnet migration activity, weighing down on the PI token.
CEXs deposits rise amid renewed mainnet migration activity
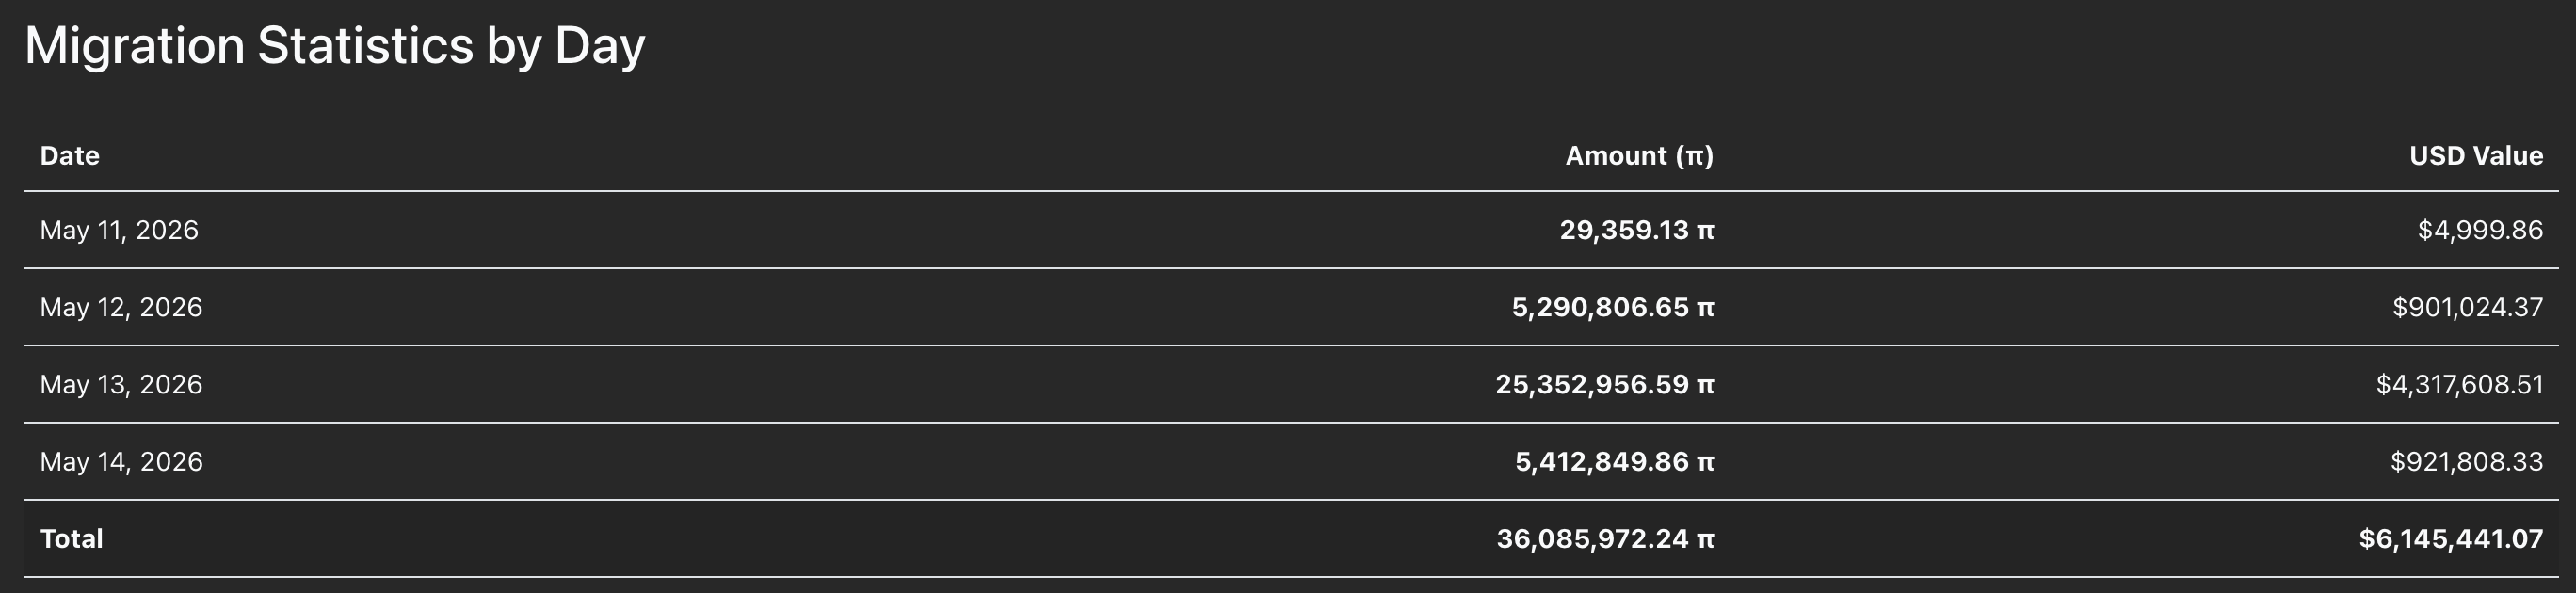
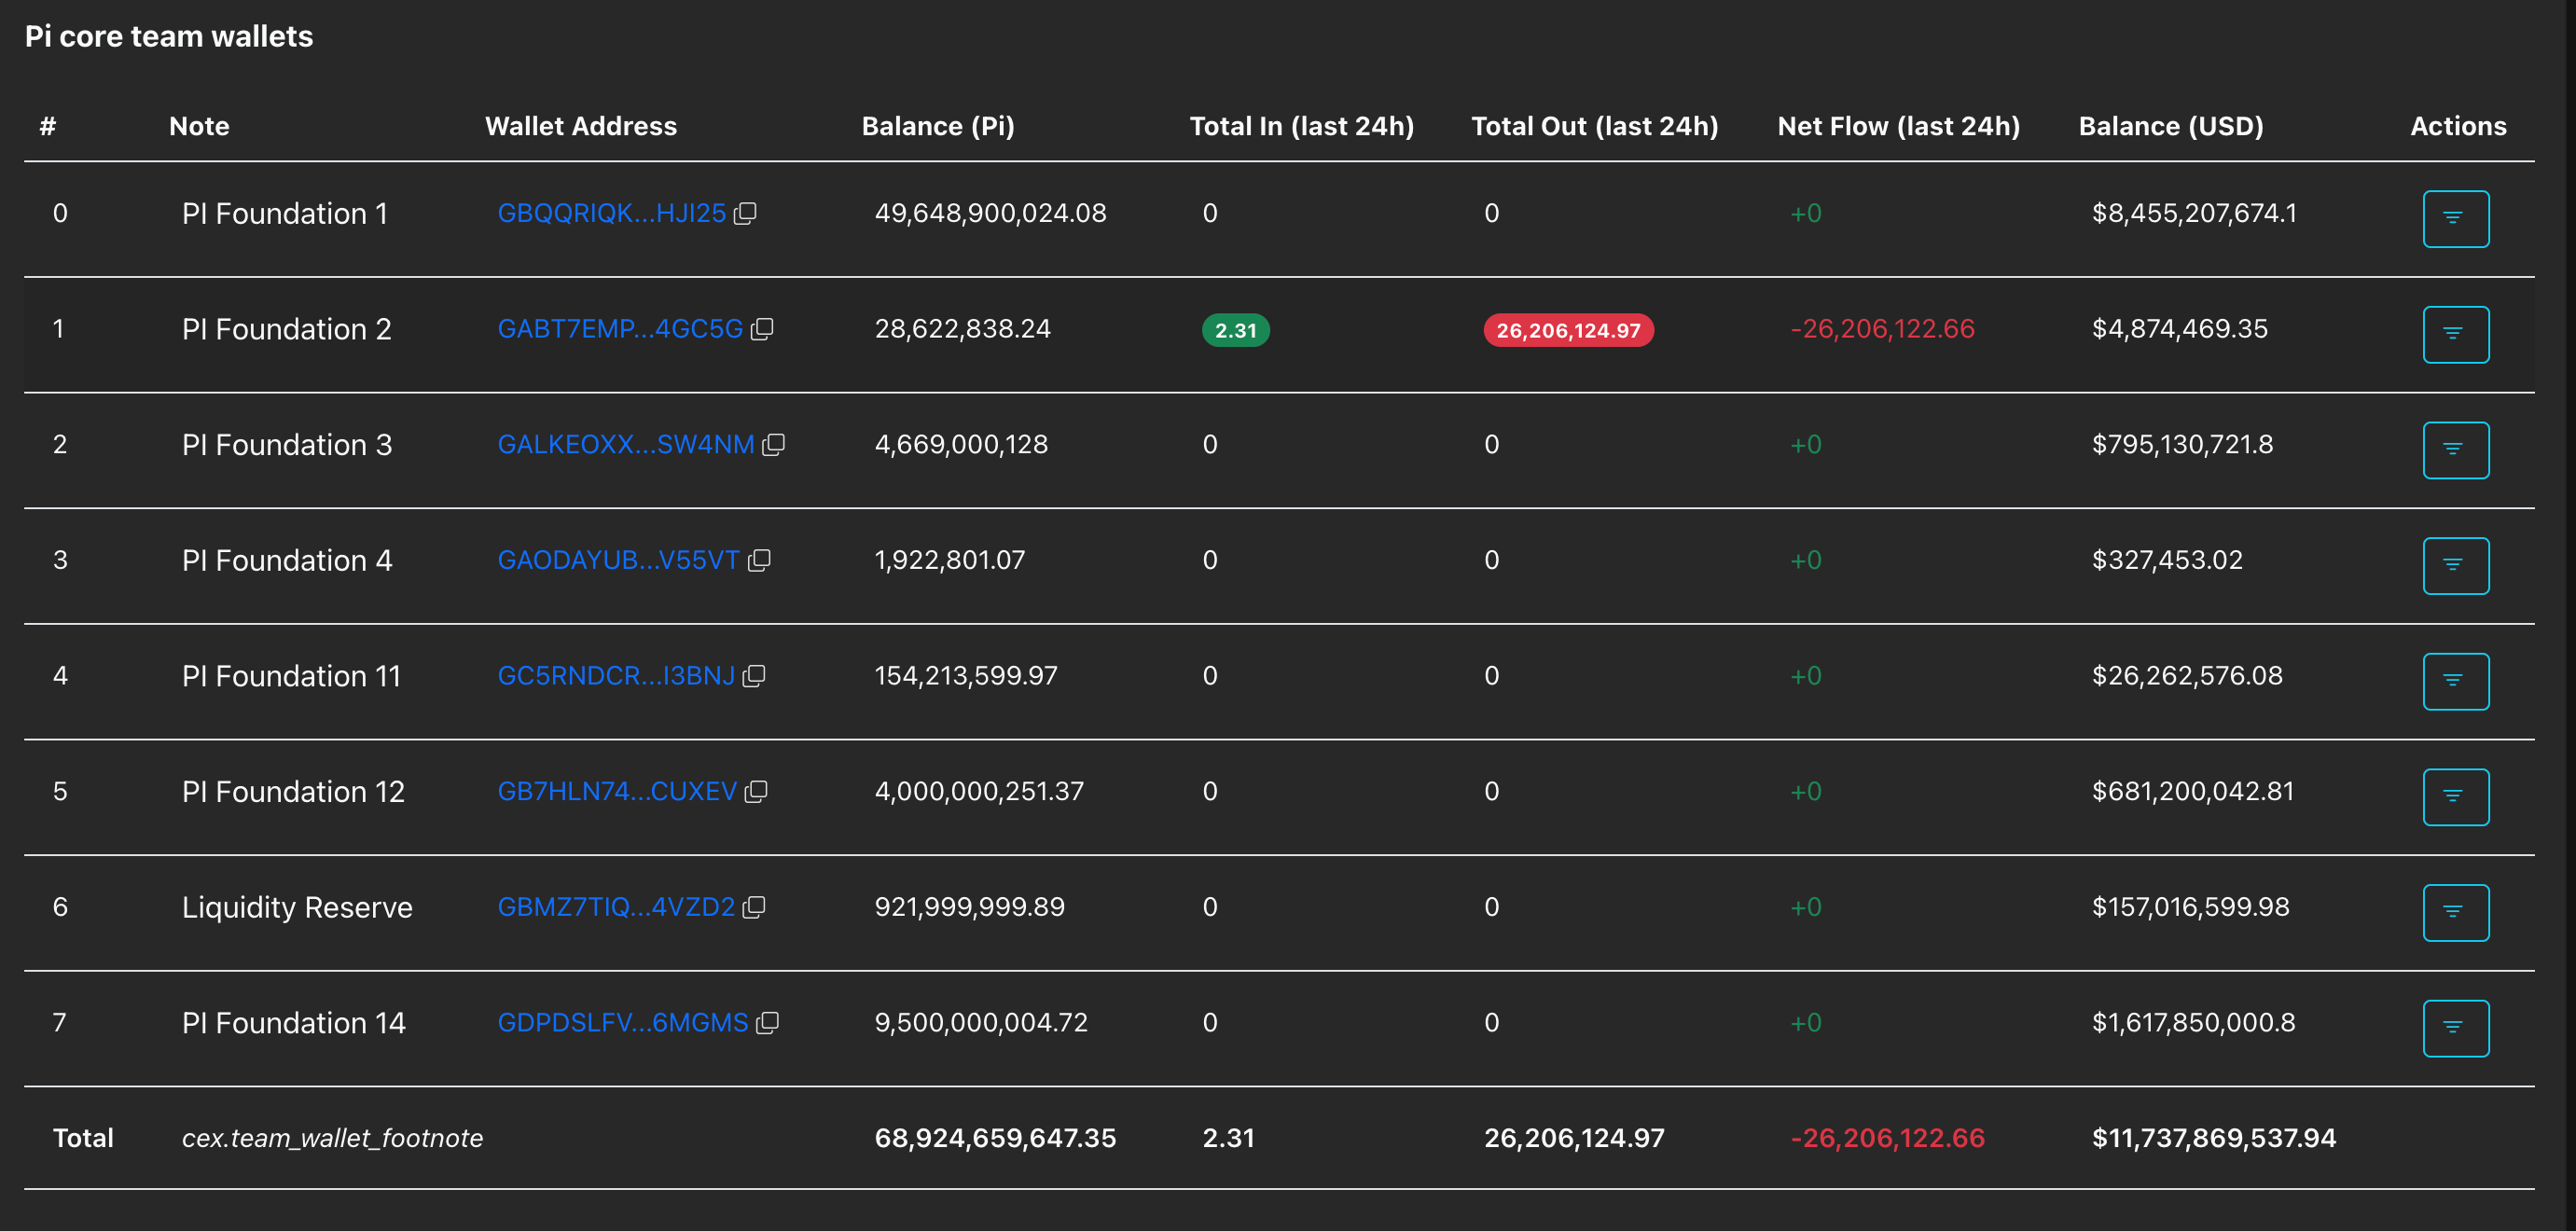
Pi Network is under renewed selling pressure as investors transfer their PI token holdings to mainnet-linked exchanges after their Know Your Customer (KYC) verification. PiScan data shows over 36 million PI tokens migrated to the mainnet in the last four days, roughly aligning with the 26.20 million PI tokens unlocked from Pi core team wallets.
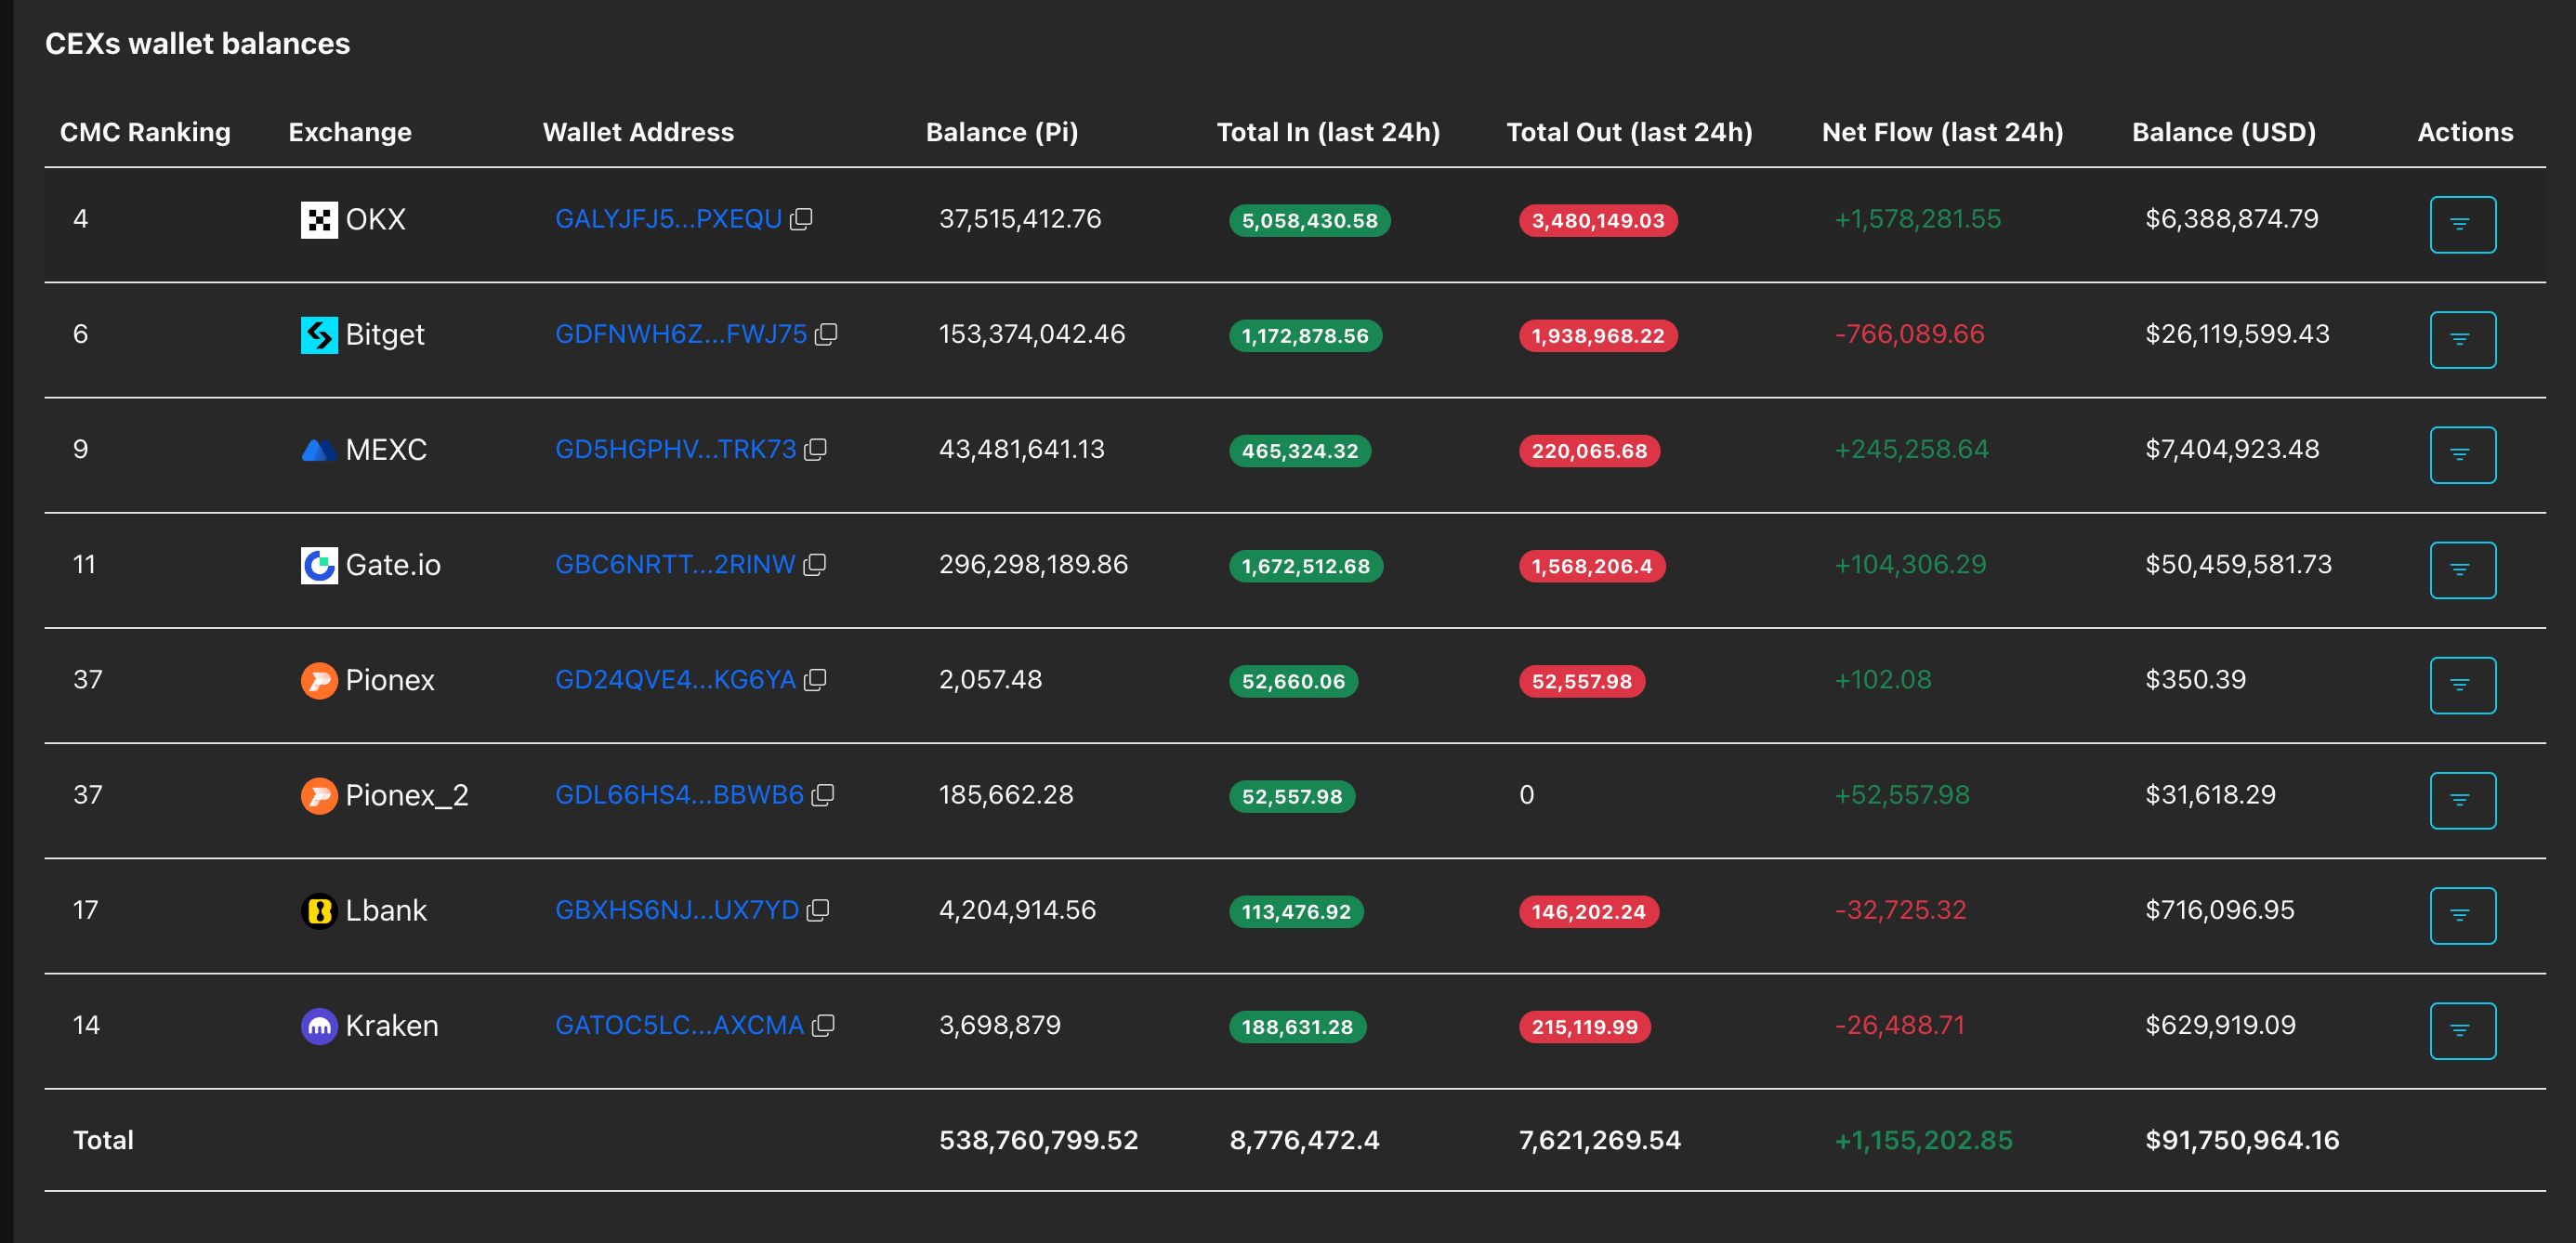
At the same time, the PI-supporting exchanges witnessed an inflow of 1.15 million tokens, suggesting that large deposits as investors presented with an exit option are reducing their exposure.
Technical outlook: Will PI extend losses below $0.1700?
Pi Network hovers around $0.1700 at press time on Thursday, keeping a bearish near-term tone. The Pi token remains well beneath the 50-period Exponential Moving Average (EMA) at $0.1739 on the 4-hour chart and the 100- and 200-period EMAs clustered between roughly $0.1750 and $0.1767, respectively.
PI approaches the May 12 low at $0.1687, acting as the base of a short-term consolidation, trapped within a larger descending wedge pattern on the same chart. Meanwhile, the Relative Strength Index (RSI) hovers near 40, slipping below the midline and the Moving Average Convergence Divergence (MACD) line and its signal line are marginally below zero, both hinting that downside momentum remains in control.
On the topside, initial resistance is seen at the 50-period EMA and overlapping downward trendline break area near $0.1739.
On the downside, immediate support is only loosely defined around the $0.1700 region, close to the May 12 low at $0.1687. A clear break could open the door to fresh lows on the 4-hour chart as the broader structure remains capped by the overhead moving averages and trendline resistances.
(The technical analysis of this story was written with the help of an AI tool.)

Plus d’un million d’utilisateurs se tournent vers FXStreet pour des données de marché en temps réel, des outils de graphiques, des analyses d’experts et des actualités Forex. Leur calendrier économique complet et leurs webinaires éducatifs aident les traders à rester informés et à prendre des décisions éclairées. FXStreet s’appuie sur une équipe d’environ 60 professionnels répartis entre le siège de Barcelone et diverses régions du monde.
Lire la suite


