

Ripple Price Forecast: XRP extends decline as spooked institutions outweigh whale demand
- Ripple extends losses on Friday, risking further decline below $1.30.
- On-chain data shows steady whale demand after a sharp increase in holdings on Wednesday.
- US spot XRP ETFs record $64,610 in inflows on Thursday, while the broader trend suggests reduced institutional interest.
Ripple (XRP) is trading close to $1.30 at press time on Friday, extending the 2% loss from Thursday. On-chain data shows a steady increase in XRP holdings of large wallet holders, commonly called whales, while the XRP-focused Exchange-Traded Funds (ETFs) recorded their first inflow of $64,610 in April on Thursday after $31.16 million in outflow in March.

The technical outlook for XRP is bearish as momentum indicators indicate strengthening selling pressure.
XRP derivatives signal renewed risk appetite
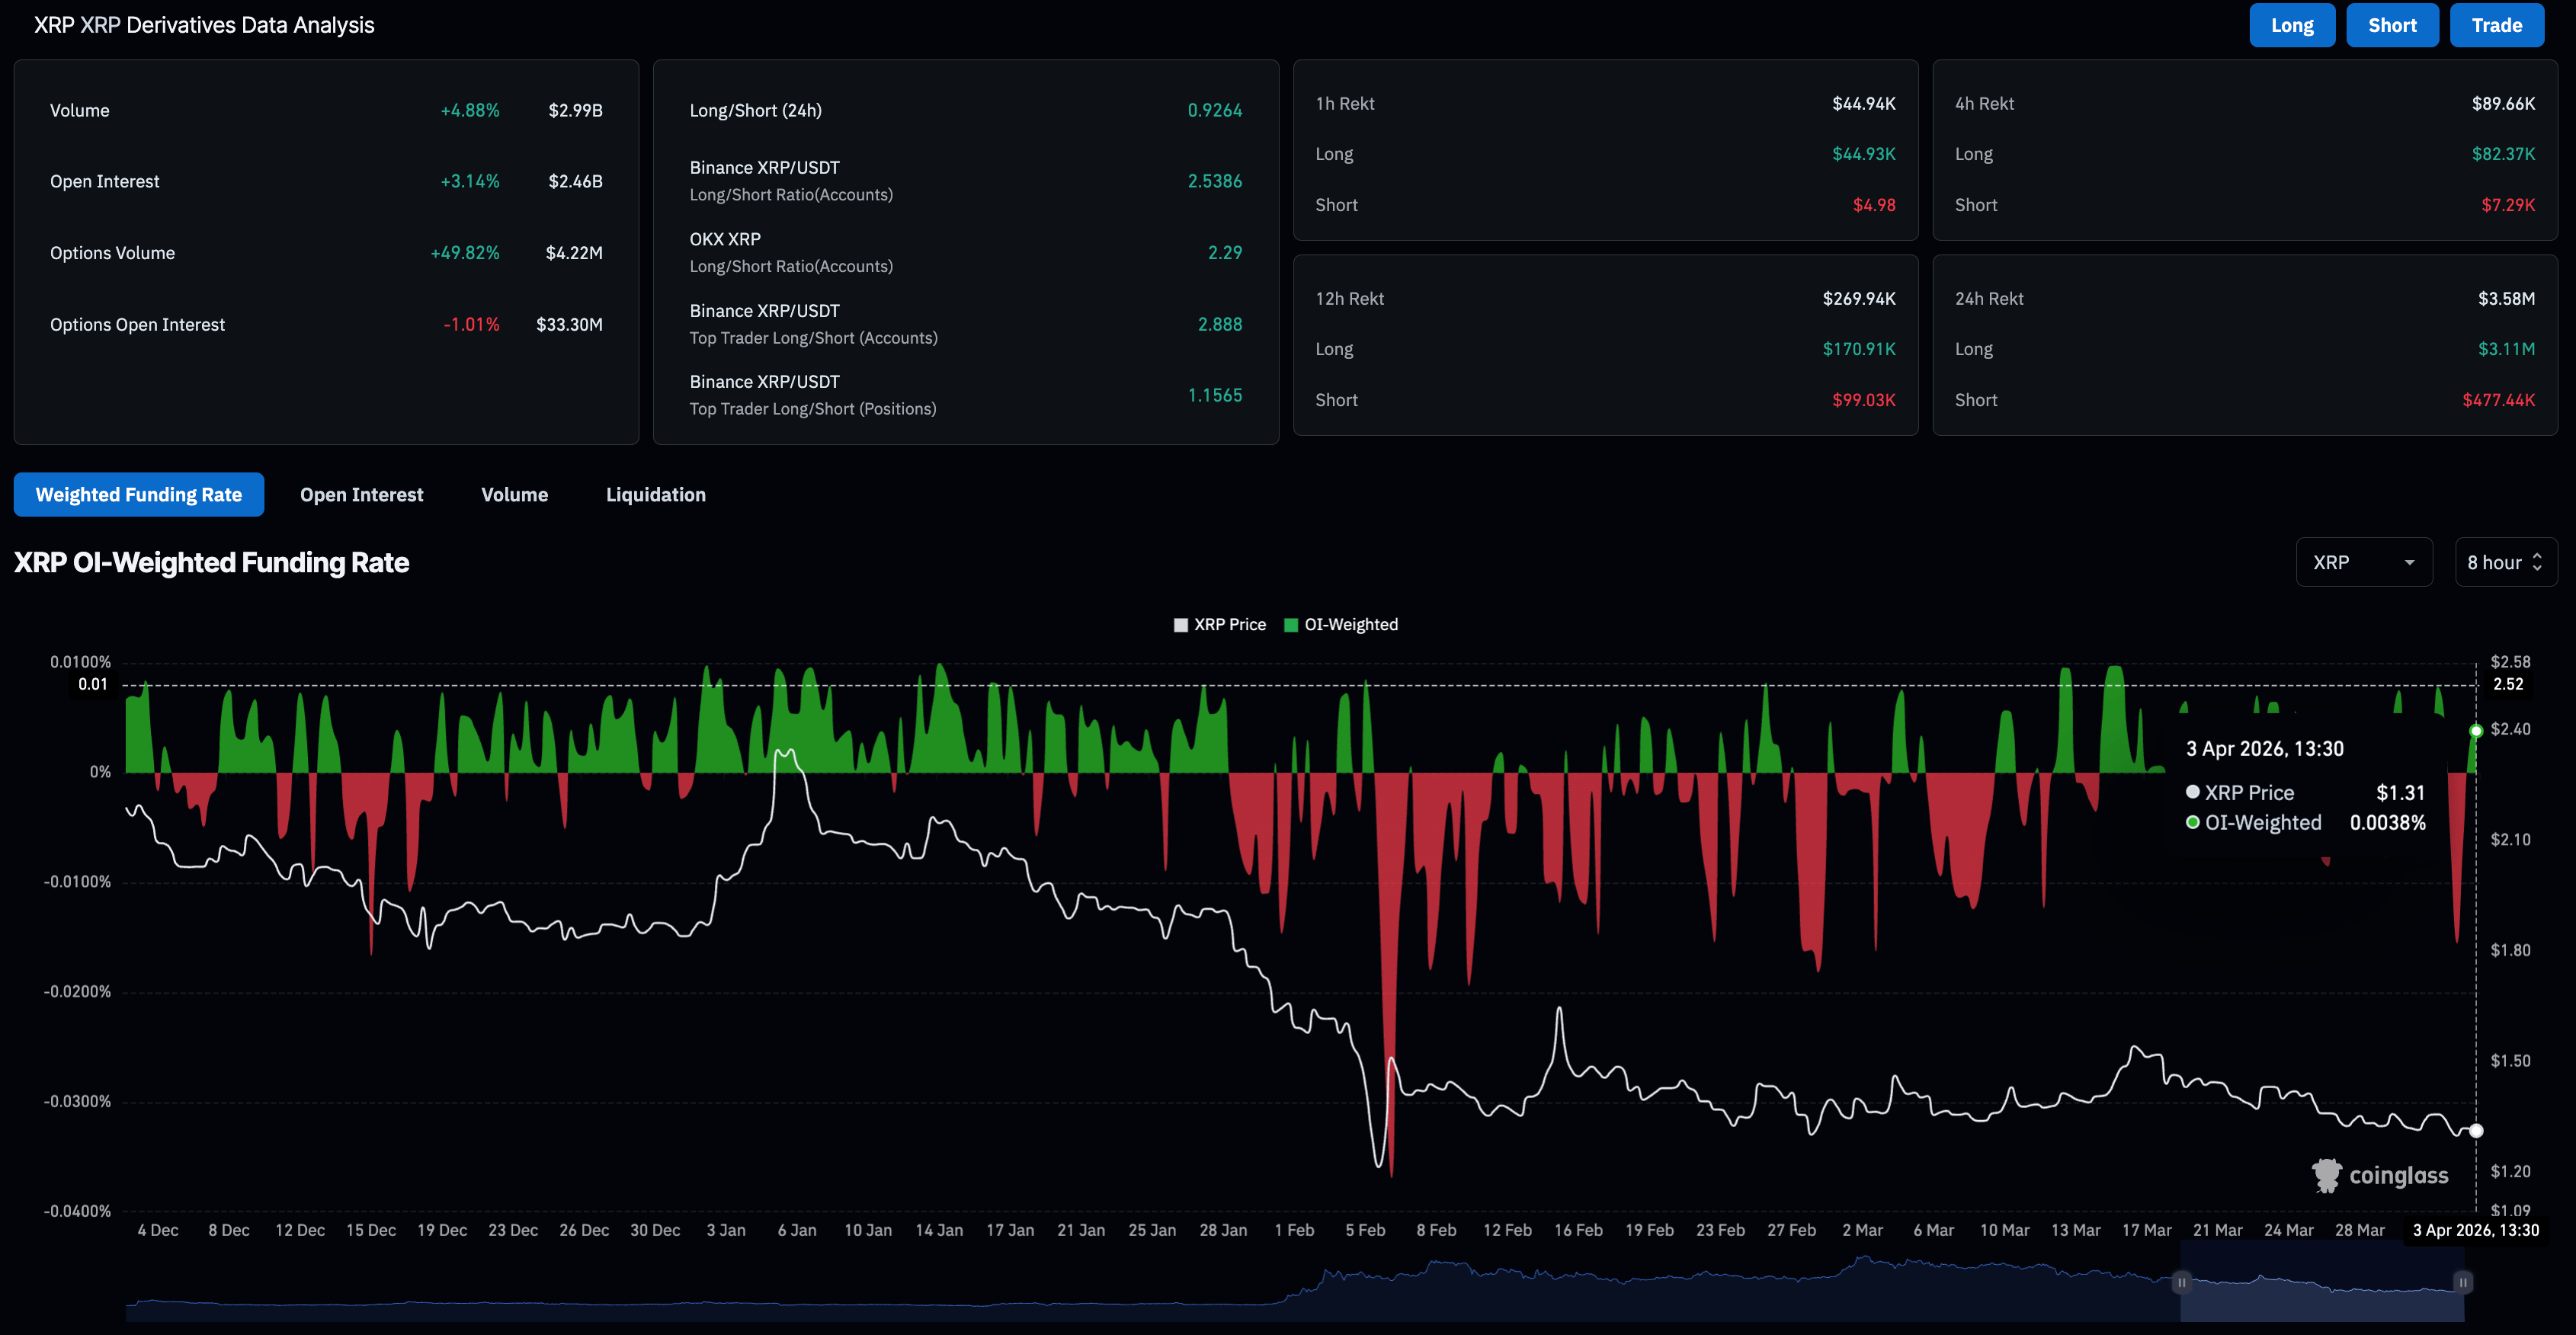
XRP derivatives data shows increased trading activity amid a broader bearish bias. Liquidations over the last 24 hours totaled $3.58 million, led by $3.11 million of long liquidations. That dropped the long-to-short ratio to 0.9264, which reflects a larger number of active short positions.
However, despite the bearish sentiment, XRP futures Open Interest (OI) is at $2.46 billion, up 3% over the same period, indicating a surge in positional buildup and risk appetite among traders. Additionally, the OI-weighted funding rate has flipped positive to 0.0038%, reaffirming traders' risk appetite to hold positions at a premium.
XRP whales continue to buy while institutions remain on the back foot
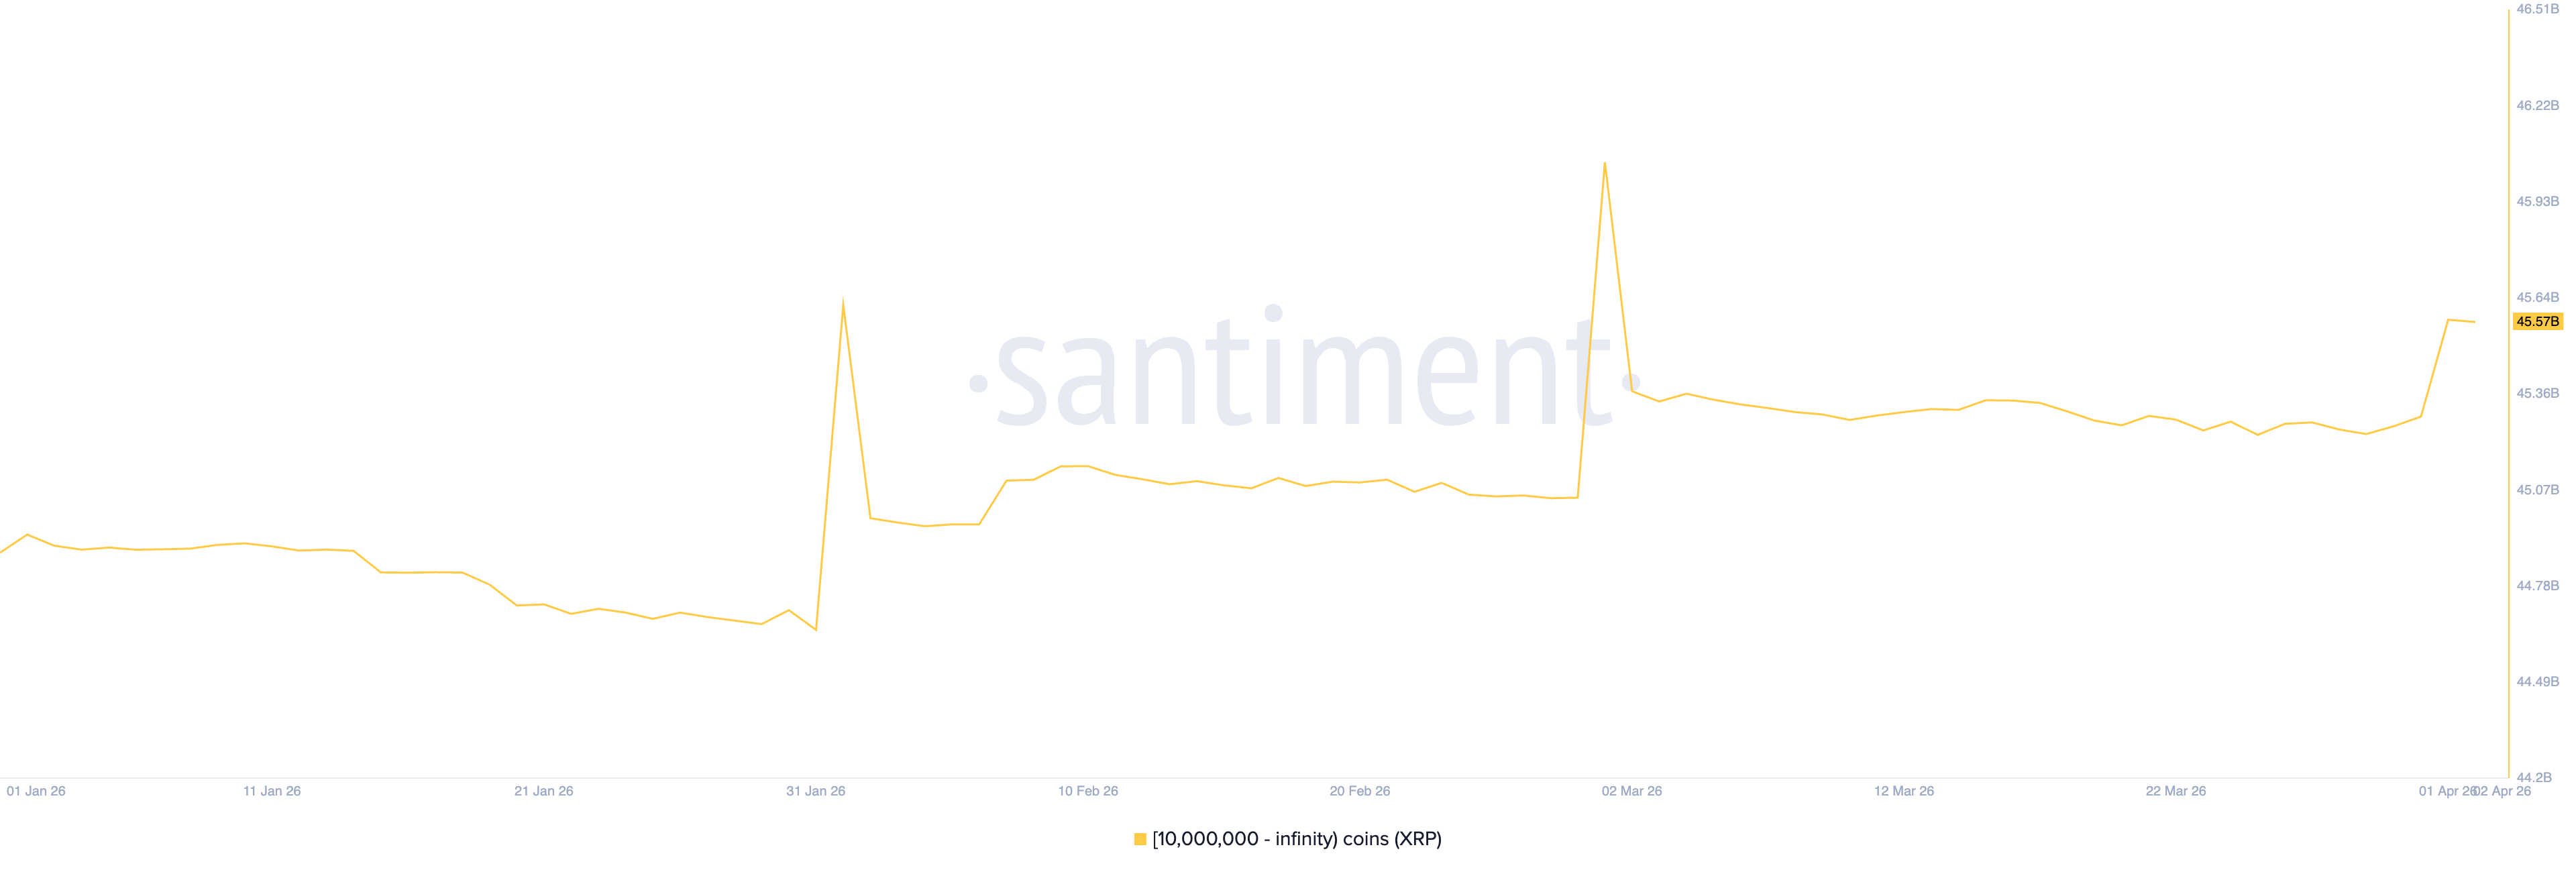
On-chain data shows large wallet holders maintain a steady buy-the-dip strategy. According to Santiment, wallets holding more than 10,000 XRP now hold 45.57 billion tokens, up from 45.29 billion on Tuesday.
Meanwhile, the XRP ETFs recorded an inflow of $64,610 on Thursday, after a $1.32 million outflow on Wednesday. This marks the first inflow since March 26, while the monthly outflow from March totaled $31.16 million.
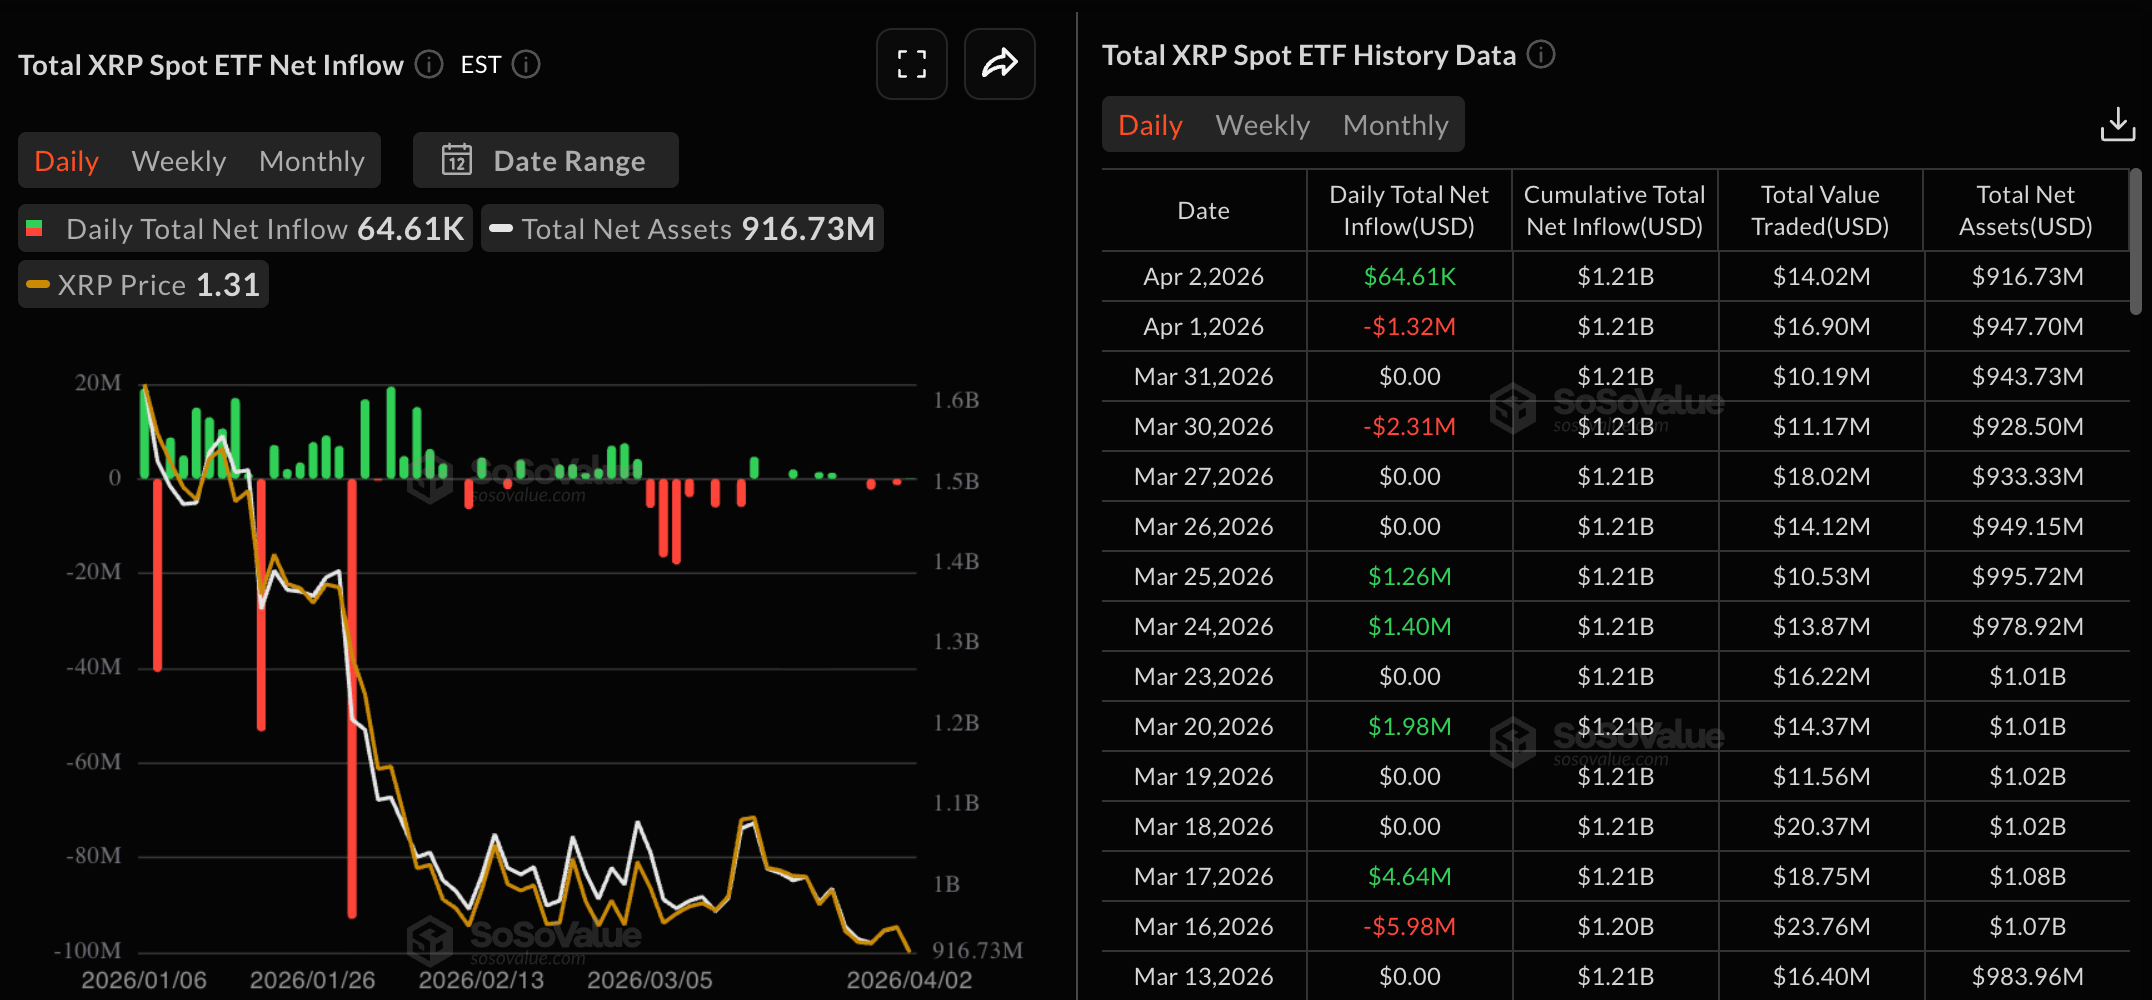
Taken together, despite the consistent whale demand, XRP extended its decline in March, aligning with the ETFs' outflow, implying that ETF flows outweigh whale demand in the near-term.
Technical outlook: Will XRP drop below $1.30?
XRP trades above $1.30 at press time on Friday. The near-term bias is mildly bearish as XRP extends its sequence of lower closes beneath the downward-sloping 50, 100, and 200-day Exponential Moving Averages (EMAs), which cap the upside and signal a dominant broader downtrend.
The Moving Average Convergence Divergence (MACD) remains below the signal line on the daily chart, with a modestly negative histogram, suggesting persistent selling pressure rather than a momentum washout. Meanwhile, the Relative Strength Index (RSI) holds at 38, reinforcing a bearish tone without yet entering oversold conditions.
On the downside, a daily close below $1.30 would expose the February 6 low at $1.11.
Initial resistance aligns near the 23.60% Fibonacci retracement at $1.42, measured from the $2.41 high to the $1.11 low, with the descending 50-day EMA at $1.43.
(The technical analysis of this story was written with the help of an AI tool.)














