

Ripple Price Forecast: XRP slips as liquidity improves, ETF inflows return
- XRP moderates below $1.40 after Monday’s short-lived uptrend near $1.50.
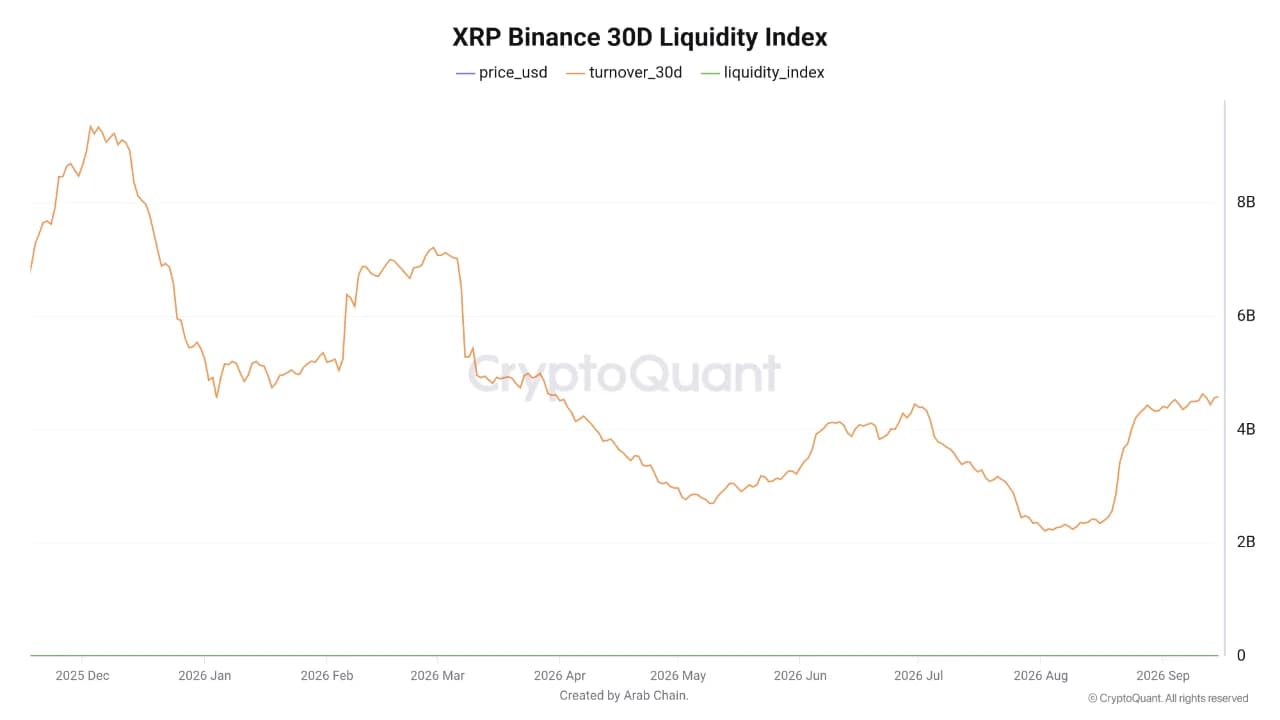
- XRP Binance Liquidity Index rises to the highest level in six months, signaling a liquidity comeback as activity soars.
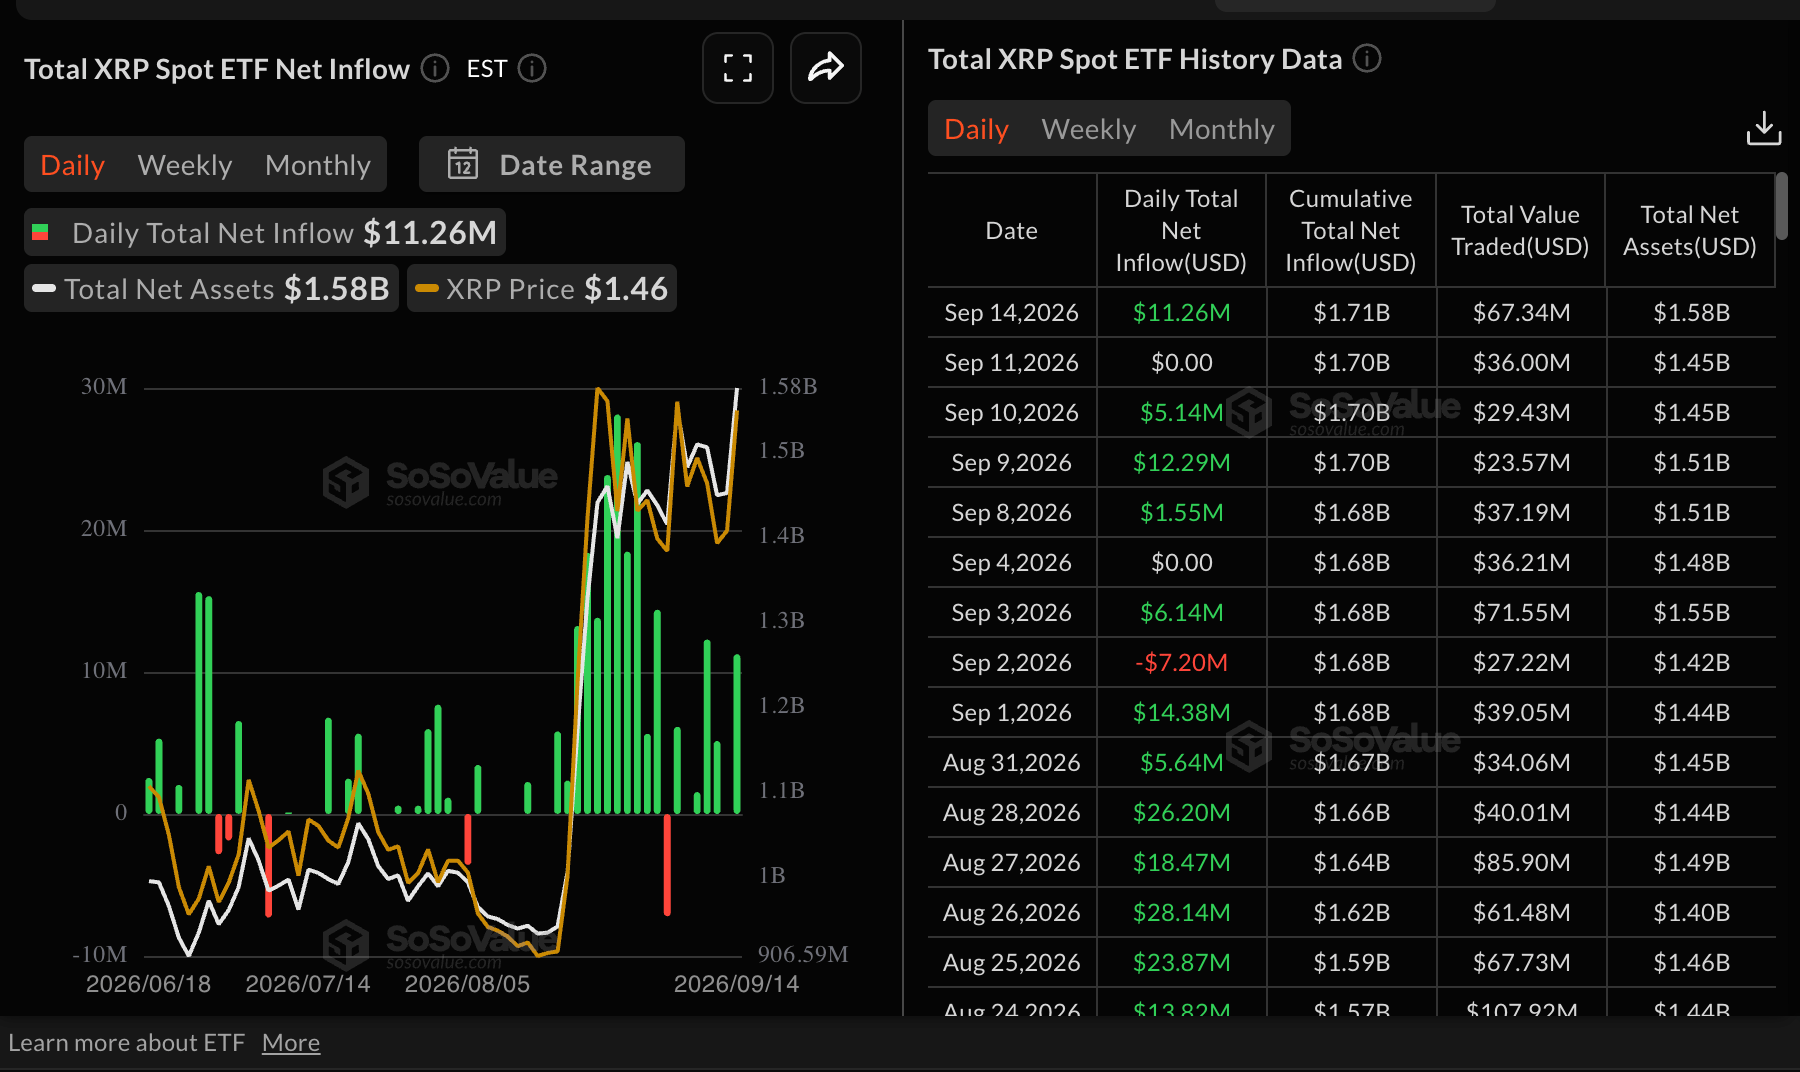
- US-listed spot ETFs recorded roughly $12 million in inflows on Monday, pushing assets under management up to $1.58 billion.
Ripple (XRP) is losing strength, trading below $1.40 on Tuesday. Although minor, the correction comes after a sharp move toward $1.50 the previous day and aligns with a lethargic outlook in the broader crypto market.

Market participants have shifted their attention to the upcoming Senate vote on the crypto CLARITY Act later on Tuesday, which is broadly expected to fail despite United States (US) President Donald Trump agreeing to new ethics rules.
Looking ahead, the Federal Reserve (Fed) is widely expected to raise interest rates on Wednesday, adopting a stricter monetary policy amid persistent inflation that defiantly sits above the central bank’s 2% target.
A sustained recovery above $1.40 would help to stabilize XRP’s bullish outlook, increasing the odds of a short-term breakout. However, trading below the same level could keep XRP range-bound, with demand at $1.30 cushioning against extended losses.
XRP exchange liquidity spikes as ETF inflows return
XRP Binance Liquidity Index has risen to the highest level over the last six months, suggesting a return of user activity and liquidity after a period of persistent decline, falling to the $2-$3 billion range in July and August.
The 30-day liquidity turnover has increased to approximately $4.6 billion, while the liquidity index climbed to 0.0675, according to CryptoQuant. Exchange flows on Binance have also increased, reinforcing growing user engagement.
That said, a higher liquidity index and turnover are not a direct indicator of XRP’s bullish outlook. It reflects market activity and trading liquidity, which can occur in either direction of price movement.
“Higher liquidity may provide a more favorable environment for executing trades, with a lower likelihood of large orders having a significant impact on price compared with periods of lower liquidity,” Arab Chain wrote in CryptoQuant’s Insight section.
US-listed XRP spot ETFs looked roughly $12 million in inflows on Monday following a hiatus on Friday, according to SoSoValue. This institutional comeback reinforces risk-on sentiment despite an expected Fed interest rate hike and the US Senate vote on the CLARITY Act, bringing cumulative inflows to $1.71 billion. In comparison, net assets under management edged higher to $1.58 billion.
Technical analysis: XRP hovers under pivotal hurdle
XRP trades below $1.40 after a brief run near $1.50. The pair now holds below $1.40, extending its correction in tandem with the broader cryptocurrency market. Despite this pullback, XRP sits above key Exponential moving averages (EMAs), maintaining a supported medium-term structure.
At the same time, the Relative Strength Index (RSI) near 55 suggests moderating bullish momentum, while the Moving Average Convergence Divergence (MACD) stays in negative territory, hinting that upside attempts could continue to face supply near the longer-term average.
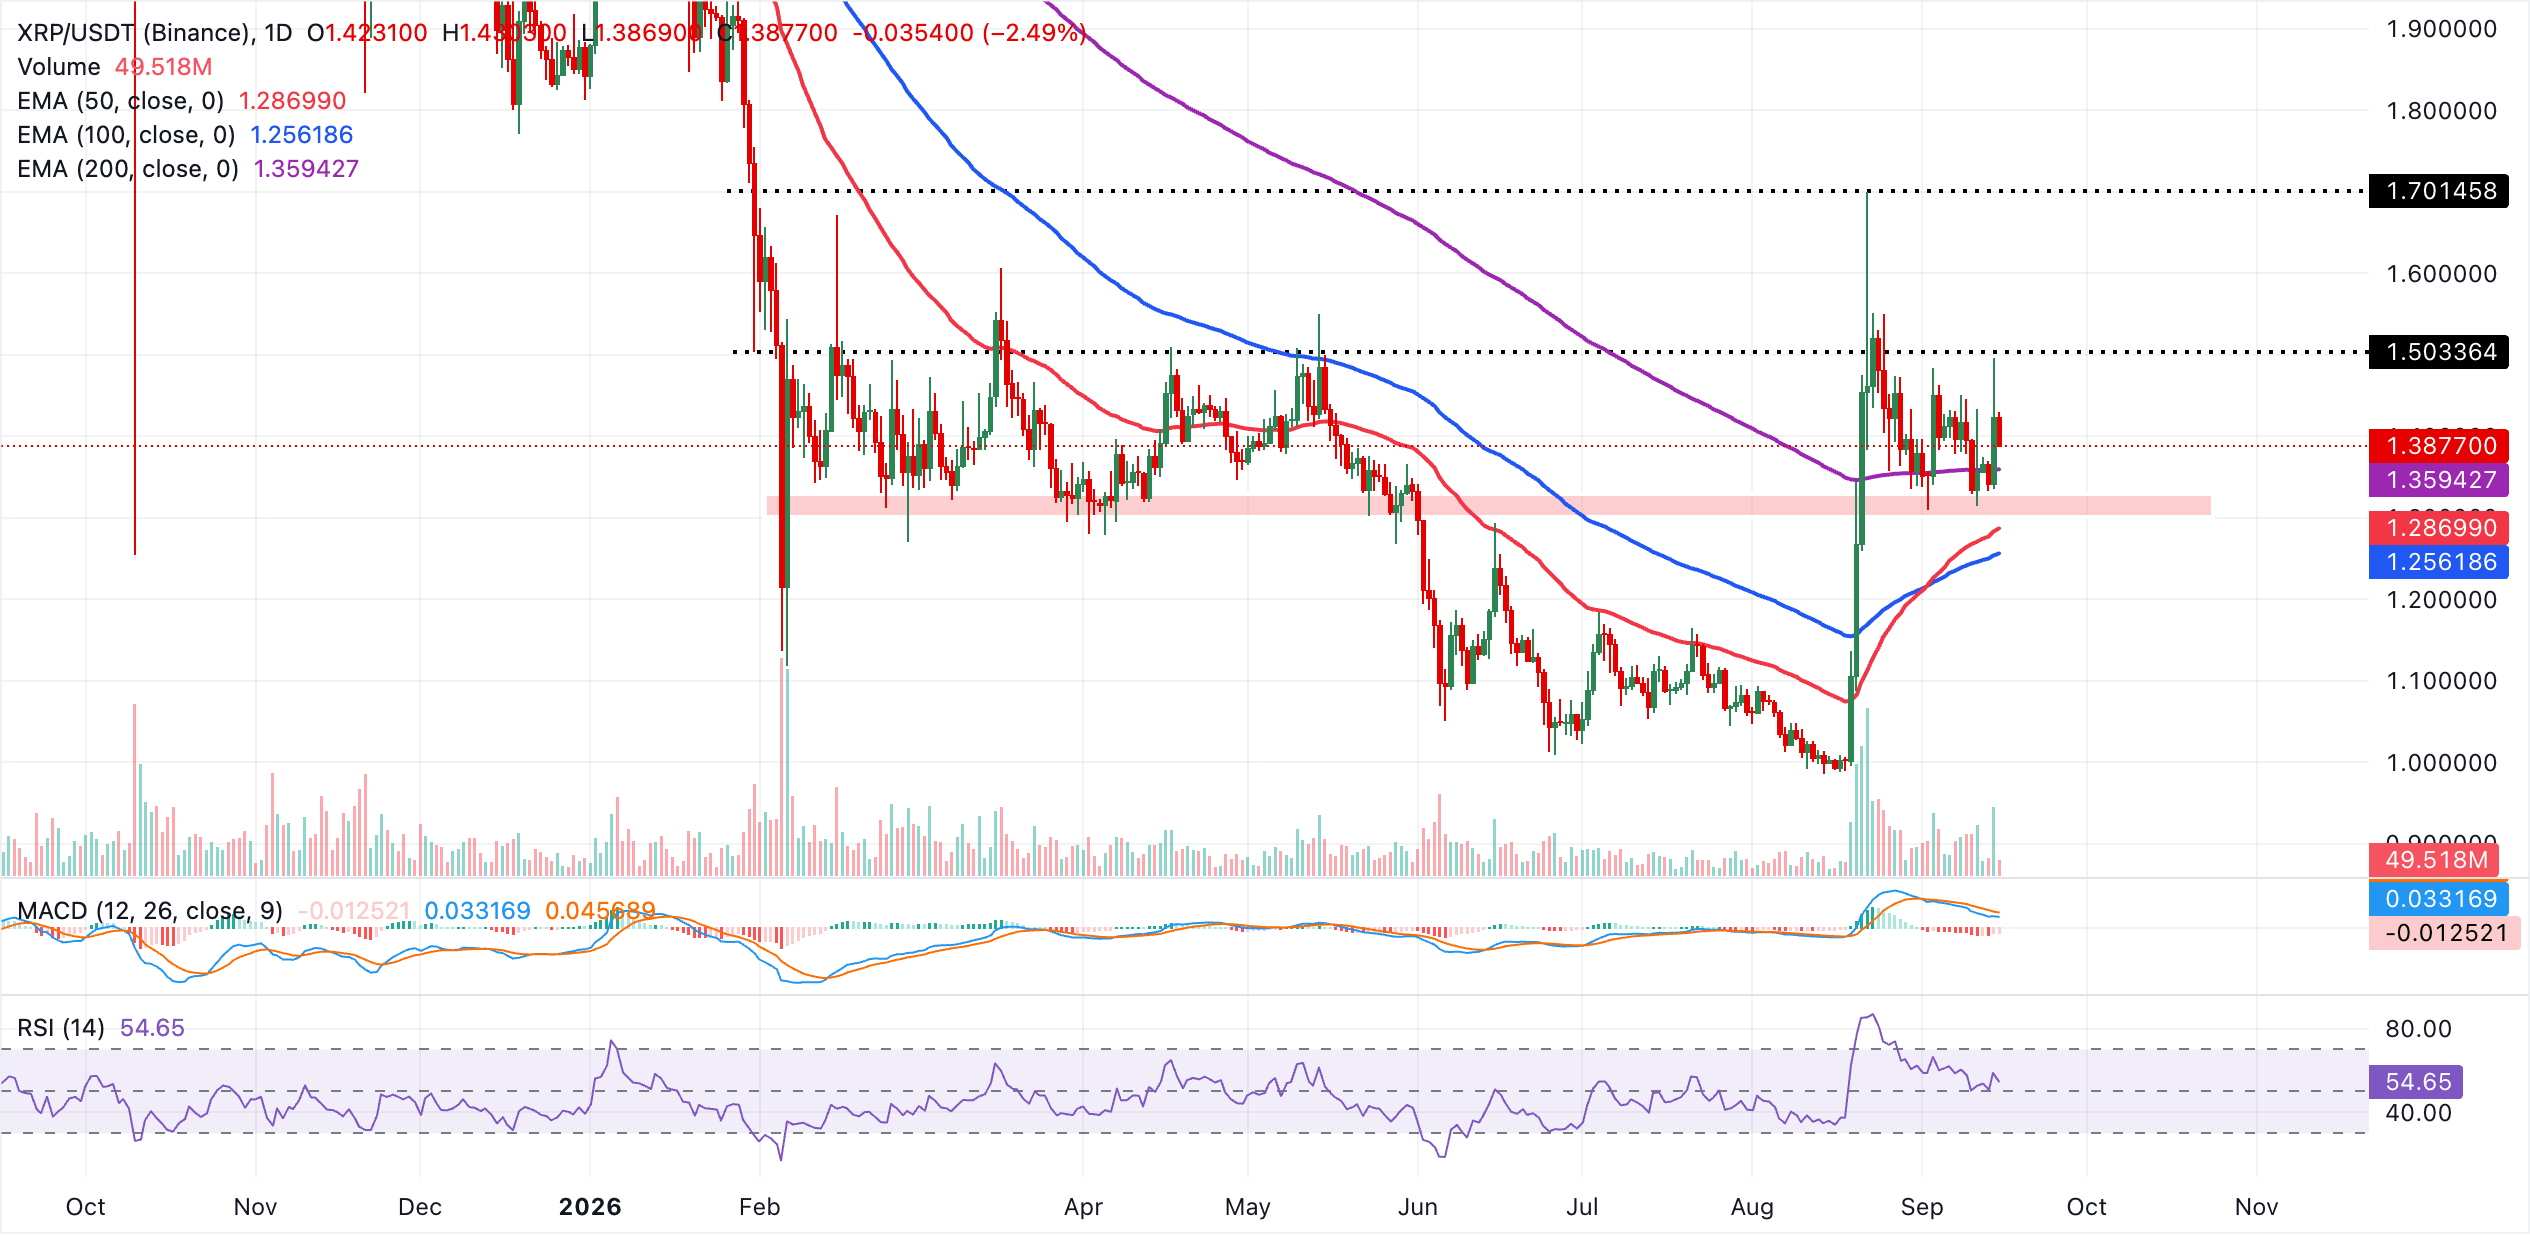
The first meaningful resistance that bulls need to reclaim to revive a more constructive trend is the supply at $1.40, followed by the next pyschological level at $1.50. On the downside, initial support lies at the 200-day EMA at $1.36, followed by the 50-day EMA around $1.29, and the 100-day EMA near $1.26, where buyers would be expected to re-emerge if a deeper pullback unfolds.
(The technical analysis of this story was written with the help of an AI tool. Know more.)
Crypto ETF FAQs
An Exchange-Traded Fund (ETF) is an investment vehicle or an index that tracks the price of an underlying asset. ETFs can not only track a single asset, but a group of assets and sectors. For example, a Bitcoin ETF tracks Bitcoin’s price. ETF is a tool used by investors to gain exposure to a certain asset.
Yes. The first Bitcoin futures ETF in the US was approved by the US Securities & Exchange Commission in October 2021. A total of seven Bitcoin futures ETFs have been approved, with more than 20 still waiting for the regulator’s permission. The SEC says that the cryptocurrency industry is new and subject to manipulation, which is why it has been delaying crypto-related futures ETFs for the last few years.
Yes. The SEC approved in January 2024 the listing and trading of several Bitcoin spot Exchange-Traded Funds, opening the door to institutional capital and mainstream investors to trade the main crypto currency. The decision was hailed by the industry as a game changer.
The main advantage of crypto ETFs is the possibility of gaining exposure to a cryptocurrency without ownership, reducing the risk and cost of holding the asset. Other pros are a lower learning curve and higher security for investors since ETFs take charge of securing the underlying asset holdings. As for the main drawbacks, the main one is that as an investor you can’t have direct ownership of the asset, or, as they say in crypto, “not your keys, not your coins.” Other disadvantages are higher costs associated with holding crypto since ETFs charge fees for active management. Finally, even though investing in ETFs reduces the risk of holding an asset, price swings in the underlying cryptocurrency are likely to be reflected in the investment vehicle too.














