
Silver Price Forecast: XAG reclaims 200-day SMA as double bottom forms
Par Christian Borjon Valencia
Mis à jour: 15 Jun 2026


ARTICLES POPULAIRES
Silver price registers gains of over 3% as the white metal reclaims the 200-day Simple Moving Average (SMA) of $68.59, on geopolitical news linked to the US-Iran conflict.
- Silver reclaims 200-day SMA as double bottom pattern emerges.
- RSI improves from bearish territory, signaling buyers are stepping in.
- Break above $70.50 exposes 20-day SMA and $75.36 resistance.
Silver price registers gains of over 3% as the white metal reclaims the 200-day Simple Moving Average (SMA) of $68.59, on geopolitical news linked to the US-Iran conflict. Broad US Dollar weakness and falling Oil prices pushed the XAG/USD past the $70.00 figure for the first time in the last five days.
XAG/USD Price Forecast: Technical outlook
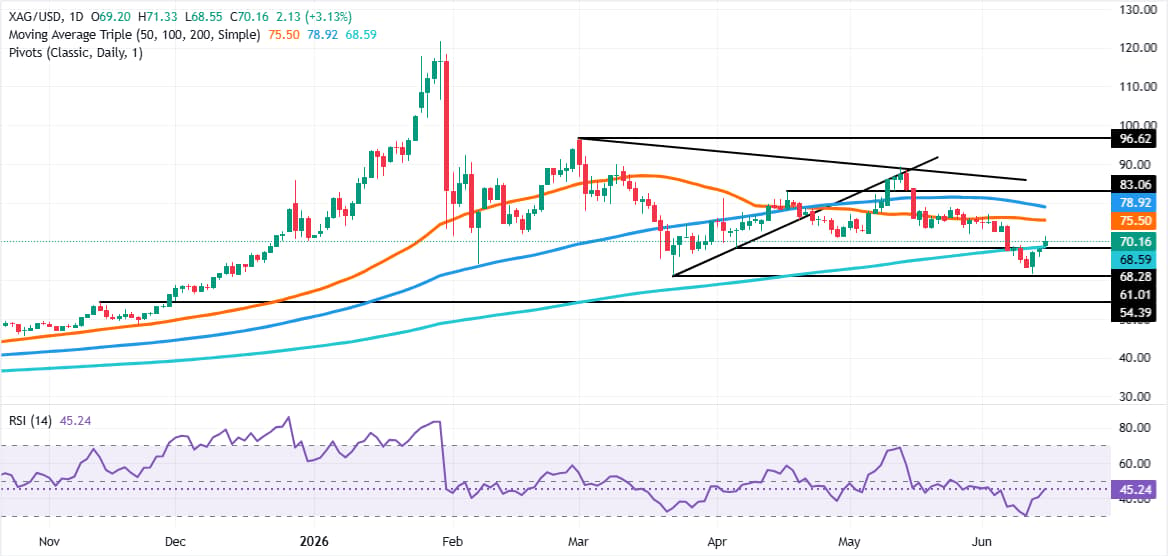
Silver seems to have formed a ‘double bottom’ chart pattern, which could open the door for further gains if the white metal remains above the 200-day SMA. Still, momentum remains mildly bearish, as indicated by the Relative Strength Index (RSI), but it is aiming higher, suggesting buyers are moving in.
If XAG/USD rises past the $70.50 figure, look for a test of the 20-day SMA at $72.42. Above this level is the 50-day SMA at $75.36, followed by the 100-day SMA at $79.29. Once Silver hurdles those two levels, the next stop would be the May 13 high at $89.36.
Downwards, Silver’s first support would be the 200-day SMA at $68.59. A breach of the latter will expose the $65.00 psychological figure. Below this level, the next area of interest is the June 11 cycle low at $61.51.
XAG/USD Price Chart – Daily
Silver FAQs
Silver is a precious metal highly traded among investors. It has been historically used as a store of value and a medium of exchange. Although less popular than Gold, traders may turn to Silver to diversify their investment portfolio, for its intrinsic value or as a potential hedge during high-inflation periods. Investors can buy physical Silver, in coins or in bars, or trade it through vehicles such as Exchange Traded Funds, which track its price on international markets.
Silver prices can move due to a wide range of factors. Geopolitical instability or fears of a deep recession can make Silver price escalate due to its safe-haven status, although to a lesser extent than Gold's. As a yieldless asset, Silver tends to rise with lower interest rates. Its moves also depend on how the US Dollar (USD) behaves as the asset is priced in dollars (XAG/USD). A strong Dollar tends to keep the price of Silver at bay, whereas a weaker Dollar is likely to propel prices up. Other factors such as investment demand, mining supply – Silver is much more abundant than Gold – and recycling rates can also affect prices.
Silver is widely used in industry, particularly in sectors such as electronics or solar energy, as it has one of the highest electric conductivity of all metals – more than Copper and Gold. A surge in demand can increase prices, while a decline tends to lower them. Dynamics in the US, Chinese and Indian economies can also contribute to price swings: for the US and particularly China, their big industrial sectors use Silver in various processes; in India, consumers’ demand for the precious metal for jewellery also plays a key role in setting prices.
Silver prices tend to follow Gold's moves. When Gold prices rise, Silver typically follows suit, as their status as safe-haven assets is similar. The Gold/Silver ratio, which shows the number of ounces of Silver needed to equal the value of one ounce of Gold, may help to determine the relative valuation between both metals. Some investors may consider a high ratio as an indicator that Silver is undervalued, or Gold is overvalued. On the contrary, a low ratio might suggest that Gold is undervalued relative to Silver.

Plus d’un million d’utilisateurs se tournent vers FXStreet pour des données de marché en temps réel, des outils de graphiques, des analyses d’experts et des actualités Forex. Leur calendrier économique complet et leurs webinaires éducatifs aident les traders à rester informés et à prendre des décisions éclairées. FXStreet s’appuie sur une équipe d’environ 60 professionnels répartis entre le siège de Barcelone et diverses régions du monde.
Lire la suite


