
Silver Price Forecast: XAG slides below 200-day SMA, bears target $61
Par Christian Borjon Valencia
Mis à jour: 19 Jun 2026


ARTICLES POPULAIRES

Silver price tumbles for the third consecutive trading day, down by over 3.32% on Friday, courtesy of broad US Dollar strength, and rising US Treasury yields, which have aimed higher since Wednesday, due to the Fed hawkish tilt.
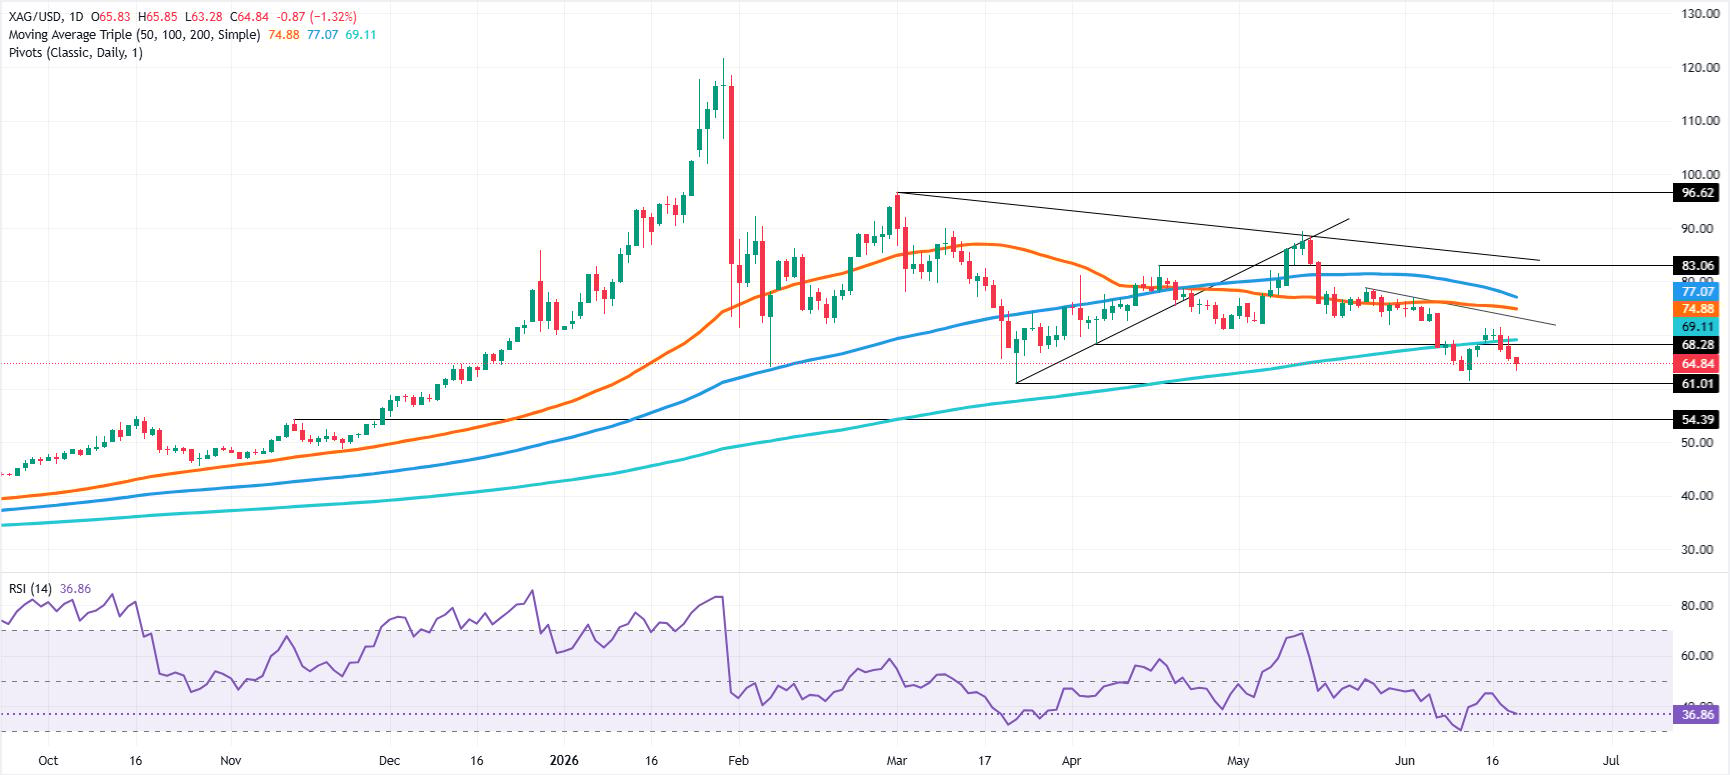
- Silver breaks below 200-day SMA as sellers regain control.
- RSI remains bearish, though downside momentum begins losing steam.
- Break below $61.06 exposes $60.00 and $54.39 supports.
Silver price tumbles for the third consecutive trading day, down by over 3.32% on Friday, courtesy of broad US Dollar strength, and rising US Treasury yields, which have aimed higher since Wednesday, due to the Fed hawkish tilt.
XAG/USD Price Forecast: Technical Outlook
Silver price continued to trend lower after clearing the 200-day Simple Moving Average (SMA) at $69.11, which was tested three times this week, but buyers surrendered, and sellers are gaining the upper hand, pushing the white metal below $65.00.
Momentum shows that bears have continued to gain traction, as indicated by the Relative Strength Index (RSI), though it’s worth noting that sellers seem to be losing some steam.
For a bearish continuation, XAG/USD needs to clear the March 23 daily low of $61.06. Below this, the next support would be the $60.00 milestone, followed by November 13, 2025, daily high-turned-support at $54.39, ahead of the $50.00 mark.
Conversely, for XAG/USD to resume its uptrend, buyers must conquer the 200-day SMA at $69.11. Above this level, the next area of interest would be the $70.00 figure, followed by the 50-day SMA at $74.88.
XAG/USD Price Chart – Daily
Silver FAQs
Silver is a precious metal highly traded among investors. It has been historically used as a store of value and a medium of exchange. Although less popular than Gold, traders may turn to Silver to diversify their investment portfolio, for its intrinsic value or as a potential hedge during high-inflation periods. Investors can buy physical Silver, in coins or in bars, or trade it through vehicles such as Exchange Traded Funds, which track its price on international markets.
Silver prices can move due to a wide range of factors. Geopolitical instability or fears of a deep recession can make Silver price escalate due to its safe-haven status, although to a lesser extent than Gold's. As a yieldless asset, Silver tends to rise with lower interest rates. Its moves also depend on how the US Dollar (USD) behaves as the asset is priced in dollars (XAG/USD). A strong Dollar tends to keep the price of Silver at bay, whereas a weaker Dollar is likely to propel prices up. Other factors such as investment demand, mining supply – Silver is much more abundant than Gold – and recycling rates can also affect prices.
Silver is widely used in industry, particularly in sectors such as electronics or solar energy, as it has one of the highest electric conductivity of all metals – more than Copper and Gold. A surge in demand can increase prices, while a decline tends to lower them. Dynamics in the US, Chinese and Indian economies can also contribute to price swings: for the US and particularly China, their big industrial sectors use Silver in various processes; in India, consumers’ demand for the precious metal for jewellery also plays a key role in setting prices.
Silver prices tend to follow Gold's moves. When Gold prices rise, Silver typically follows suit, as their status as safe-haven assets is similar. The Gold/Silver ratio, which shows the number of ounces of Silver needed to equal the value of one ounce of Gold, may help to determine the relative valuation between both metals. Some investors may consider a high ratio as an indicator that Silver is undervalued, or Gold is overvalued. On the contrary, a low ratio might suggest that Gold is undervalued relative to Silver.

Plus d’un million d’utilisateurs se tournent vers FXStreet pour des données de marché en temps réel, des outils de graphiques, des analyses d’experts et des actualités Forex. Leur calendrier économique complet et leurs webinaires éducatifs aident les traders à rester informés et à prendre des décisions éclairées. FXStreet s’appuie sur une équipe d’environ 60 professionnels répartis entre le siège de Barcelone et diverses régions du monde.
Lire la suite


