
Solana Price Forecast: ETF outflows and bearish sentiment reinforce downside risks
Par Manish Chhetri
Mis à jour: 8 Jun 2026


ARTICLES POPULAIRES

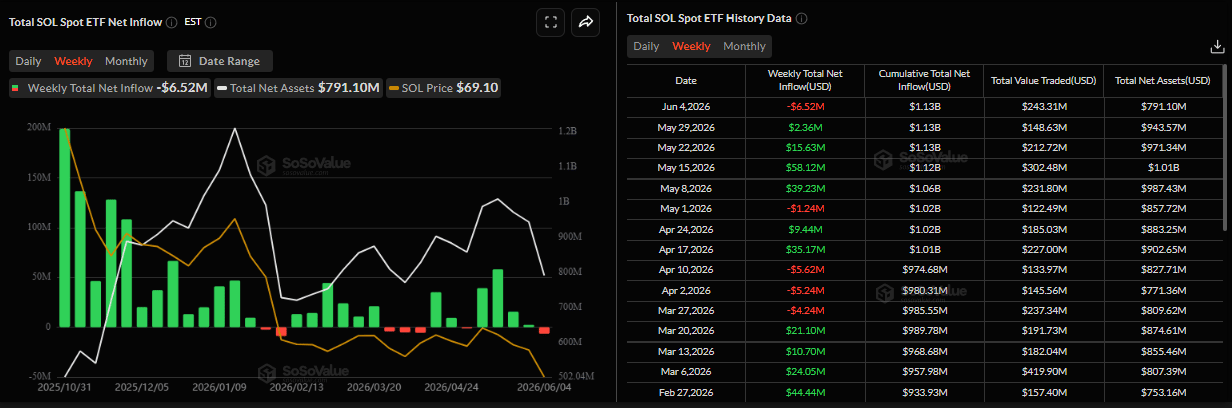
Solana (SOL) remains under pressure, trading below $66 on Monday after losing nearly 20% in the previous week. Institutional demand weakened with spot Exchange Traded Funds (ETFs) recording a net outflow of over $6.5 million last week, snapping a four-week streak of inflows.
- Solana trades below $66 on Monday after falling nearly 20% in the previous week.
- US-listed spot Solana ETFs recorded $6.52 million in net outflows last week, snapping a four-week streak of inflows.
- Bearish technical outlook and deteriorating market sentiment suggest SOL could face further downside.
Solana (SOL) remains under pressure, trading below $66 on Monday after losing nearly 20% in the previous week. Institutional demand weakened with spot Exchange Traded Funds (ETFs) recording a net outflow of over $6.5 million last week, snapping a four-week streak of inflows. In addition, bearish technical outlook and weakening derivatives metrics suggest SOL could extend deeper correction in the near term.
Weakening institutional demand for SOL
Institutional demand for SOL weakened last week. SoSoValue data showed that spot Solana ETFs recorded an outflow of $6.52 million last week, breaking the four-week streak of positive flows since May 8. If this outflow trend persists and intensifies this week, SOL could see further correction ahead.
Derivatives data shows a bearish bias
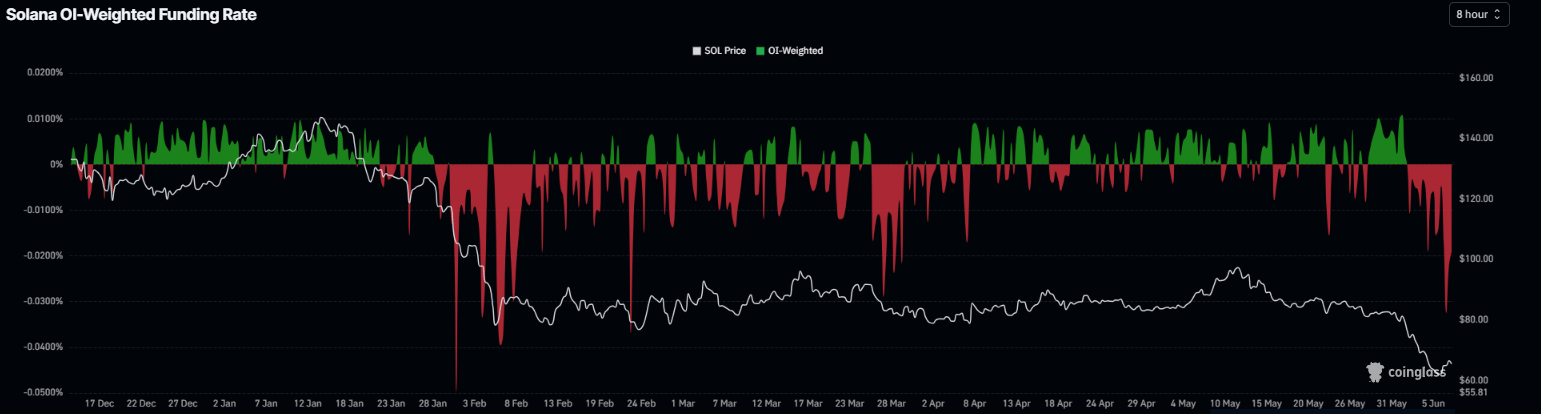
On the derivatives side, market positioning continues to support a bearish outlook. Solana's funding rate turned negative on Tuesday and plunged further on Sunday, reaching its lowest level since late February. The metric remains in negative territory at -0.0192% on Monday, indicating that shorts are paying longs. Historically, periods when funding rates have flipped from positive to negative and remained below zero have often coincided with sharp SOL corrections following brief recovery attempts.
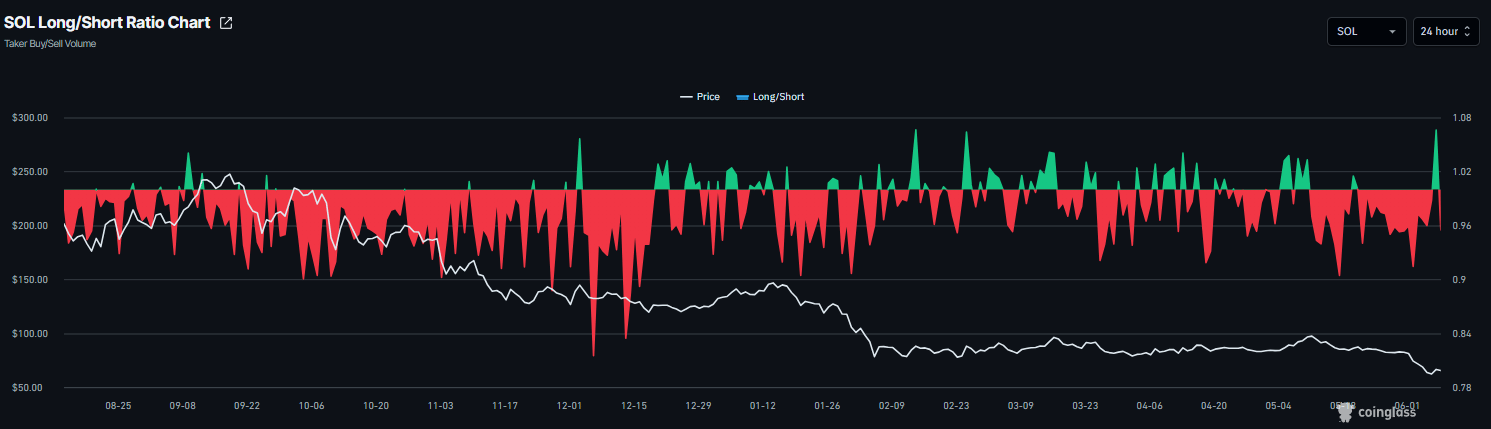
In addition, Coinglass’s long-to-short ratio for SOL reads 0.95 on Monday. The ratio being below one, indicates bearish sentiment, as traders are betting the asset’s price will fall.
Solana Price Forecast: SOL bears aiming for levels below $60
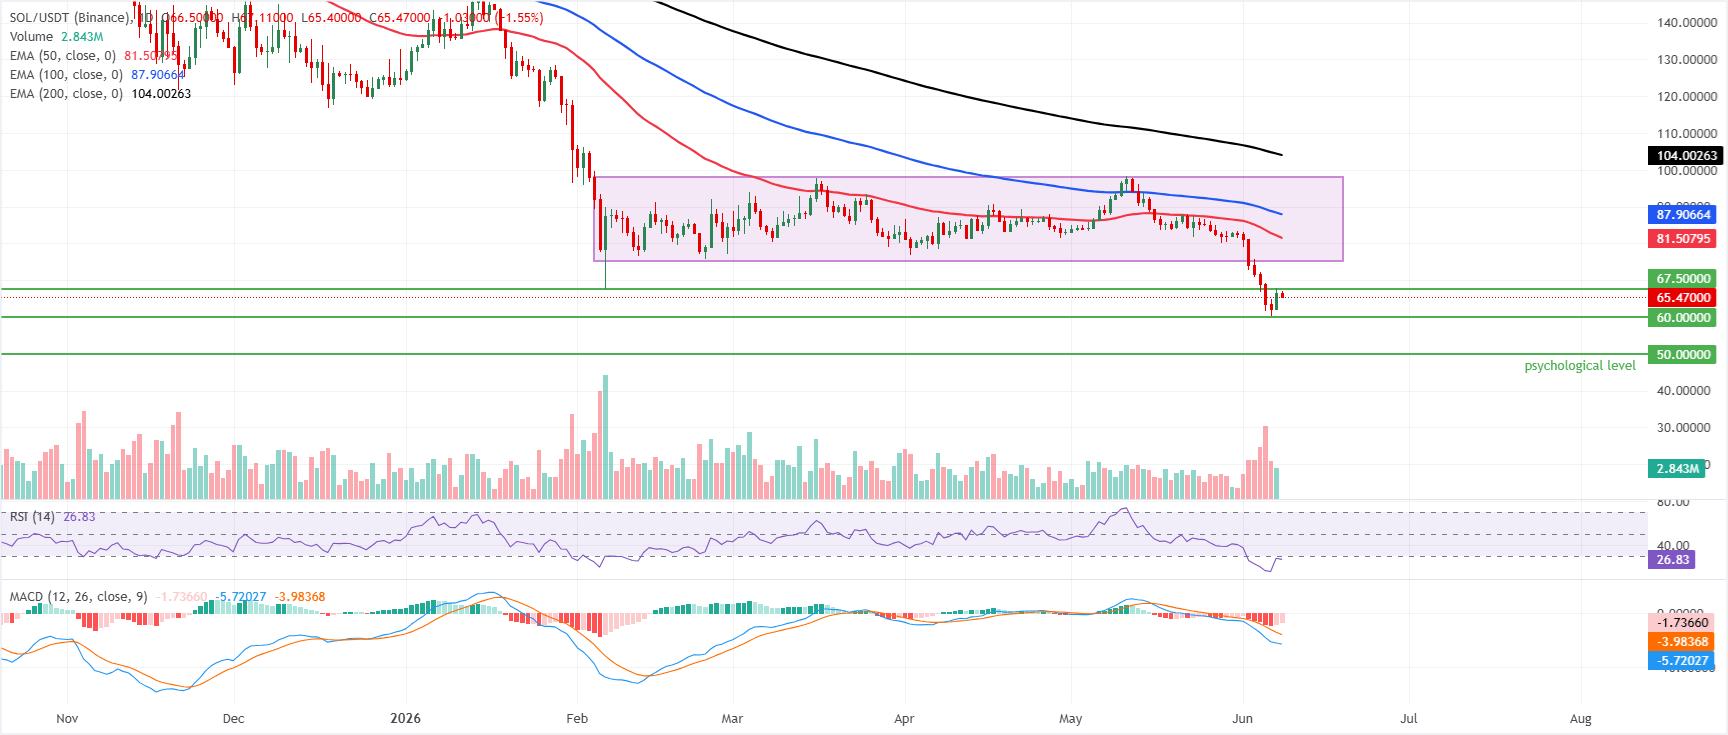
Solana price trades at $65.47, maintaining a bearish near-term bias as it remains well below the 50-day, 100-day, and 200-day Exponential Moving Averages (EMAs) at $81.50, $87.90, and $104, respectively. SOL is attempting to stabilize after a steep sell-off. Still, the Moving Average Convergence Divergence (MACD) remains in negative territory, and the Relative Strength Index (RSI) on the daily chart hovers near 27 in oversold territory, which together suggests that while downside momentum is stretched, sellers still dominate unless key overhead levels are reclaimed.
On the topside, initial resistance is seen at the horizontal barrier near $67.50, with further recovery likely to face stronger supply at the 50-day EMA around $81.50, followed by the 100-day EMA at $87.90 and the 200-day EMA at $104.00.
On the downside, immediate support is aligned with the prior horizontal floor at $60.00, ahead of a more substantial structural level at $50.00; a break below these zones would extend the broader downtrend despite the oversold signals.
(The technical analysis of this story was written with the help of an AI tool.)

Plus d’un million d’utilisateurs se tournent vers FXStreet pour des données de marché en temps réel, des outils de graphiques, des analyses d’experts et des actualités Forex. Leur calendrier économique complet et leurs webinaires éducatifs aident les traders à rester informés et à prendre des décisions éclairées. FXStreet s’appuie sur une équipe d’environ 60 professionnels répartis entre le siège de Barcelone et diverses régions du monde.
Lire la suite


