
Solana Price Forecast: Momentum withers as institutional demand weakens
Par Vishal Dixit
Mis à jour: 15 Apr 2026


ARTICLES POPULAIRES

Solana (SOL) remains under pressure, trading around $80 at press time on Wednesday, down 5% the previous day. Lack of institutional support for Solana prolongs its consolidation while the retail market shows near-term sell-side dominance.
- Solana extends its decline on Wednesday below its 50-day EMA, risking further decline.
- Institutional demand for Solana remains muted, weighing down on its spot price.
- SOL futures Open Interest drops 5% in 24 hours, suggesting that the leverage market is shifting focus away from Solana.
Solana (SOL) remains under pressure, trading around $80 at press time on Wednesday, down 5% the previous day. Lack of institutional support for Solana prolongs its consolidation while the retail market shows near-term sell-side dominance. Solana should reclaim the 100-day Exponential Moving Average (EMA) around $100 for a steady recovery.
Muted institutional and retail demand weighs down on Solana
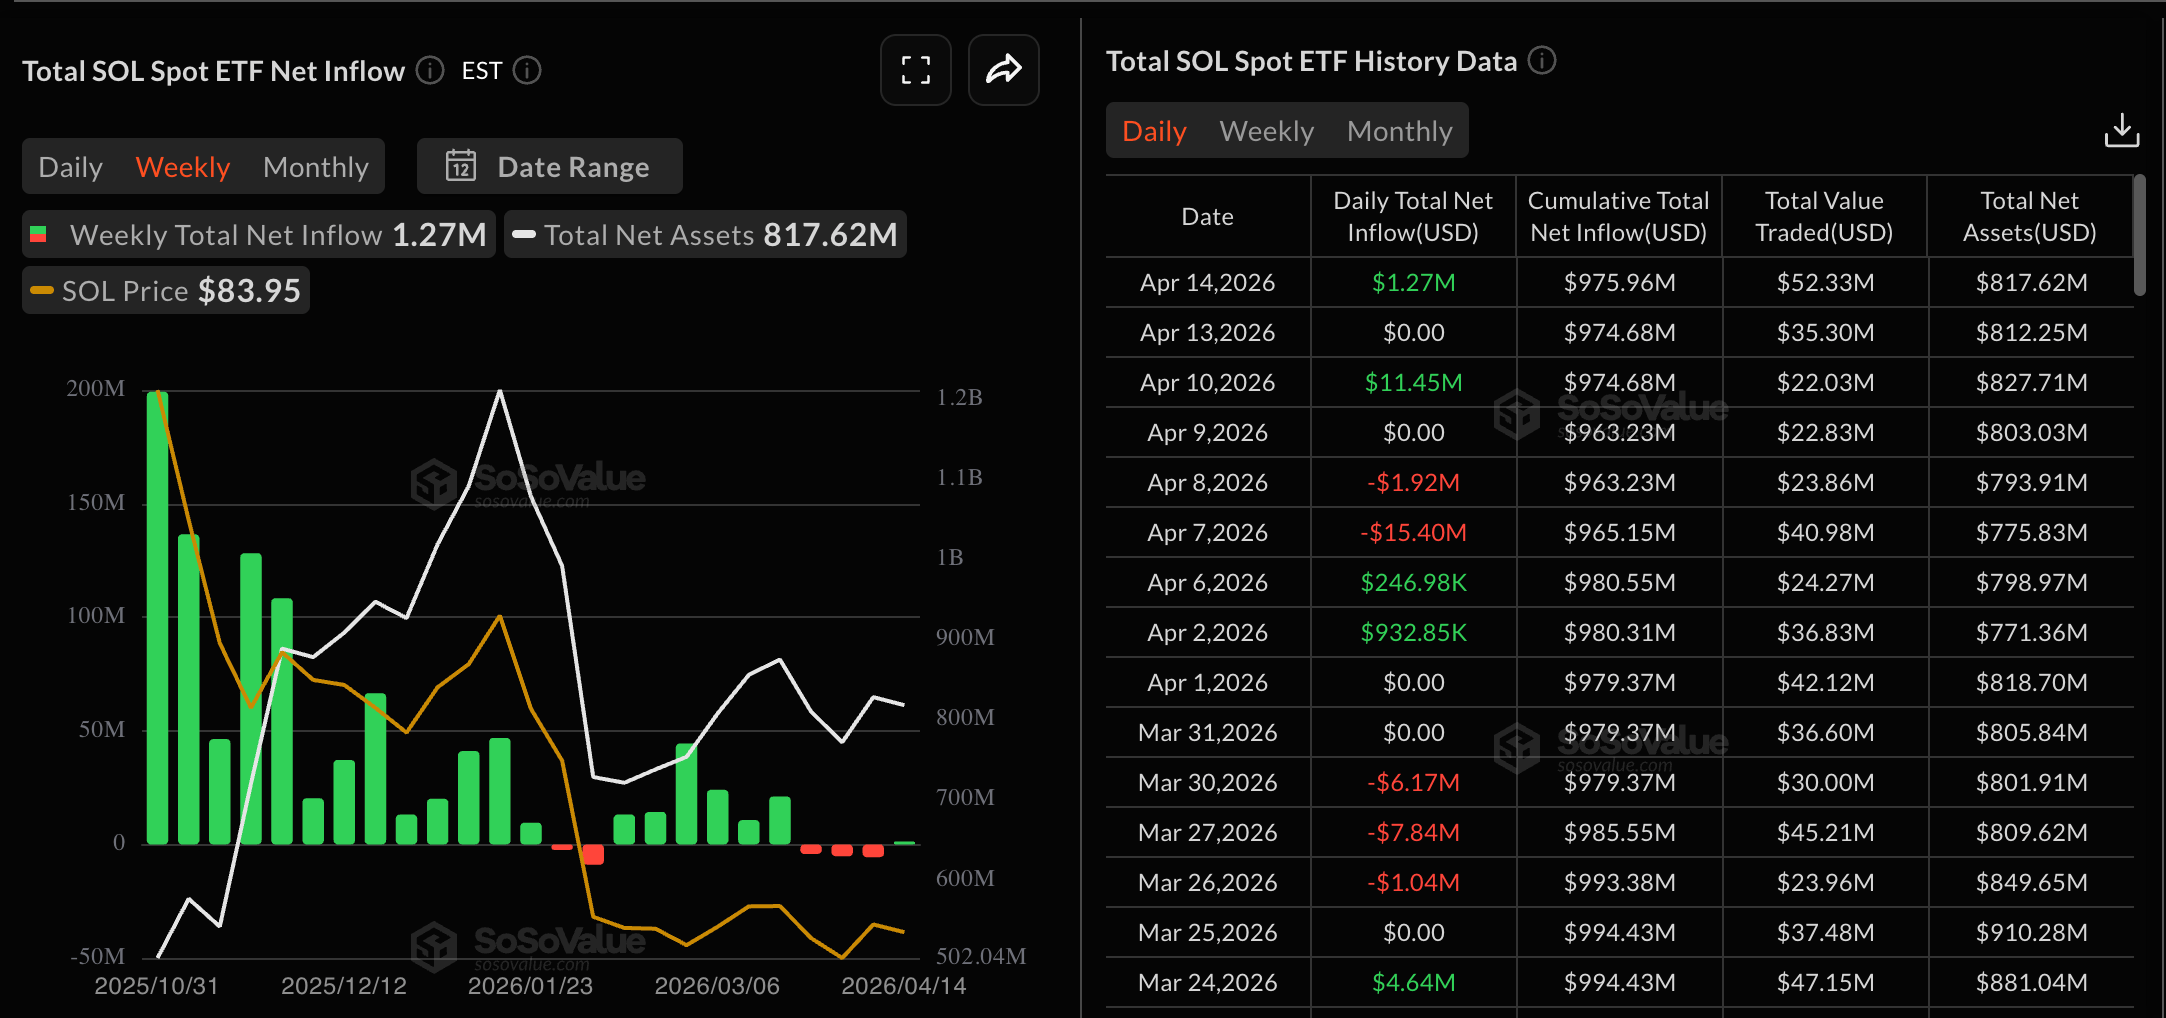
Institutions are rebalancing their Solana exposure through Exchange Traded Funds (ETFs), which have recorded three consecutive weekly outflows. SoSoValue data shows $1.27 million in inflows into SOL spot ETFs, suggesting renewed interest that could break the weekly outflows streak.
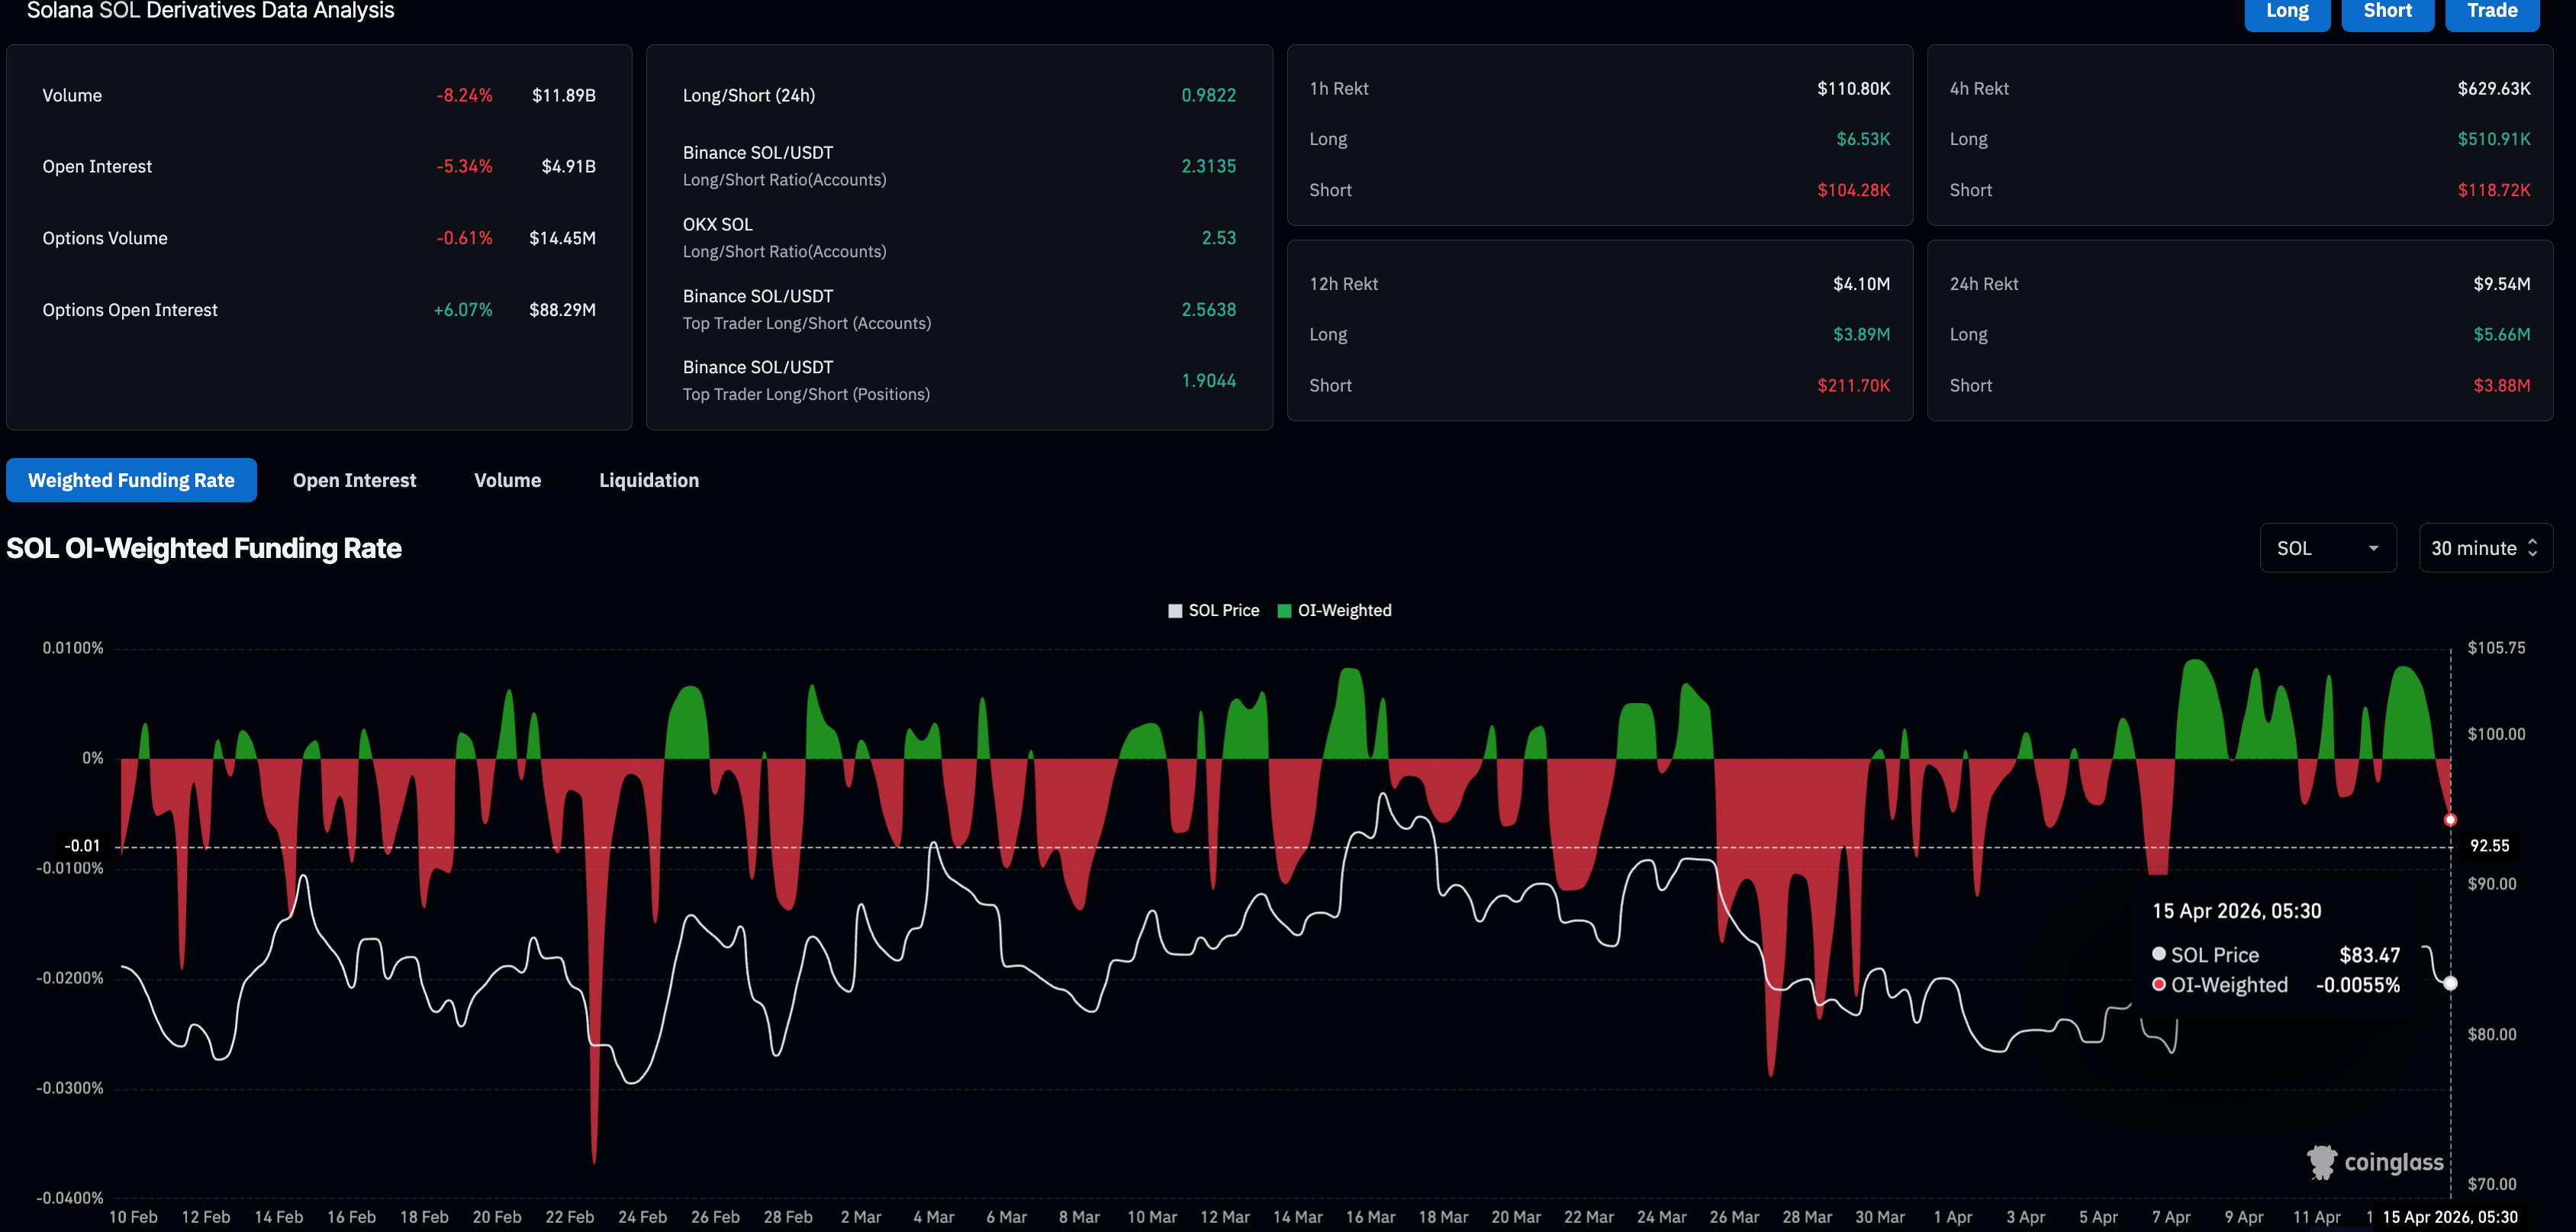
On the other hand, retail demand for Solana declines amid broader market volatility. CoinGlass data shows the SOL futures Open Interest (OI) is down 5% over the last 24 hours to $4.91 billion, suggesting reduced positional exposure. Meanwhile, the funding rate drops to -0.0055%, indicating that traders are willing to hold short positions, evidenced by the long-to-short ratio of 0.9822.
Solana struggles within a larger consolidation
Solana remains in a broadly bearish configuration, trading beneath the 50-day, 100-day, and 200-day Exponential Moving Averages (EMAs), which all act as overhead supply and cap recovery attempts.
The Moving Average Convergence Divergence (MACD) indicator shows its line holding in positive territory with a modest bullish tilt. Meanwhile, the Relative Strength Index (RSI) at 48 hovers just below the 50 line, suggesting upside momentum is stabilizing but has yet to overcome the dominant overhead structure.
On the topside, a daily close above the 50-day EMA near $87.29 would ease immediate downside pressure. Further up, the 100-day EMA around $98.24 is the next significant hurdle, followed by the 200-day EMA near $116.85, which reinforces the broader bearish bias.
Looking down, the immediate support aligns with the February 5 low at $77.60.
(The technical analysis of this story was written with the help of an AI tool.)

Plus d’un million d’utilisateurs se tournent vers FXStreet pour des données de marché en temps réel, des outils de graphiques, des analyses d’experts et des actualités Forex. Leur calendrier économique complet et leurs webinaires éducatifs aident les traders à rester informés et à prendre des décisions éclairées. FXStreet s’appuie sur une équipe d’environ 60 professionnels répartis entre le siège de Barcelone et diverses régions du monde.
Lire la suite


