
Solana Price Forecast: SOL extends correction despite ETF inflows, RWA adoption
Par Vishal Dixit
Mis à jour: 19 Jun 2026


ARTICLES POPULAIRES

Solana (SOL) price edges below $70 at press time on Friday, extending its losses for the fourth straight day this week. The institutional demand for Solana is building, with steady inflows so far this week and Morgan Stanley’s amended S-1 filing for a Solana-focused Exchange-Traded Fund (ETF).
- Solana is down roughly 3% so far this week, suggesting a continuation of the bearish trend after a mild 7% recovery last week.
- Roughly $3 million in inflows on Thursday and Morgan Stanley’s amended S-1 form for SOL-focused ETF reflect growing institutional interest in Solana.
- The largest RWA holder count in the crypto market on Solana reflects growing retail user demand after the tokenized SpaceX IPO.
Solana (SOL) price edges below $70 at press time on Friday, extending its losses for the fourth straight day this week. The institutional demand for Solana is building, with steady inflows so far this week and Morgan Stanley’s amended S-1 filing for a Solana-focused Exchange-Traded Fund (ETF). Retail user interest is also building, with a base of over 285,000 holders in the Solana ecosystem, fueled by the tokenized SpaceX IPO.
The institutional demand for Solana remains unnoticed
Solana emerges as one of the preferred altcoins among institutional investors, driven by steady inflows. Data show SOL-focused ETFs recorded $2.99 million in inflows on Thursday, bringing weekly inflows to $7.11 million and limiting the monthly outflow to $2.00 million so far. A steady stream of inflows next week could shift the monthly flow to positive, extending the streak of eight consecutive monthly inflows.
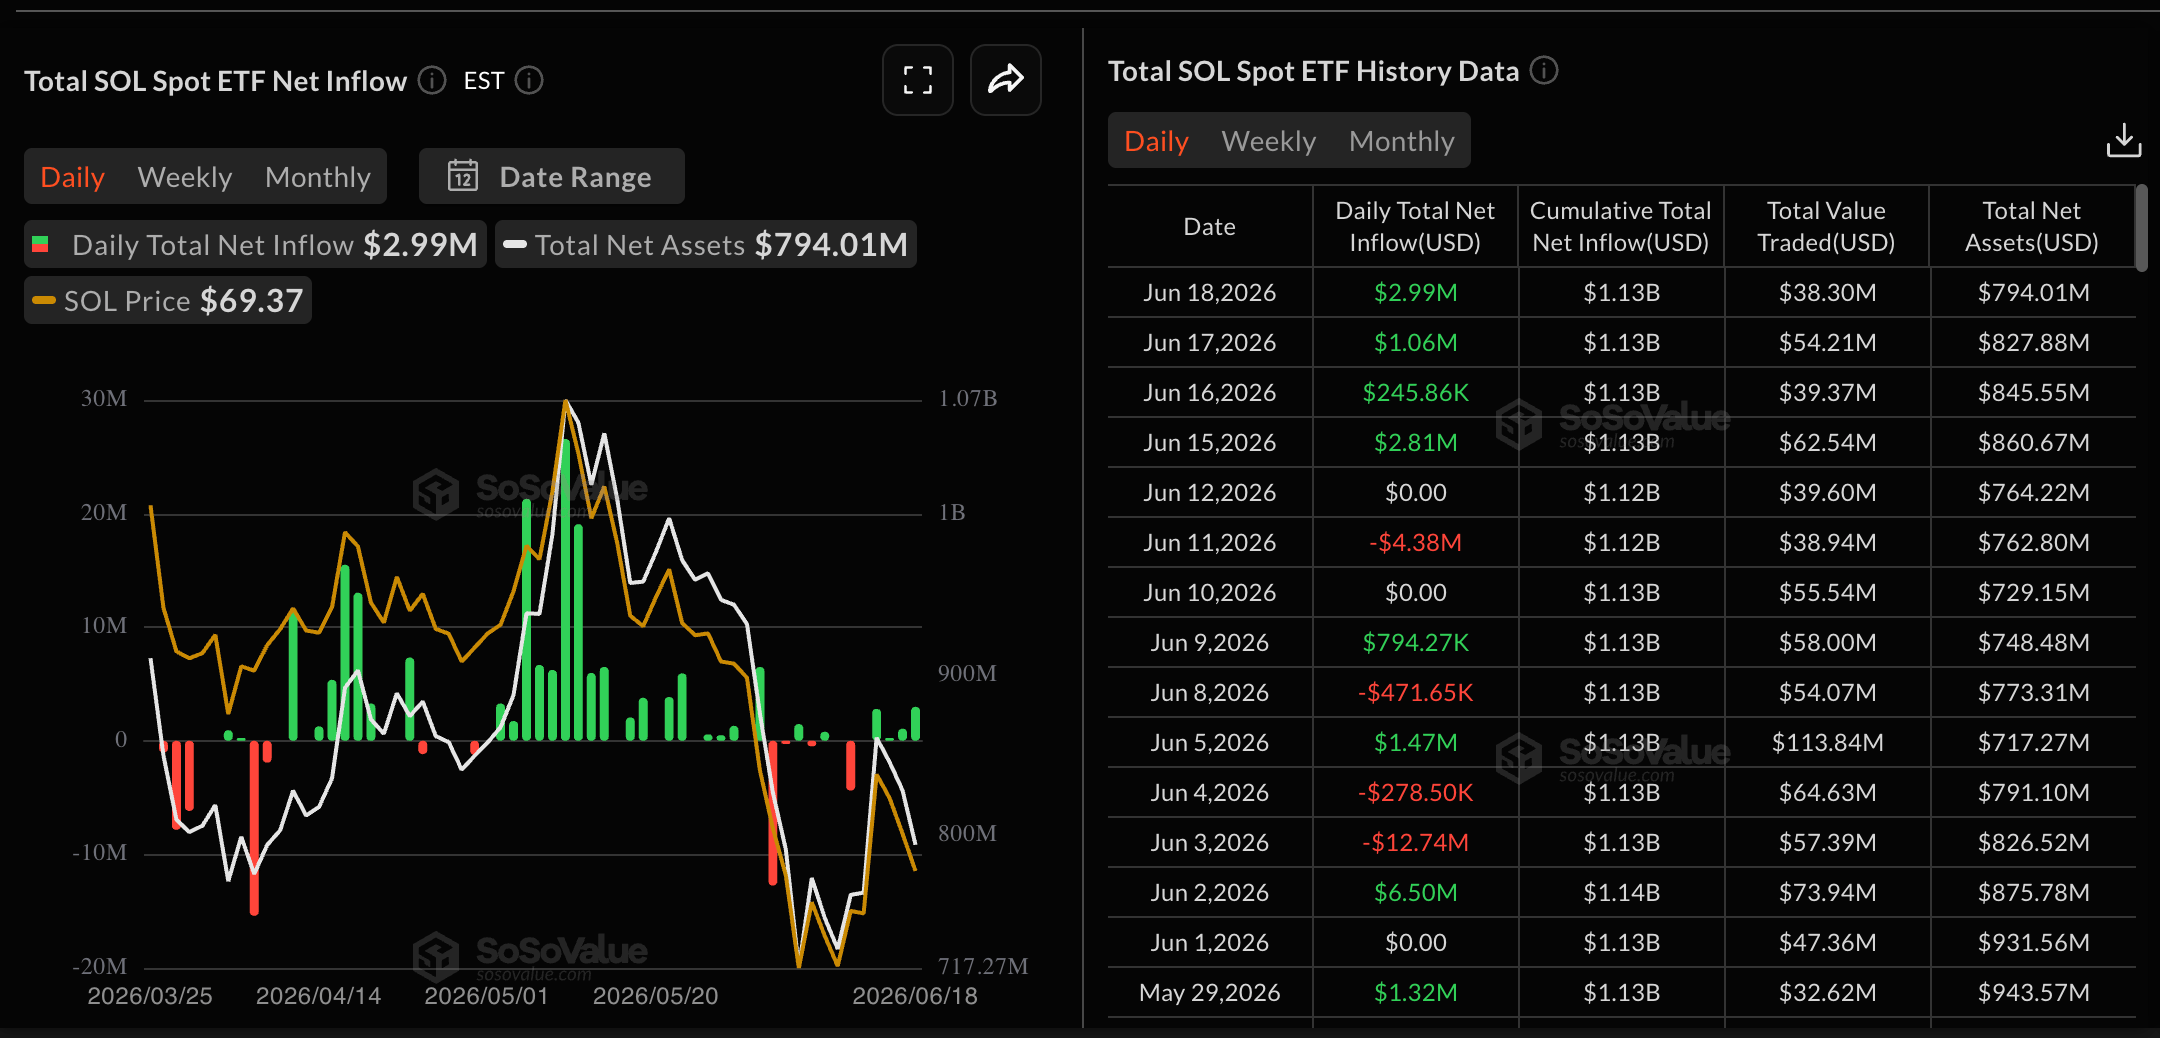
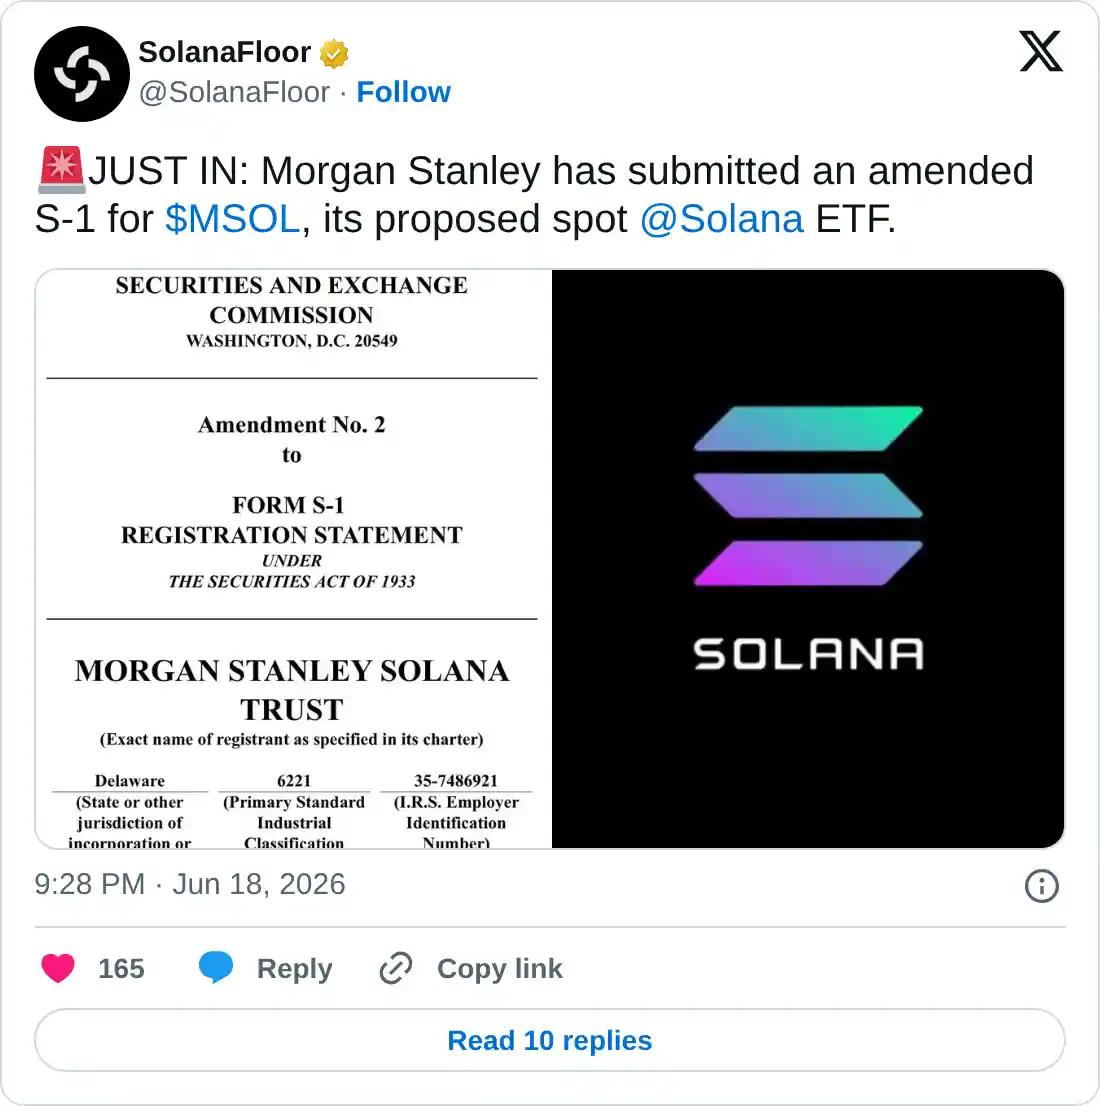
Adding to the growing institutional demand, Morgan Stanley filed an amended S-1 form with the US Securities and Exchange Commission (SEC) on Thursday for its SOL-focused ETF, MSOL.
Mixed retail demand keeps SOL undervalued
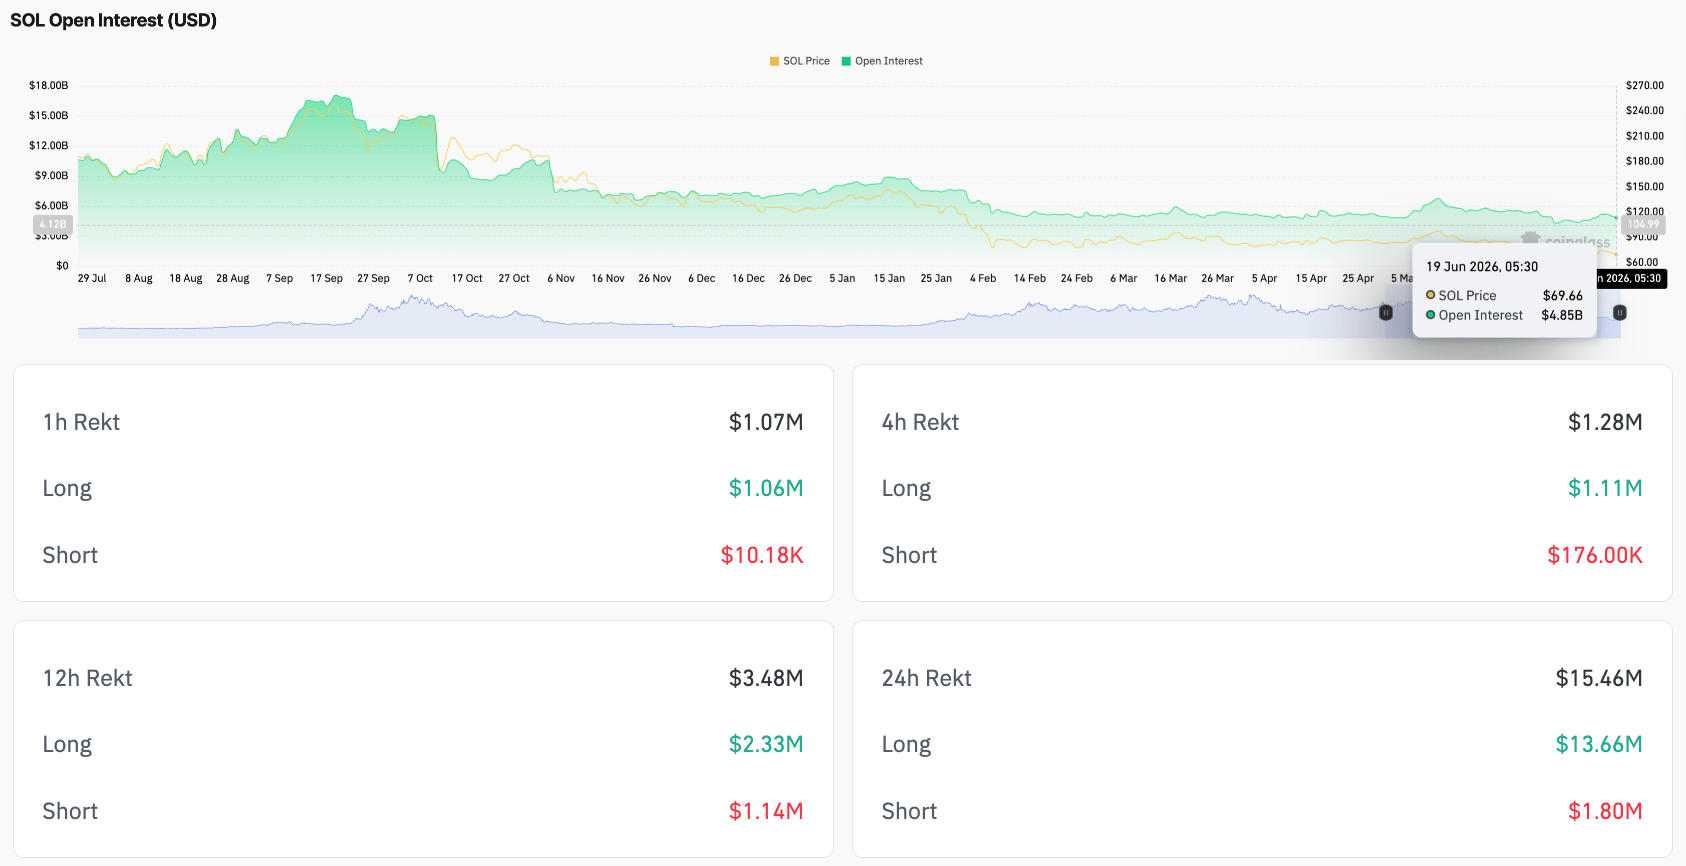
Solana is losing its retail strength in the derivatives market, while on-chain user activity hits a record high, reflecting mixed sentiment. CoinGlass data show SOL futures Open Interest (OI) is down to $4.85 billion on Friday, extending a decline from $5.18 billion on Wednesday as the number of open contracts reduces.
Corroborating reduced retail interest in Solana, around $13.66 million in long liquidations over the last 24 hours outpaced $1.80 million in short liquidations, reflecting a sell-side dominance.
That said, the on-chain user demand for Solana is growing, especially for tokenized Real-World Assets (RWAs). SolanaFloor shared a metric on social media that, following SpaceX's tokenized IPO on Solana, it has become the largest chain for RWAs by holder count, with over 285,000 holders.
Technical outlook: Could Solana bounce back?
Solana maintains a broader bearish bias following its reversal from the $253 peak in September. The price forms a well-defined descending wedge on the weekly chart, pointing to downside toward a Fair-Value Gap (FVG) between $46.90 and $51.12, formed in early November 2023.
From a technical perspective, the descending wedge pattern often leads to an upside breakout, leading to a bullish turnaround. In the case of Solana, buyers should reclaim $75.63, followed by a weekly close above the overhead trendline near $83.50, to signal a clear trend reversal.
That said, the downtick in the Moving Average Convergence Divergence (MACD) tests its signal line on the weekly chart, with positive histograms contracting, suggesting waning bullish momentum. At the same time, the Relative Strength Index (RSI) is around 33, suggesting only modest downside momentum but not yet a convincing recovery backdrop, as the market consolidates below the broader downtrend.
On the downside, the lower descending trendline near the June 6 low at $60.13 guards the FVG between $46.90 and $51.12.
(The technical analysis of this story was written with the help of an AI tool.)

Plus d’un million d’utilisateurs se tournent vers FXStreet pour des données de marché en temps réel, des outils de graphiques, des analyses d’experts et des actualités Forex. Leur calendrier économique complet et leurs webinaires éducatifs aident les traders à rester informés et à prendre des décisions éclairées. FXStreet s’appuie sur une équipe d’environ 60 professionnels répartis entre le siège de Barcelone et diverses régions du monde.
Lire la suite


