
Stellar Price Forecast: XLM slips below $0.22 as bearish momentum builds
Par Manish Chhetri
Date de publication: 24 Dec 2025 | Date de modification: 24 Dec 2025


ARTICLES POPULAIRES
Stellar (XLM) price is trading below $0.22 at the time of writing on Wednesday after failing to close above the key resistance earlier this week. Bearish momentum continues to strengthen, with open interest falling and short bets rising.
- Stellar price slips below $0.22 on Wednesday after failing to break through the weekly resistance earlier this week.
- XLM’s declining open interest and rising short bets in the derivatives market reinforce bearish sentiment.
- The technical outlook supports further correction, with bears aiming for levels below $0.20.
Stellar (XLM) price is trading below $0.22 at the time of writing on Wednesday after failing to close above the key resistance earlier this week. Bearish momentum continues to strengthen, with open interest falling and short bets rising. On the technical side, XLM price action suggests further downside, targeting levels below $0.20.
XLM derivatives data signals bearish sentiment
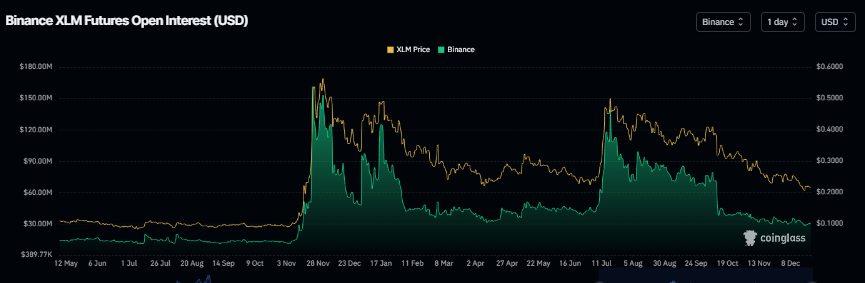
Stellar’s derivatives data sports a bearish outlook. XLM’s futures Open Interest (OI) dropped to $30.30 million on Wednesday, nearing its yearly low, according to Coinglass data. This drop in OI reflects waning investor participation and projects a bearish outlook.
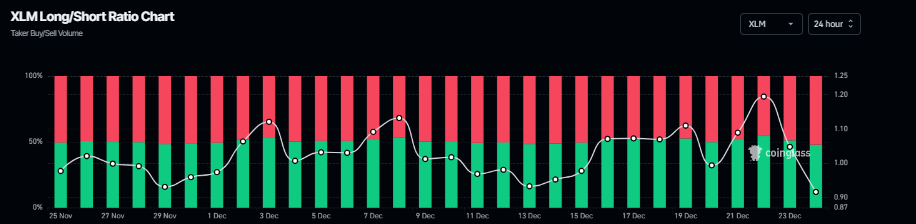
In addition, Coinglass’s long-to-short ratio for XLM reads 0.91 on Wednesday, the highest level over a month. The ratio below one suggests bearish sentiment in the market, as more traders are betting on the XLM price to fall.
Stellar Price Forecast: XLM faces rejection from key resistance
Stellar price was rejected at the weekly resistance level of $0.22 on Tuesday and declined 1.5% that day. As of Wednesday, XLM is trading at $0.21.
If XLM continues its correction, it could extend toward the December 18 low at $0.20. A close below this level could extend the drop toward the yearly low of $0.16, set on October 10.
The Relative Strength Index (RSI) on the daily chart is at 37, below the neutral 50 level, indicating bearish momentum is gaining traction. The Moving Average Convergence Divergence (MACD) lines are also converging, indicating indecision among traders.
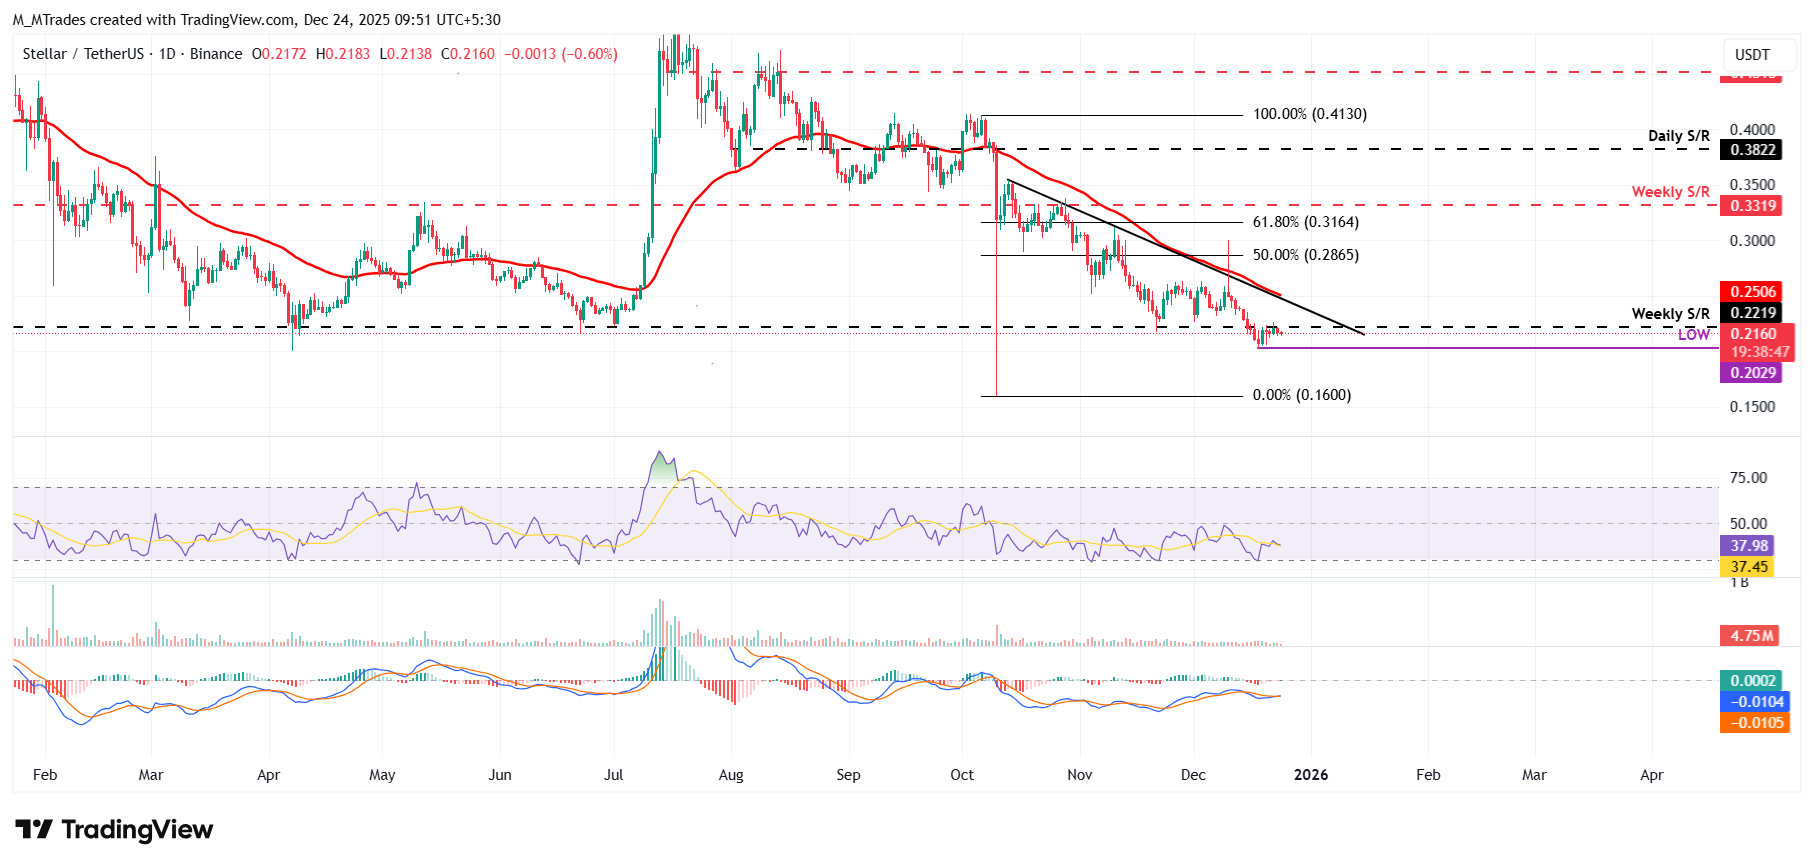
However, if XLM recovers, it could extend the advance toward the weekly resistance level at $0.22.

Plus d’un million d’utilisateurs se tournent vers FXStreet pour des données de marché en temps réel, des outils de graphiques, des analyses d’experts et des actualités Forex. Leur calendrier économique complet et leurs webinaires éducatifs aident les traders à rester informés et à prendre des décisions éclairées. FXStreet s’appuie sur une équipe d’environ 60 professionnels répartis entre le siège de Barcelone et diverses régions du monde.
Lire la suite


