
Top 3 Price Prediction: Bitcoin, Ethereum, Ripple – BTC, ETH and XRP extend rebounds cautiously on hopes of Middle East de-escalation
Par Manish Chhetri
Mis à jour: 1 Apr 2026


ARTICLES POPULAIRES

Bitcoin (BTC), Ethereum (ETH) and Ripple (XRP) edge cautiously higher on improving sentiment as hopes for a de-escalation in the Middle East war support risk assets. BTC is nearing key resistance on Wednesday, while ETH and XRP are rebounding after finding support at critical levels.
- Bitcoin price nears the midpoint of its consolidation range, with a breakout opening the door toward the $72,600 resistance.
- Ethereum extends its recovery after finding support at the key level of $1,950 earlier this week.
- XRP rebounds as the $1.30 horizontal support holds firm.
Bitcoin (BTC), Ethereum (ETH) and Ripple (XRP) edge cautiously higher on improving sentiment as hopes for a de-escalation in the Middle East war support risk assets. BTC is nearing key resistance on Wednesday, while ETH and XRP are rebounding after finding support at critical levels. Traders should keep a watchful eye as the recovery remains cautious, with key technical levels continuing to dictate the next directional move across the top three cryptocurrencies by market capitalization.
Bitcoin could extend gains if it closes above the midpoint of the consolidation range
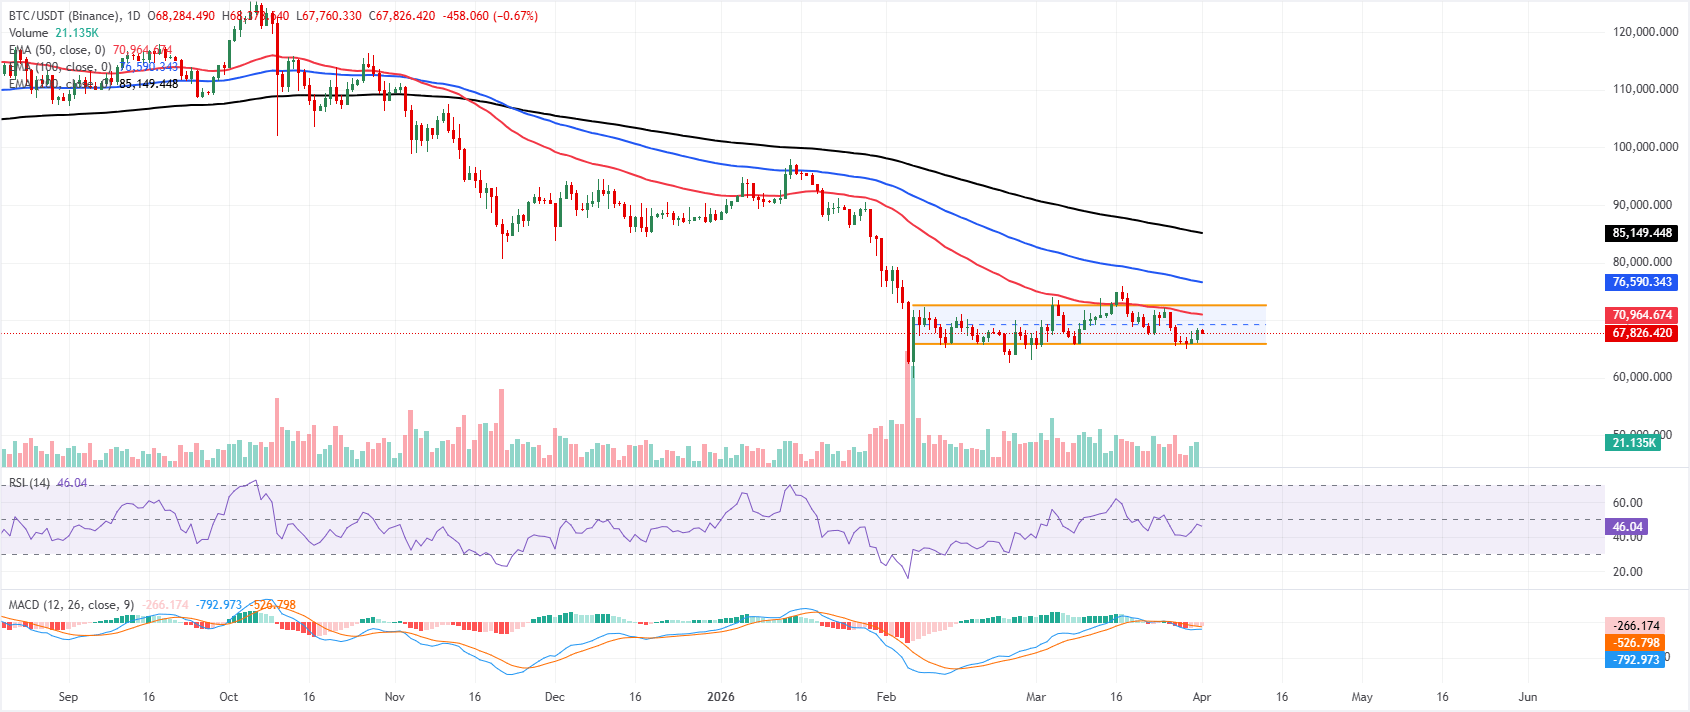
Bitcoin price is trading at $67,800 on Wednesday after rebounding slightly earlier this week. Price holds within a parallel channel, trading closer to the mid-lower band after failing to extend above the upper boundary near $72,600, which preserves a near-term bearish bias within an already corrective structure.
The cluster of 50-day, 100-day and 200-day Exponential Moving Averages (EMAs) well above the current trading price underscores a downside-skewed backdrop, with the 50-day EMA near $71,000 acting as the first dynamic cap on rebounds.
Momentum readings stay soft: the Relative Strength Index (RSI) on the daily chart hovers just below 50, while the Moving Average Convergence Divergence (MACD) line remains below the signal line and slips further under the zero mark, indicating persistent selling pressure rather than a completed bottom.
Initial resistance emerges near the midpoint of the channel, around $69,200, just ahead of the channel top near $72,600, where the consolidating boundary tops converge with the 50-day EMA to form a key barrier; a daily close above this zone would be needed to challenge the 100-day EMA around $76,600 next.
On the downside, immediate support emerges near the channel floor at $65,900, safeguarding the recent series of lower lows, a break below this level would expose follow-through toward the next downside attraction around $64,000. As long as BTC holds beneath $70,000–$72,600, rallies are vulnerable to selling into strength, keeping the short-term bias tilted to the downside within the broader consolidation.
Ethereum rebounds after finding support near the midpoint of the consolidating range
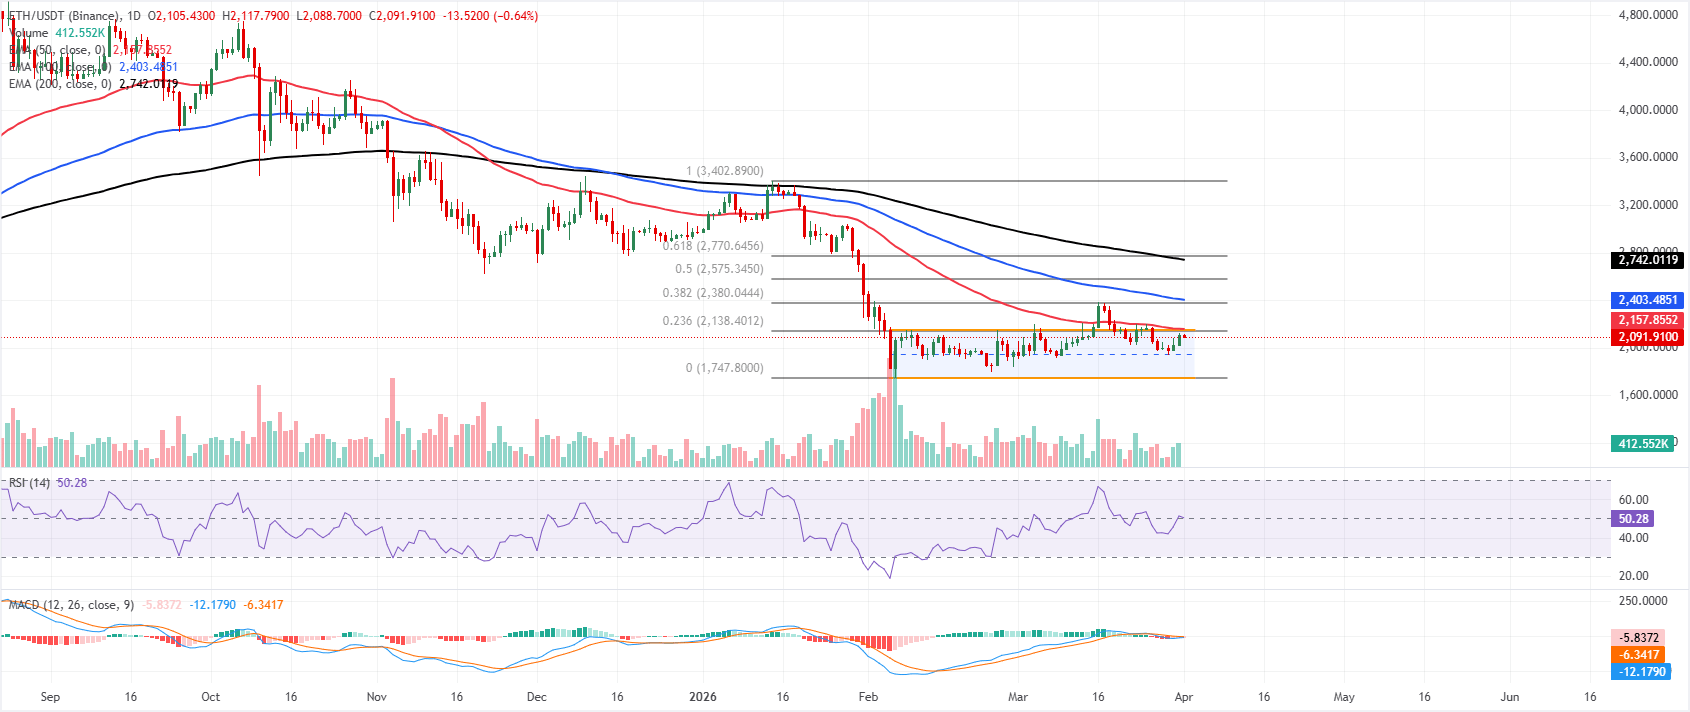
Ethereum is trading at $2,090 on Wednesday after rebounding from a retest of the channel midpoint at $1,950 on Monday. The near-term bias is mildly bearish as price holds below the channel top around $2,148 and remains capped under the 50-day EMA near $2,160. The broader EMAs backdrop is negative, with the 50-day, 100-day and 200-day averages all well above the current trading level, framing the current advance as a corrective phase within a larger downtrend.
Momentum has faded after the mid-March push toward the Fibonacci 38.2% retracement at $2,380, with the RSI on the daily chart back near 50 and the MACD slipping further below its signal line in slightly positive territory, suggesting waning upside pressure inside the channel.
Initial resistance sits at the channel top and recent high in the $2,140–$2,150 area, followed by the 50-day EMA near $2,160. A daily close above there would expose the 38.2% retracement of the $1,748–$3,403 slide at $2,380 as the next upside objective.
On the downside, immediate support stands near $2,000, ahead of the broken midpoint at $1,950. Further weakness and a close below this level could extend the decline toward the channel floor aligning closer to $1,750 as a more strategic support zone if selling pressure extends.
XRP finds support at the key horizontal support at $1.30
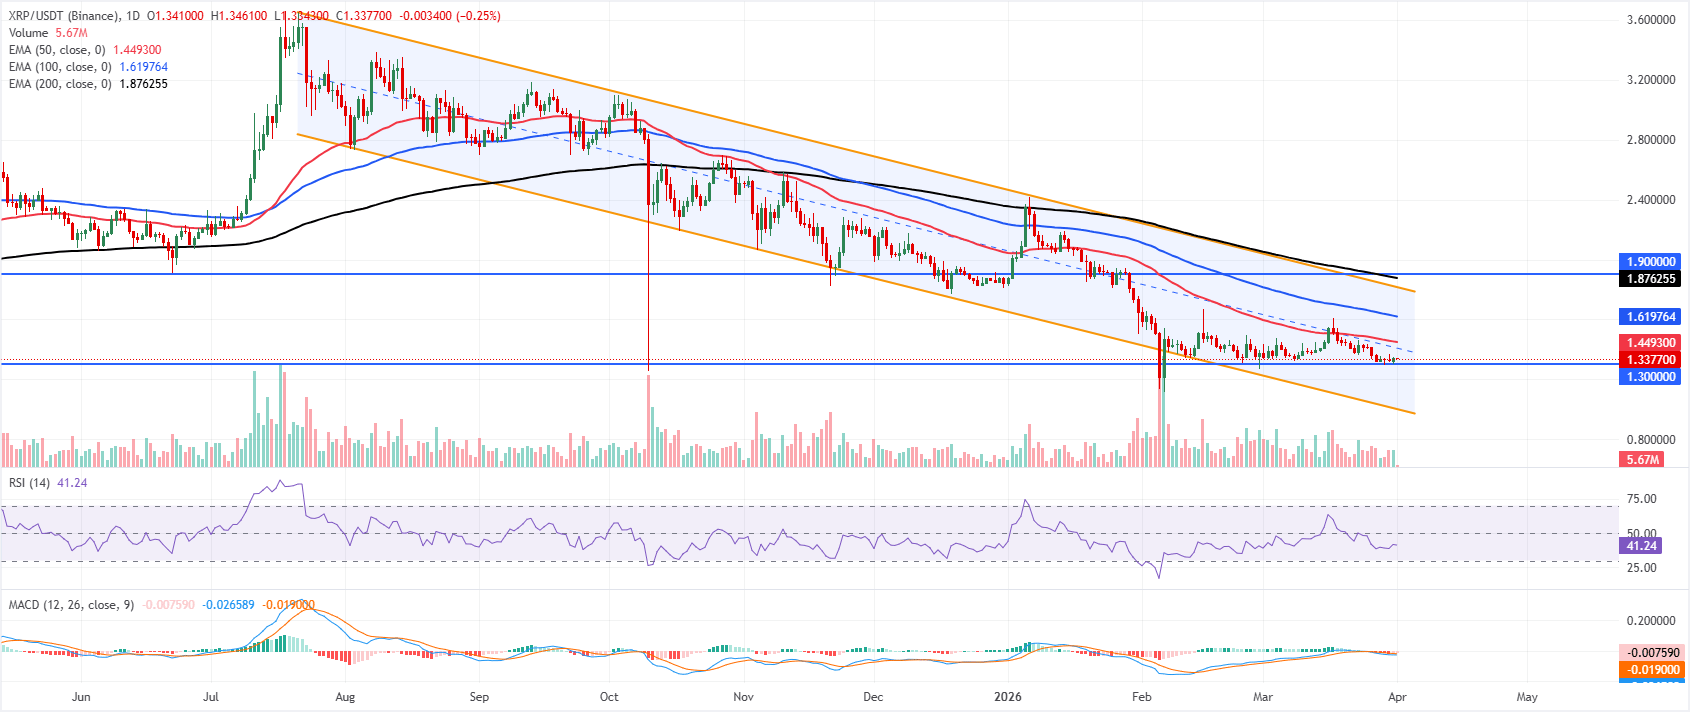
XRP price is trading at $1.33 on Wednesday. XRP trades within a descending parallel channel, with its upper boundary near $1.81 continuing to cap the broader structure, keeping the near-term bias bearish despite the latest stabilization above $1.30. Price remains entrenched below the 50-day, 100-day and 200-day EMAs, which all trend well above the current trading level and frame a persistent downside context.
The RSI on the daily chart hovers near 41, reflecting subdued momentum and reinforcing seller control, while the MACD line remains marginally below the signal line near the zero mark, suggesting weak, fading bullish attempts within the broader downtrend.
Immediate support aligns at the horizontal line near $1.30, which protects the lower half of the channel and, if broken, would expose the channel’s base close to $1.00 as the next bearish objective. Below that area, downside pressure would deepen within the longer-term decline.
On the upside, initial resistance emerges at the mid-channel region around $1.45, where prior swing highs cluster, followed by stronger resistance toward $1.81 at the upper channel boundary. A daily close above this upper band would be needed to negate the prevailing bearish bias and open the way toward the higher static resistance at $1.90.
(The technical analysis of this story was written with the help of an AI tool.)
Cryptocurrency prices FAQs
Token launches influence demand and adoption among market participants. Listings on crypto exchanges deepen the liquidity for an asset and add new participants to an asset’s network. This is typically bullish for a digital asset.
A hack is an event in which an attacker captures a large volume of the asset from a DeFi bridge or hot wallet of an exchange or any other crypto platform via exploits, bugs or other methods. The exploiter then transfers these tokens out of the exchange platforms to ultimately sell or swap the assets for other cryptocurrencies or stablecoins. Such events often involve an en masse panic triggering a sell-off in the affected assets.
Macroeconomic events like the US Federal Reserve’s decision on interest rates influence crypto assets mainly through the direct impact they have on the US Dollar. An increase in interest rate typically negatively influences Bitcoin and altcoin prices, and vice versa. If the US Dollar index declines, risk assets and associated leverage for trading gets cheaper, in turn driving crypto prices higher.
Halvings are typically considered bullish events as they slash the block reward in half for miners, constricting the supply of the asset. At consistent demand if the supply reduces, the asset’s price climbs.

Plus d’un million d’utilisateurs se tournent vers FXStreet pour des données de marché en temps réel, des outils de graphiques, des analyses d’experts et des actualités Forex. Leur calendrier économique complet et leurs webinaires éducatifs aident les traders à rester informés et à prendre des décisions éclairées. FXStreet s’appuie sur une équipe d’environ 60 professionnels répartis entre le siège de Barcelone et diverses régions du monde.
Lire la suite


