
Top 3 Price Prediction: Bitcoin, Ethereum, Ripple – BTC, ETH and XRP face downside risk as bears regain control
Par Manish Chhetri
Date de publication: 18 Feb 2026 | Date de modification: 18 Feb 2026


ARTICLES POPULAIRES

Bitcoin (BTC), Ethereum (ETH), and Ripple (XRP) remain under pressure on Wednesday, with the broader trend still sideways. BTC is edging below $68,000, nearing the lower consolidating boundary, while ETH and XRP also declined slightly, approaching their key supports.
- Bitcoin continues to edge lower on Wednesday, extending consolidation in a trading range for over 11 days.
- Etherum trades sideways between $1,700 and $2,150, signaling indecision among traders.
- XRP hovers at $1.47, finding support at the lower trendline boundary, close below suggests a correction ahead.
Bitcoin (BTC), Ethereum (ETH), and Ripple (XRP) remain under pressure on Wednesday, with the broader trend still sideways. BTC is edging below $68,000, nearing the lower consolidating boundary, while ETH and XRP also declined slightly, approaching their key supports. The price action of the top three cryptocurrencies could face downside risk as bears regain control of momentum.
Bitcoin could extend the fall if it closes below the lower consolidation boundary
Bitcoin price has been consolidating in a range between $65,729 and $71,746 since February 7. BTC declined 2% so far this week and, as of Wednesday, is trading below $68,000, approaching the lower consolidation boundary.
If BTC closes below the lower consolidation level at $65,729, it could extend the decline toward the key support level at $60,000.
The Relative Strength Index (RSI) on the daily chart reads 34, below the neutral level of 50 and pointing downward toward the oversold levels, indicating bearish momentum gaining traction. However, the Moving Average Convergence Divergence (MACD) showed a bullish crossover on Sunday, which remains in place, suggesting that upside bias has not been invalidated yet.
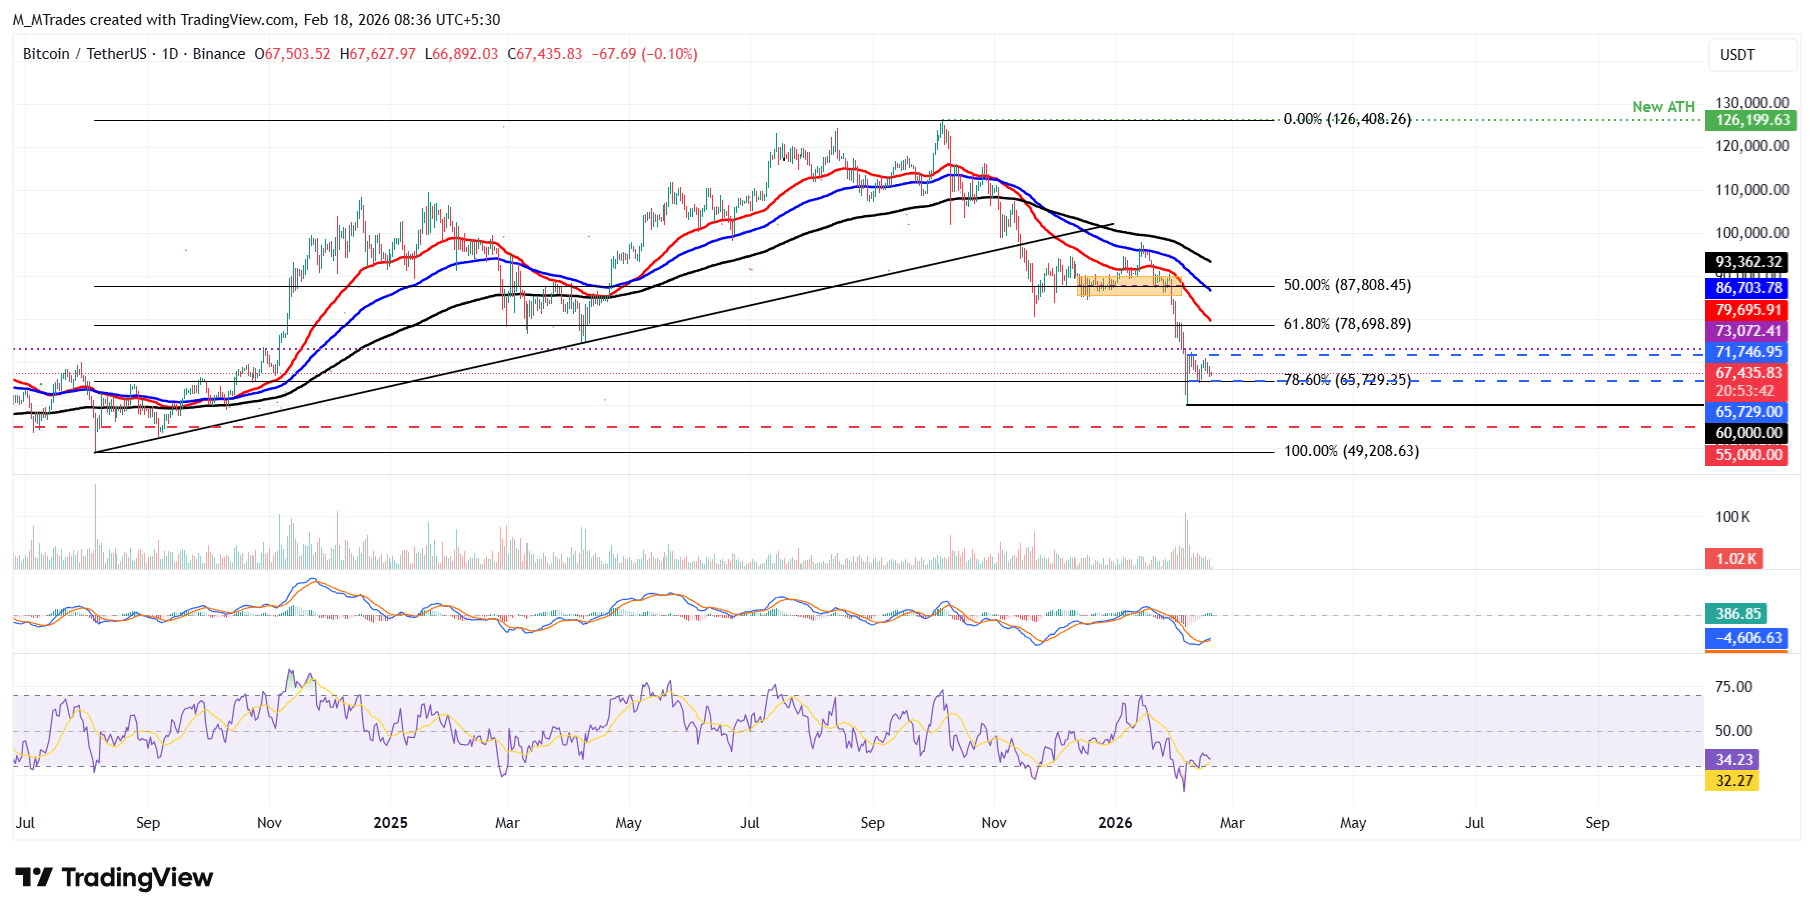
On the other hand, if BTC breaks above the upper consolidation range at $71,746, it could extend the recovery toward the daily resistance at $73,072.
Ethereum declines after revisiting its key resistance zone
Ethereum price was rejected near the upper consolidation range at $2,149 on Sunday and declined by 5.75% that day. ETH has been hovering around the $2,000 level for the past two days and, as of Wednesday, remains there.
If ETH experiences a correction, it could extend to the lower consolidation range at $1,747.
Like Bitcoin, Ethereum’s RSI shows bearish momentum gaining traction. At the same time, the MACD indicator printed a bullish crossover on Saturday that remains intact, suggesting the broader upside bias has not yet been invalidated.
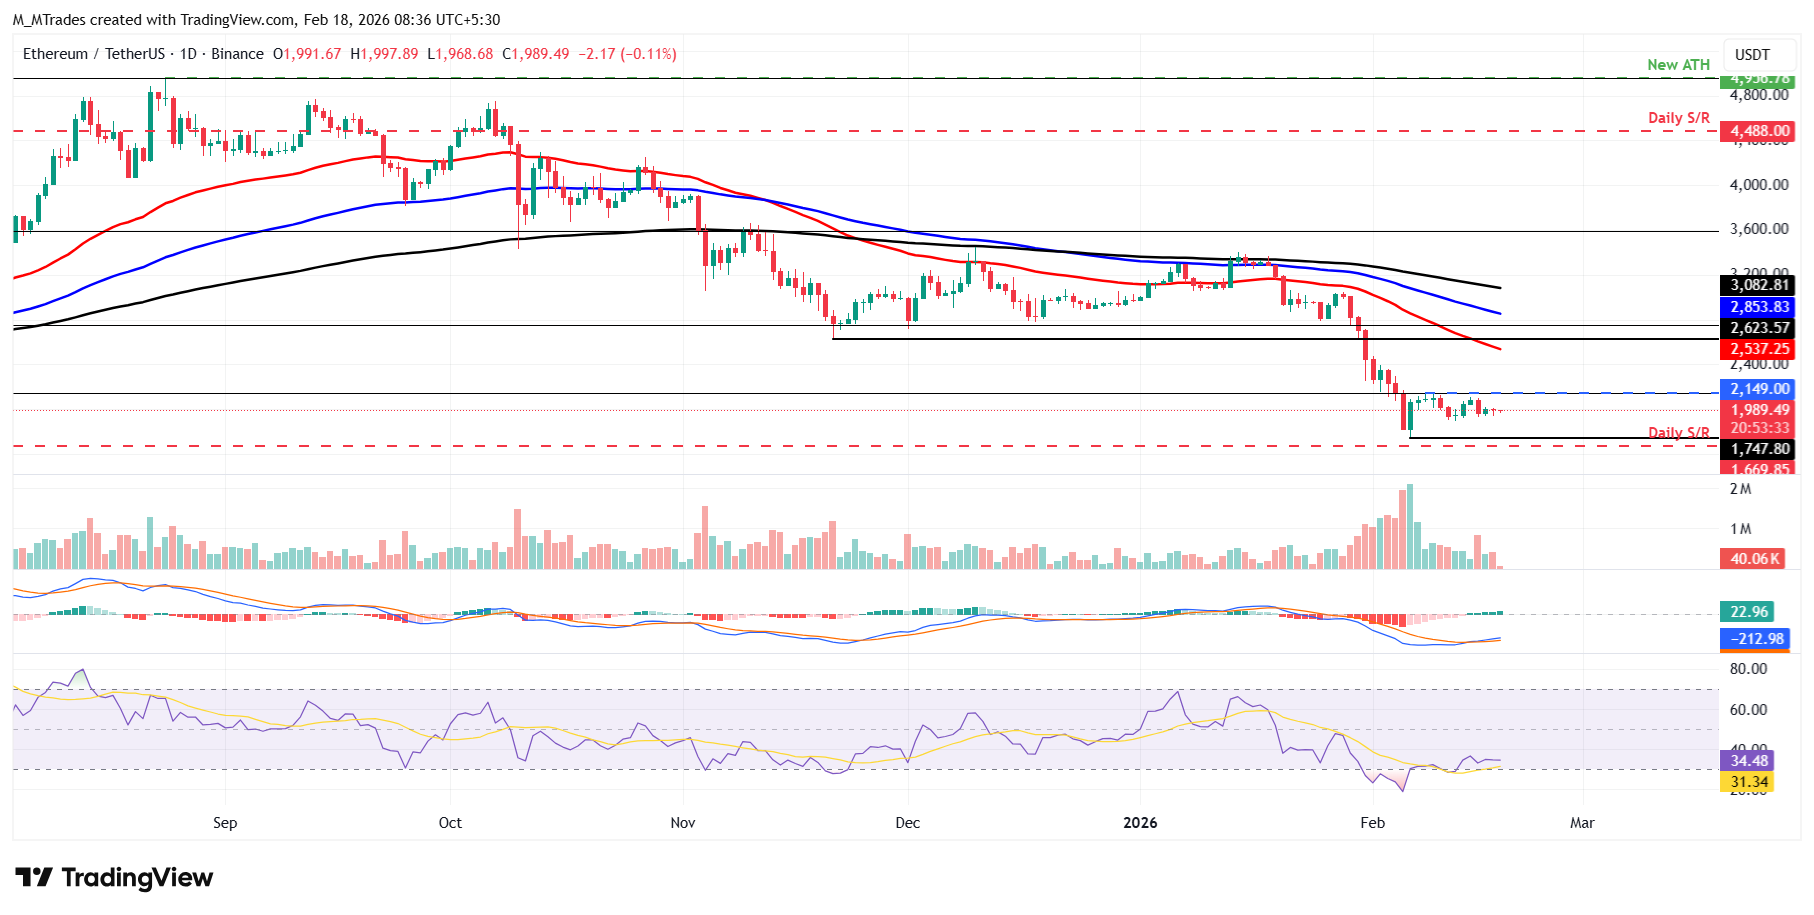
However, if ETH closes above the upper consolidation range at $2,149, it could extend the recovery toward the next key resistance at $2,400.
XRP finds support around the lower trendline boundary
XRP broke above the lower trendline boundary of a falling wedge on Saturday and declined slightly the next day, finding support around it. XRP has stabilized around this trendline so far this week. As of Wednesday, XRP trades at $1.47.
If XRP slips and closes below the lower trendline, it could extend the decline toward the weekly support at $1.30.
Like Bitcoin and Ethereum, XRP’s momentum indicators remain conflicted, with RSI pointing to building bearish pressure while the MACD continues to signal underlying bullish momentum.
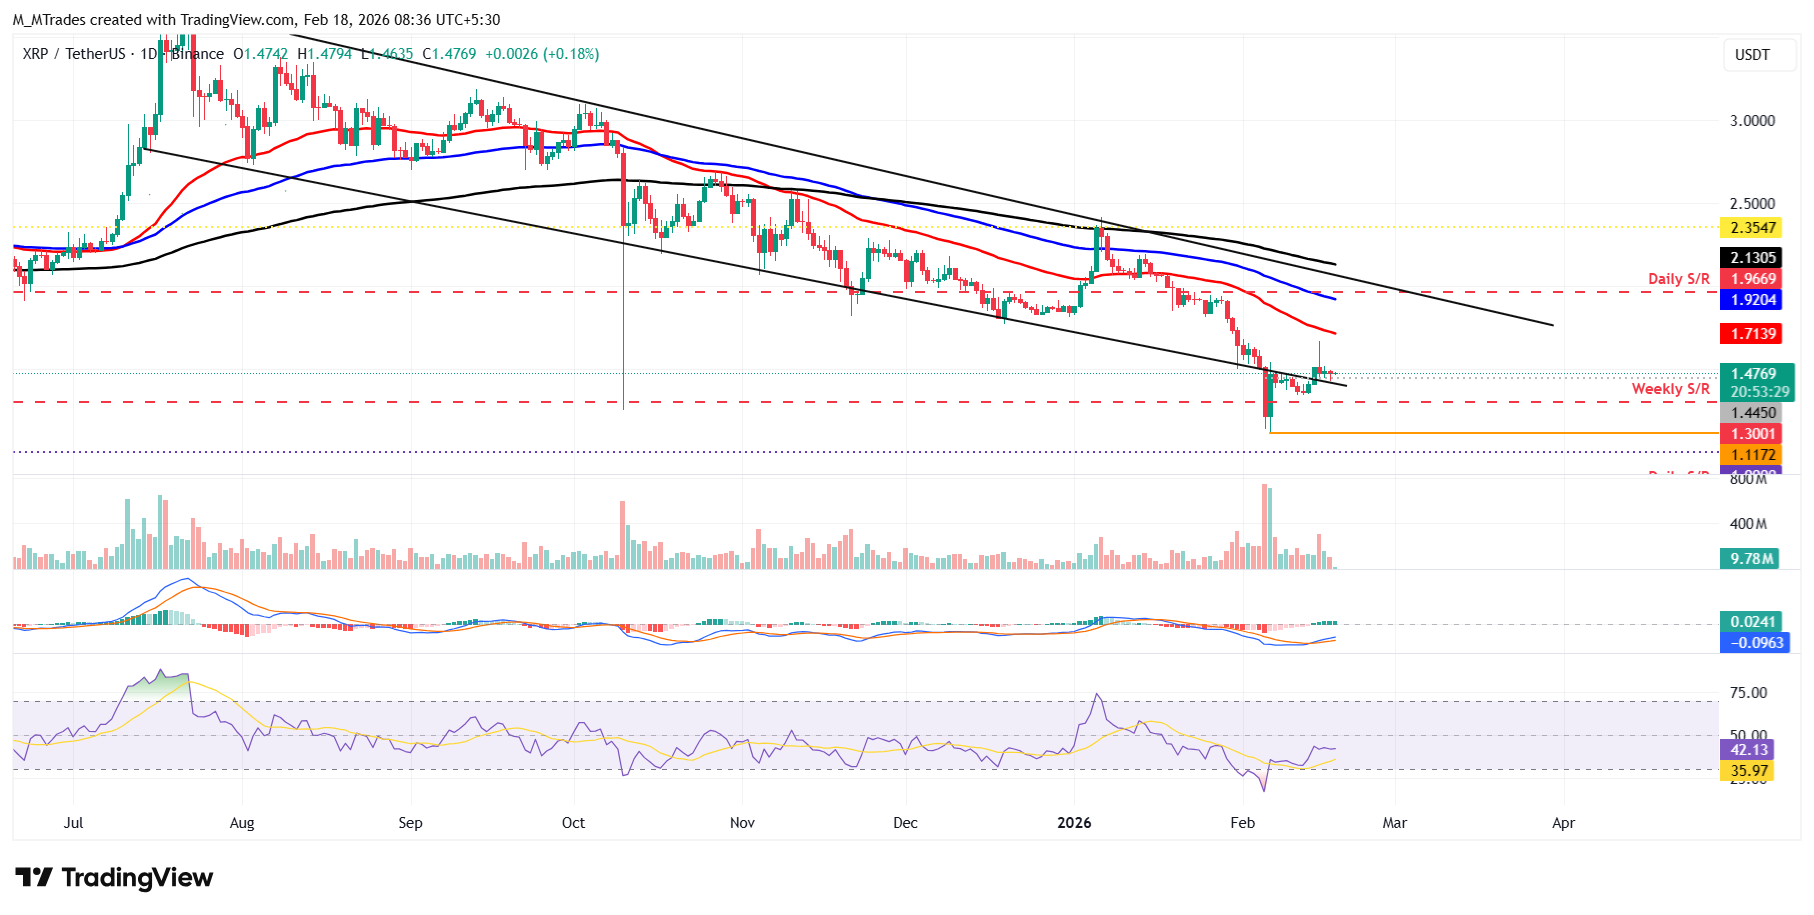
Conversely, if the lower trendline boundary holds as support, it could extend the recovery toward the 50-day Exponential Moving Average (EMA) at $1.71.
Cryptocurrency metrics FAQs
The developer or creator of each cryptocurrency decides on the total number of tokens that can be minted or issued. Only a certain number of these assets can be minted by mining, staking or other mechanisms. This is defined by the algorithm of the underlying blockchain technology. On the other hand, circulating supply can also be decreased via actions such as burning tokens, or mistakenly sending assets to addresses of other incompatible blockchains.
Market capitalization is the result of multiplying the circulating supply of a certain asset by the asset’s current market value.
Trading volume refers to the total number of tokens for a specific asset that has been transacted or exchanged between buyers and sellers within set trading hours, for example, 24 hours. It is used to gauge market sentiment, this metric combines all volumes on centralized exchanges and decentralized exchanges. Increasing trading volume often denotes the demand for a certain asset as more people are buying and selling the cryptocurrency.
Funding rates are a concept designed to encourage traders to take positions and ensure perpetual contract prices match spot markets. It defines a mechanism by exchanges to ensure that future prices and index prices periodic payments regularly converge. When the funding rate is positive, the price of the perpetual contract is higher than the mark price. This means traders who are bullish and have opened long positions pay traders who are in short positions. On the other hand, a negative funding rate means perpetual prices are below the mark price, and hence traders with short positions pay traders who have opened long positions.

Plus d’un million d’utilisateurs se tournent vers FXStreet pour des données de marché en temps réel, des outils de graphiques, des analyses d’experts et des actualités Forex. Leur calendrier économique complet et leurs webinaires éducatifs aident les traders à rester informés et à prendre des décisions éclairées. FXStreet s’appuie sur une équipe d’environ 60 professionnels répartis entre le siège de Barcelone et diverses régions du monde.
Lire la suite


