
Top 3 Price Prediction: Bitcoin, Ethereum, Ripple – BTC, ETH and XRP stay weak as bearish momentum persists
Par Manish Chhetri
Date de publication: 13 Feb 2026 | Date de modification: 13 Feb 2026


ARTICLES POPULAIRES

Bitcoin (BTC), Ethereum (ETH) and Ripple (XRP) remain under pressure, extending losses of over 5%, 6% and 4%, respectively, so far this week. BTC trades below $67,000 while ETH and XRP correct after facing rejection around key levels.
- Bitcoin price nears the key support at $65,520, a break below suggests a correction toward the $60,000 low.
- Ethereum extends its correction after failing to close above key resistance at $2,149.
- XRP continues sliding down after facing resistance around the lower trendline boundary.
Bitcoin (BTC), Ethereum (ETH) and Ripple (XRP) remain under pressure, extending losses of over 5%, 6% and 4%, respectively, so far this week. BTC trades below $67,000 while ETH and XRP correct after facing rejection around key levels. With bearish momentum persisting and prices staying weak, the top three cryptocurrencies continue to show no clear signs of a sustained recovery.
Bitcoin could extend its decline if it closes below $65,500
Bitcoin price was rejected near the daily resistance level at $73,072 on Sunday and posted four consecutive red candlesticks, declining 5.5% through Thursday. At the time of writing on Friday, BTC is trading at around $66,500.
If BTC breaks and closes the 78.6% Fibonacci retracement (drawn from the August 2024 low of $49,000 to the October 2025 all-time high of $126,199) at $65,520, it could extend the decline toward the February 6 low at $60,000.
The Relative Strength Index (RSI) on the daily chart is at 30, pointing downward toward the oversold territory, suggesting bearish momentum is gaining traction. In addition, the Moving Average Convergence Divergence (MACD) in the same period shows a bearish crossover, suggesting a continuation of the downward trend.
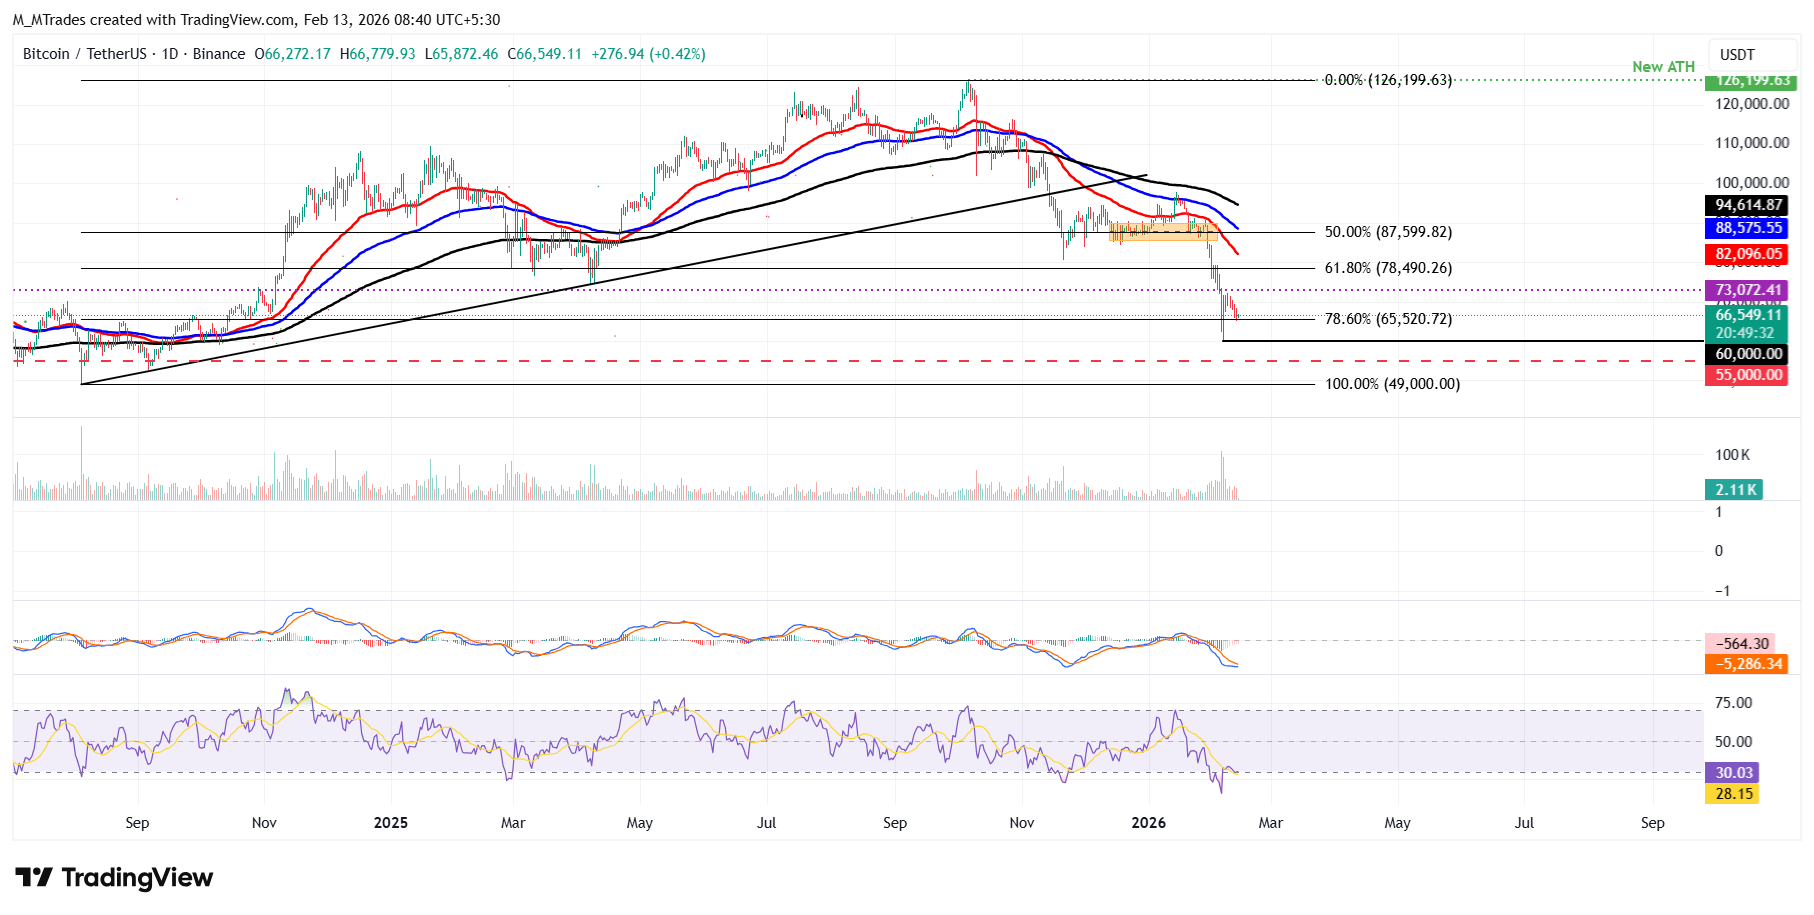
On the contrary, if BTC recovers, it could extend the advance toward the daily resistance at $73,072.
Ethereum corrects after failing to close above key resistance
Ethereum retested and was rejected by the 78.6% Fibonacci retracement level at $2,149 on Monday, and declined nearly 8% through Wednesday. As of writing on Friday, ETH is trading at $1,949.
If ETH continues its downward trend, it could extend the decline toward the February 6 low at $1,747.
Like Bitcoin, Ethereum’s RSI and MACD also support a bearish outlook.
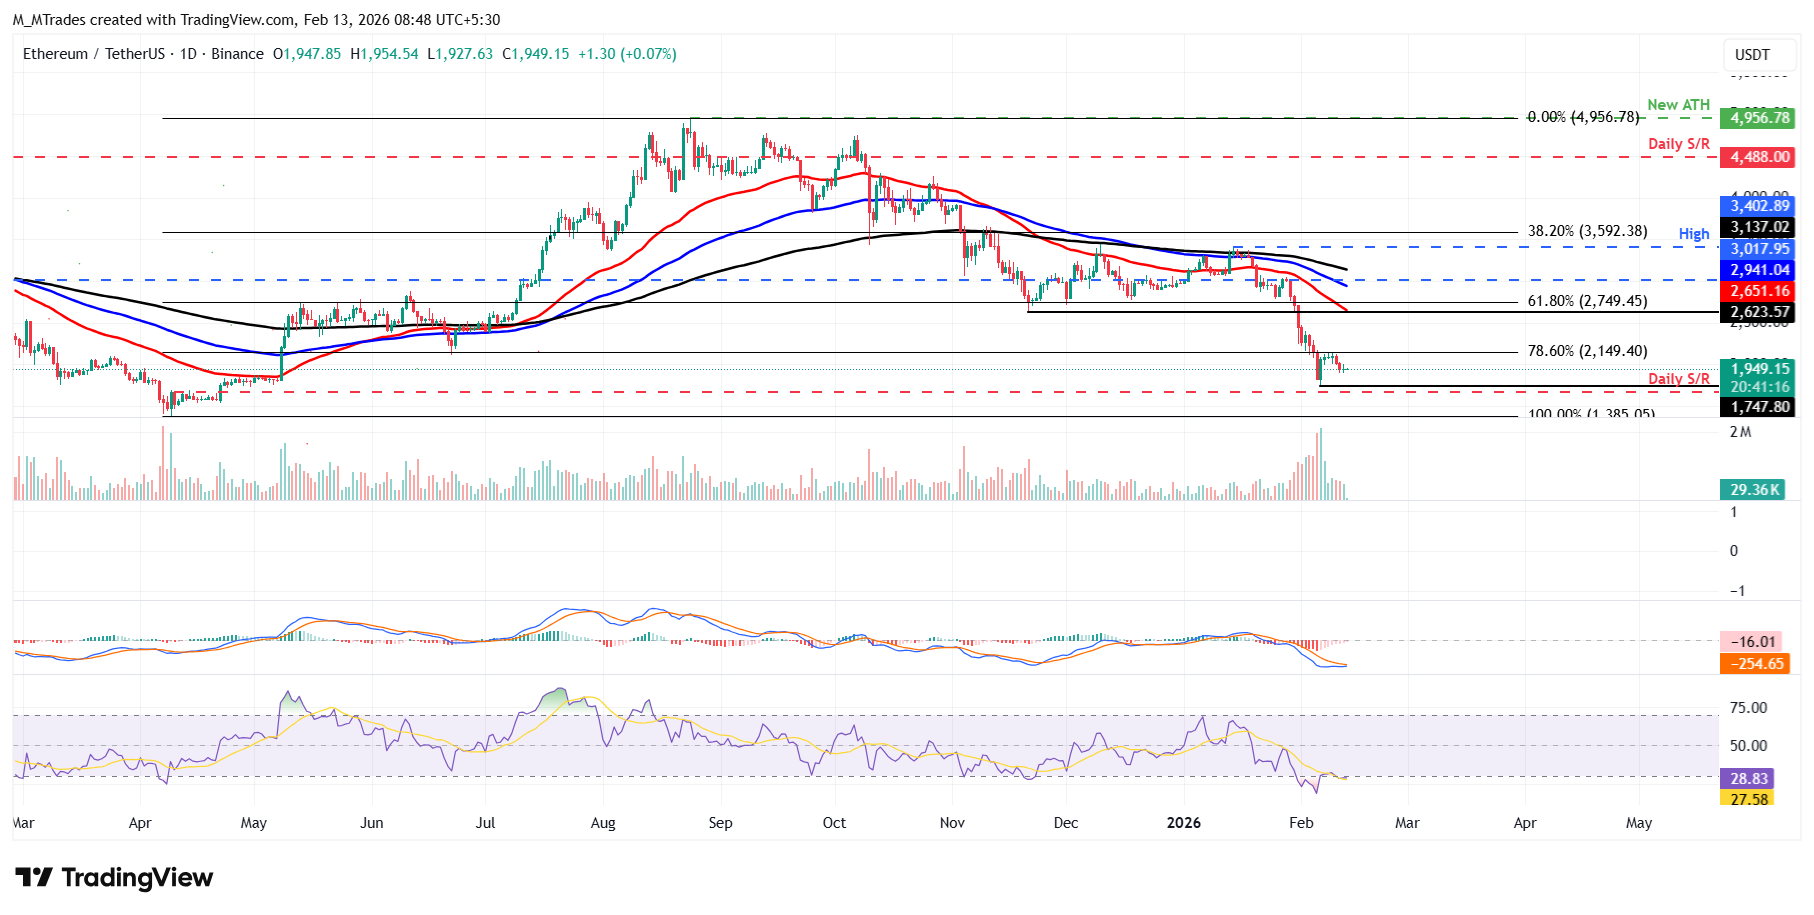
However, if ETH breaks and closes above $2,149 on a daily basis, it could extend the advance toward the next resistance at $2,500.
XRP faces a correction after struggling to break above the key resistance
XRP revisited the broken trendline boundary of a falling wedge on February 6 and has been facing rejection around that level, declining 7% through Thursday. As of Friday, XRP is trading below $1.36.
If XRP continues its downward trend, it could extend the decline toward the weekly support at $1.30.
Like Ethereum, XRP’s momentum indicators (RSI and MACD) are also projecting a bearish outlook.
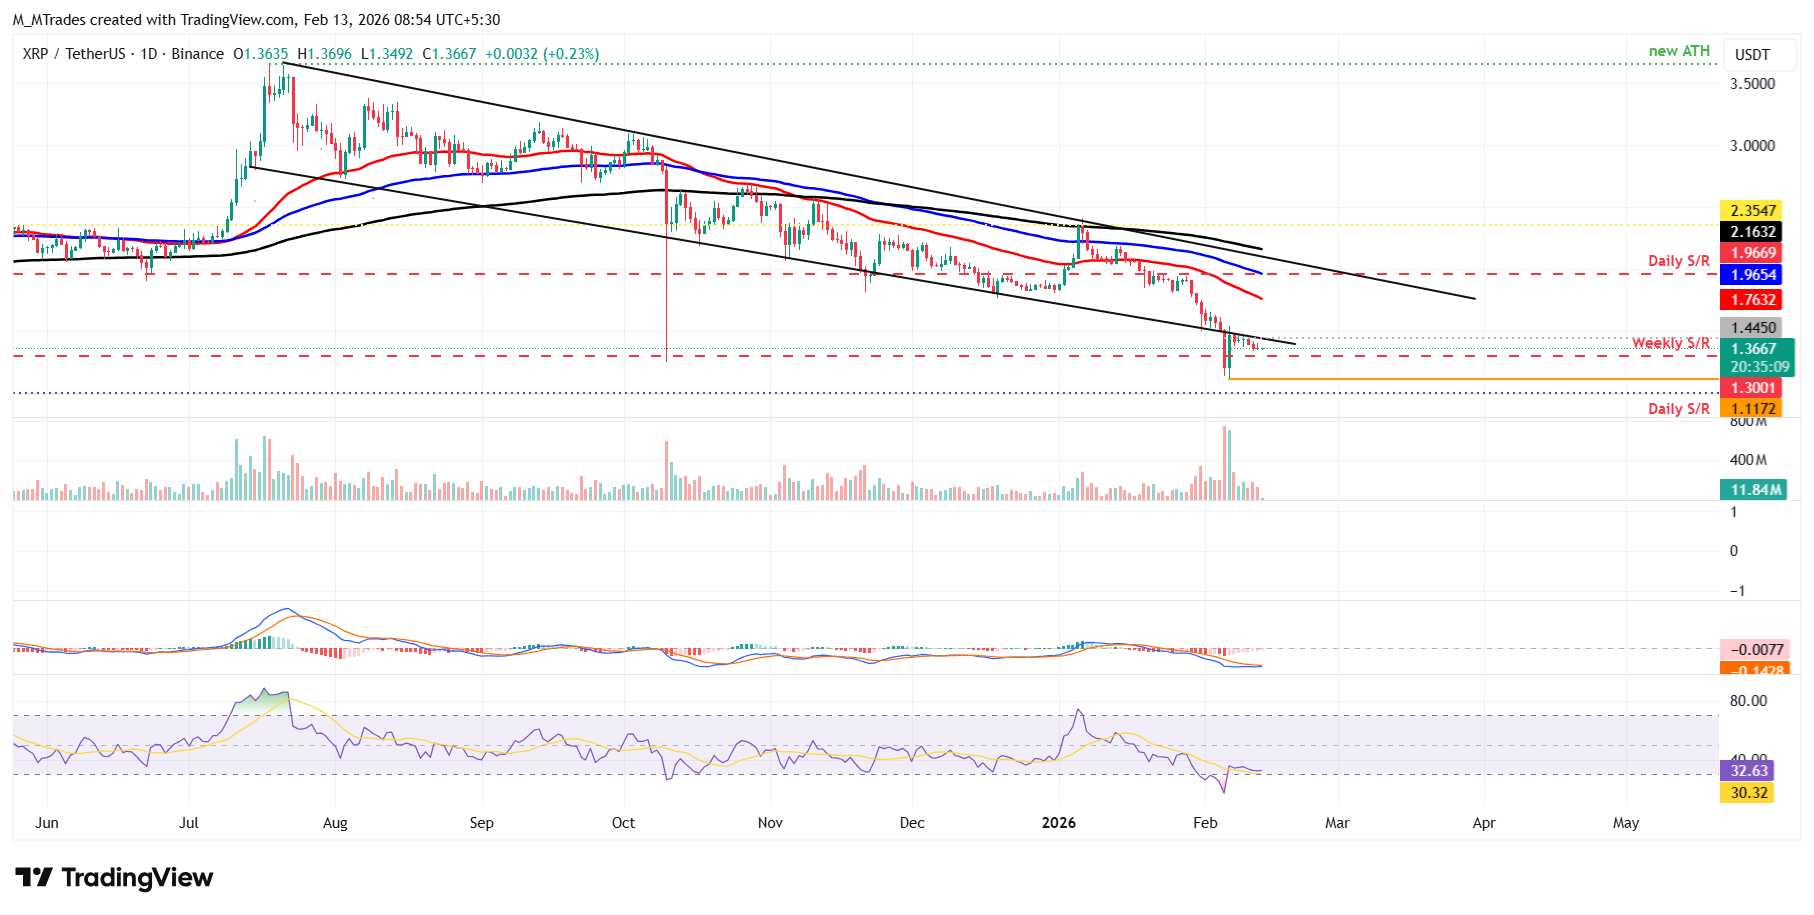
If XRP breaks and closes above the lower boundary of this pattern, it could extend the rally toward the 50-day Exponential Moving Average at $1.79.
Cryptocurrency metrics FAQs
The developer or creator of each cryptocurrency decides on the total number of tokens that can be minted or issued. Only a certain number of these assets can be minted by mining, staking or other mechanisms. This is defined by the algorithm of the underlying blockchain technology. On the other hand, circulating supply can also be decreased via actions such as burning tokens, or mistakenly sending assets to addresses of other incompatible blockchains.
Market capitalization is the result of multiplying the circulating supply of a certain asset by the asset’s current market value.
Trading volume refers to the total number of tokens for a specific asset that has been transacted or exchanged between buyers and sellers within set trading hours, for example, 24 hours. It is used to gauge market sentiment, this metric combines all volumes on centralized exchanges and decentralized exchanges. Increasing trading volume often denotes the demand for a certain asset as more people are buying and selling the cryptocurrency.
Funding rates are a concept designed to encourage traders to take positions and ensure perpetual contract prices match spot markets. It defines a mechanism by exchanges to ensure that future prices and index prices periodic payments regularly converge. When the funding rate is positive, the price of the perpetual contract is higher than the mark price. This means traders who are bullish and have opened long positions pay traders who are in short positions. On the other hand, a negative funding rate means perpetual prices are below the mark price, and hence traders with short positions pay traders who have opened long positions.

Plus d’un million d’utilisateurs se tournent vers FXStreet pour des données de marché en temps réel, des outils de graphiques, des analyses d’experts et des actualités Forex. Leur calendrier économique complet et leurs webinaires éducatifs aident les traders à rester informés et à prendre des décisions éclairées. FXStreet s’appuie sur une équipe d’environ 60 professionnels répartis entre le siège de Barcelone et diverses régions du monde.
Lire la suite


