
Top Crypto Gainers: WLFI, ATOM, and JUP post mild gains amid market sell-off
Par Vishal Dixit
Date de publication: 4 Feb 2026 | Date de modification: 4 Feb 2026


ARTICLES POPULAIRES

World Liberty Financial (WLFI), Cosmos (ATOM), and Jupiter (JUP) posted a mild recovery on Tuesday, defying the broader cryptocurrency market-wide sell-off. However, the technical outlook for WLFI and ATOM remains mixed as short-term recovery challenges the prevailing bearish momentum.
- World Liberty Financial hovers above $0.1300 on Wednesday after bouncing off 3% from a critical support on Tuesday.
- Cosmos is up 2% on Wednesday, bringing its three-day recovery to over 8%.
- Jupiter extends higher by 8% on Wednesday, building on Tuesday’s 3% gains.
World Liberty Financial (WLFI), Cosmos (ATOM), and Jupiter (JUP) posted a mild recovery on Tuesday, defying the broader cryptocurrency market-wide sell-off. However, the technical outlook for WLFI and ATOM remains mixed as short-term recovery challenges the prevailing bearish momentum.
World Liberty Financial recovers from a crucial support
World Liberty Financial trades above $0.1300 at press time on Wednesday, holding the 3% gains from the previous day. The trend stays vulnerable as WLFI holds beneath the 50-day EMA at $0.1552, with the 200-day EMA at $0.1589 anchoring the broader downtrend.
A sustained recovery in WLFI could be met with resistance from these moving averages.
The Moving Average Convergence Divergence (MACD) and signal line slow the decline below zero as the negative histogram contracts, suggesting fading bearish pressure. The Relative Strength Index (RSI) is at 34, rebounding from the oversold boundary yet still below the neutral 50 mark.
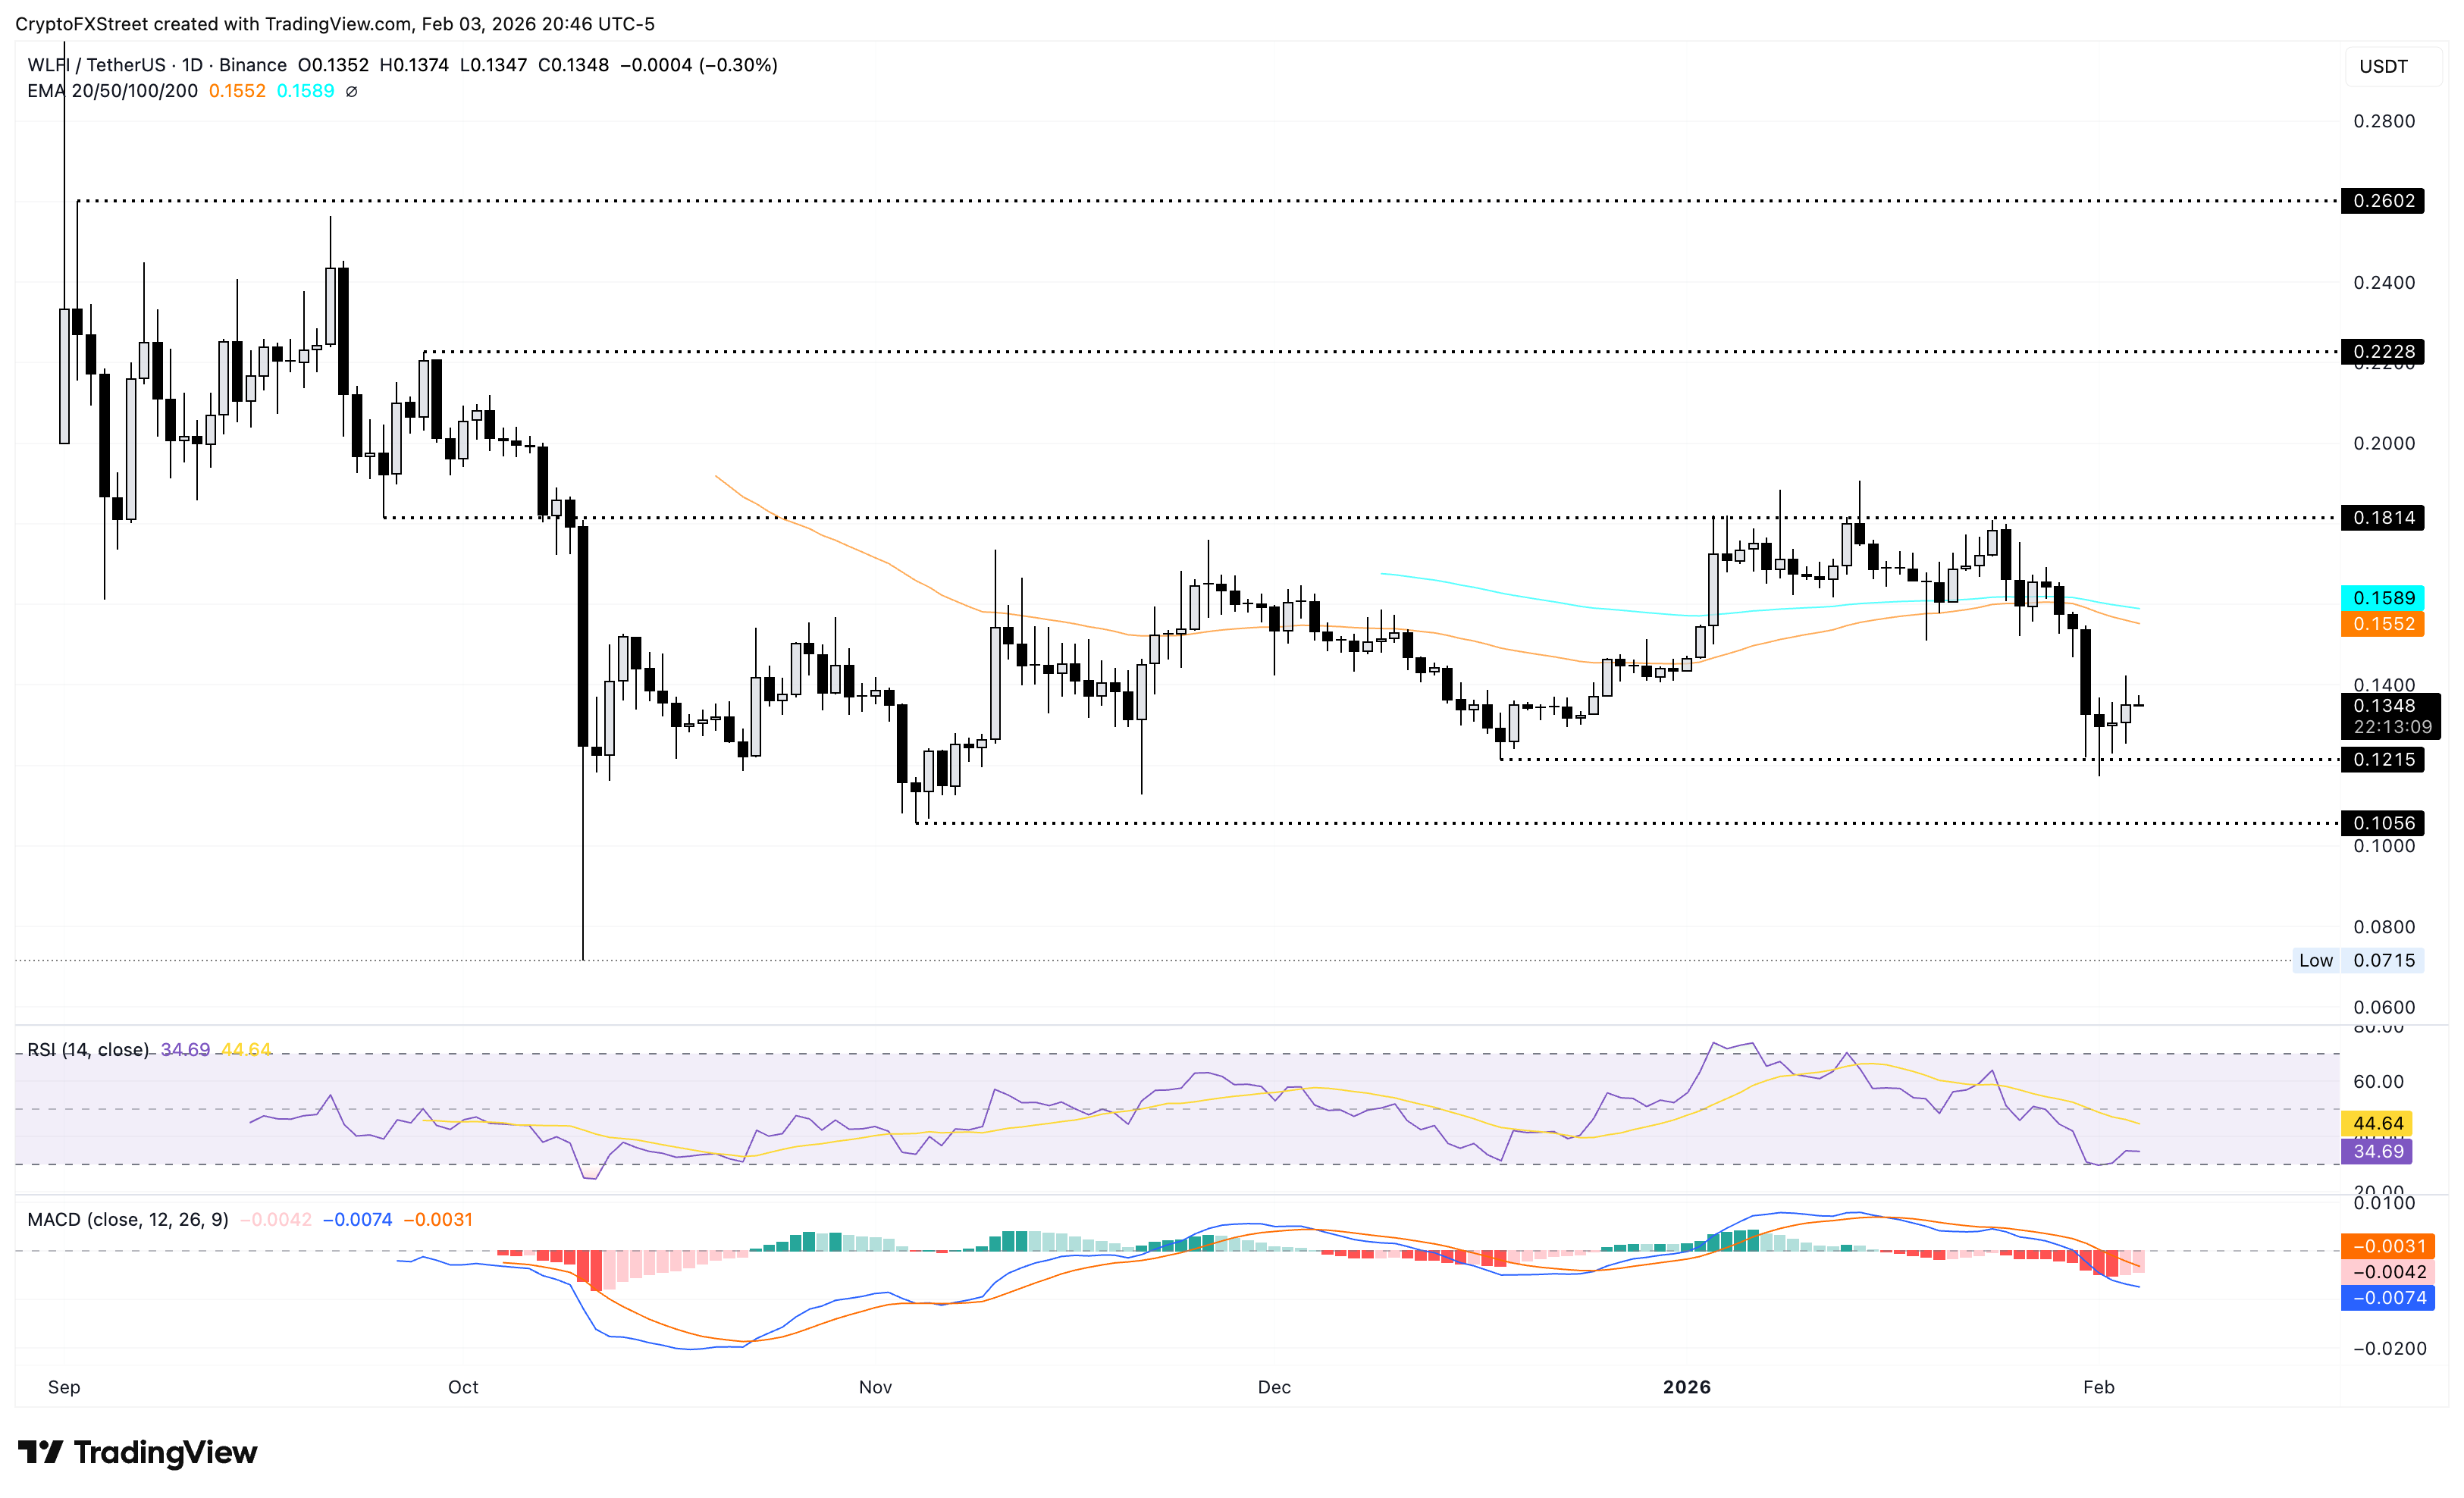
Looking down, if WLFI slips below $0.1215 support, coinciding with the December 18 low, it would risk a further decline to the S1 Pivot Point at $0.1062.
Cosmos extends recovery above $2.00
ATOM trades up 2% at the time of writing on Wednesday, extending its recovery for the third consecutive day, now up over 8%. Still, ATOM holds beneath the declining 50-, 100-, and 200-day EMAs at $2.283, $2.541, and $3.094, respectively. The 50-day EMA is below the 100-day EMA, reinforcing a bearish bias.
A daily close above the 50-day EMA at $2.283 could lift recovery attempts toward the 100-day EMA at $2.541. Failing that, downside pressure would persist, with the EMAs capping the broader trend and keeping rebounds contained.
The MACD line remains below the signal line in negative territory, and the histogram has been contracting toward zero, suggesting fading bearish pressure. The RSI is at 42, signaling a neutral-bearish tone and has turned up, hinting at stabilizing momentum but not yet a reversal.
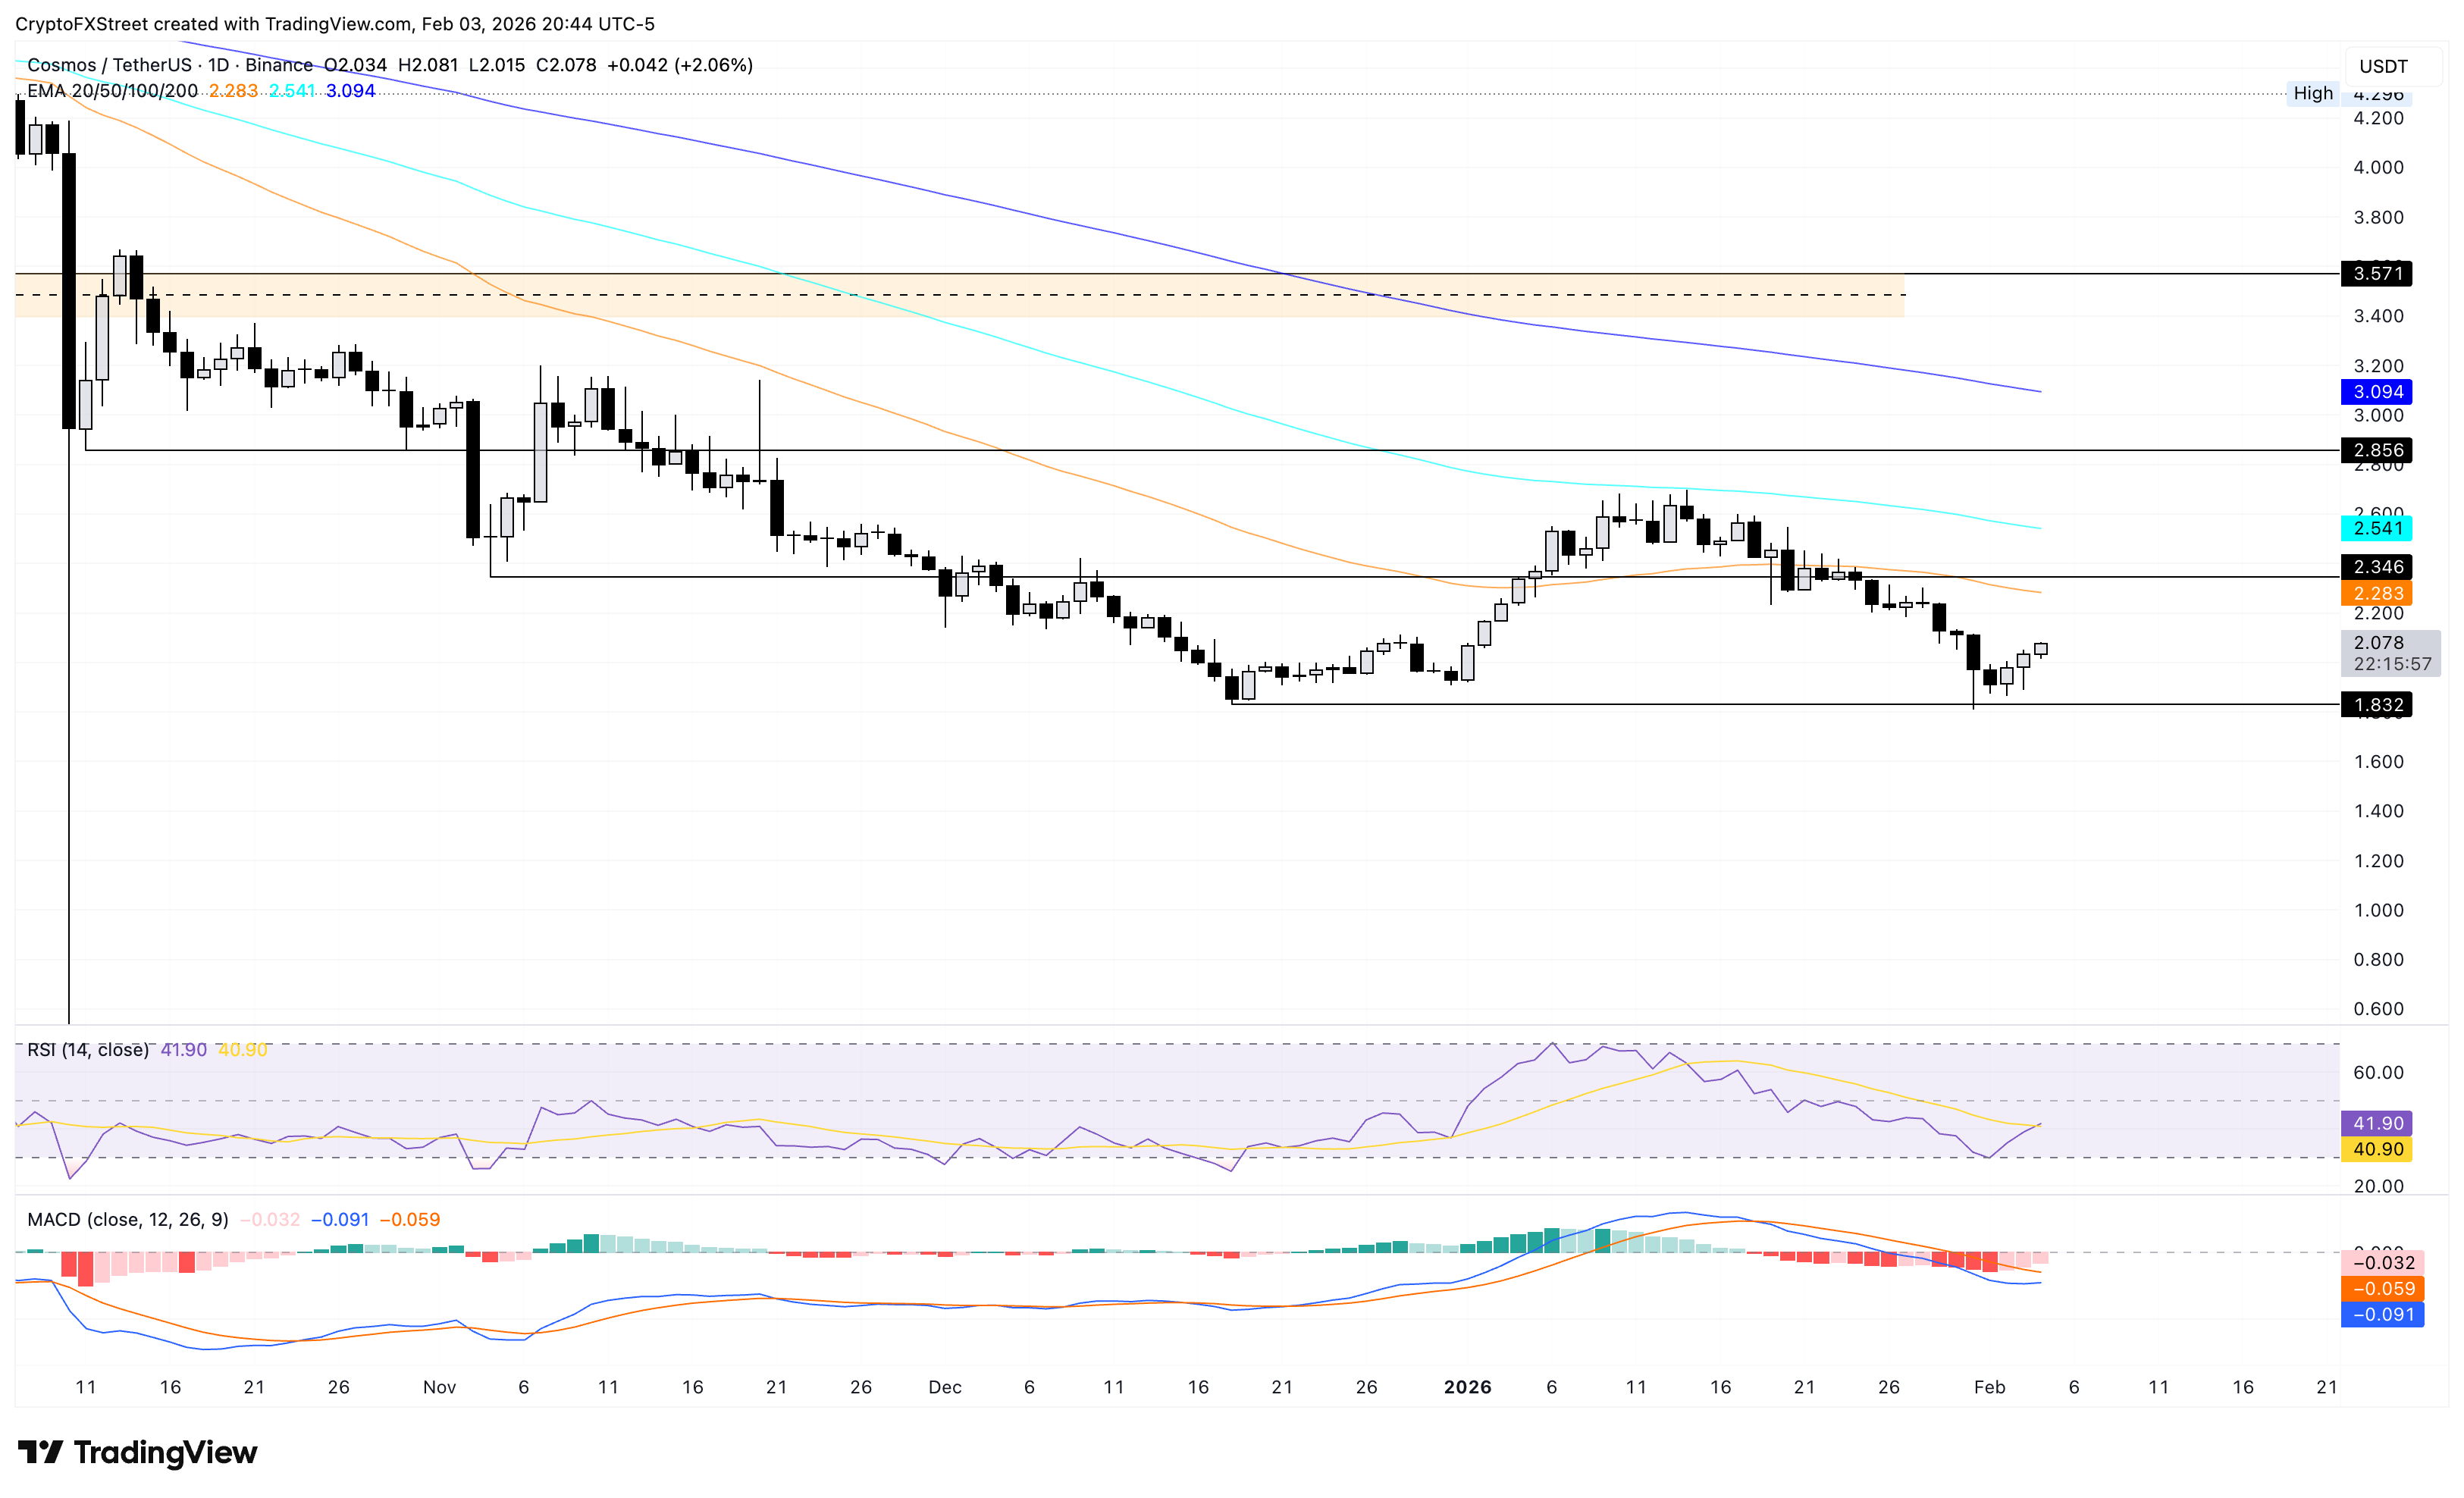
Looking down, ATOM could retest the $1.832 support floor marked by the December 18 lows if overhead pressure increases.
Jupiter attempts to regain bullish momentum
The JUP token trades below the 50-day Exponential Moving Average (EMA) at $2.111, which is capping rebounds and reinforcing a bearish bias. At the time of writing, JUP is up nearly 1% on Wednesday, building on the 3% gains from the previous day.
A daily close above the 50-day EMA at $0.1552 would ease downside pressure and allow a corrective bounce toward the R1 Pivot Point at $0.2299, whereas failure to reclaim it would keep the risk skewed to the downside.
The MACD line remains below the signal line near zero as the shallow negative histogram contracts, suggesting waning bearish pressure, while the RSI at 48 is edging up, hinting at stabilizing momentum.
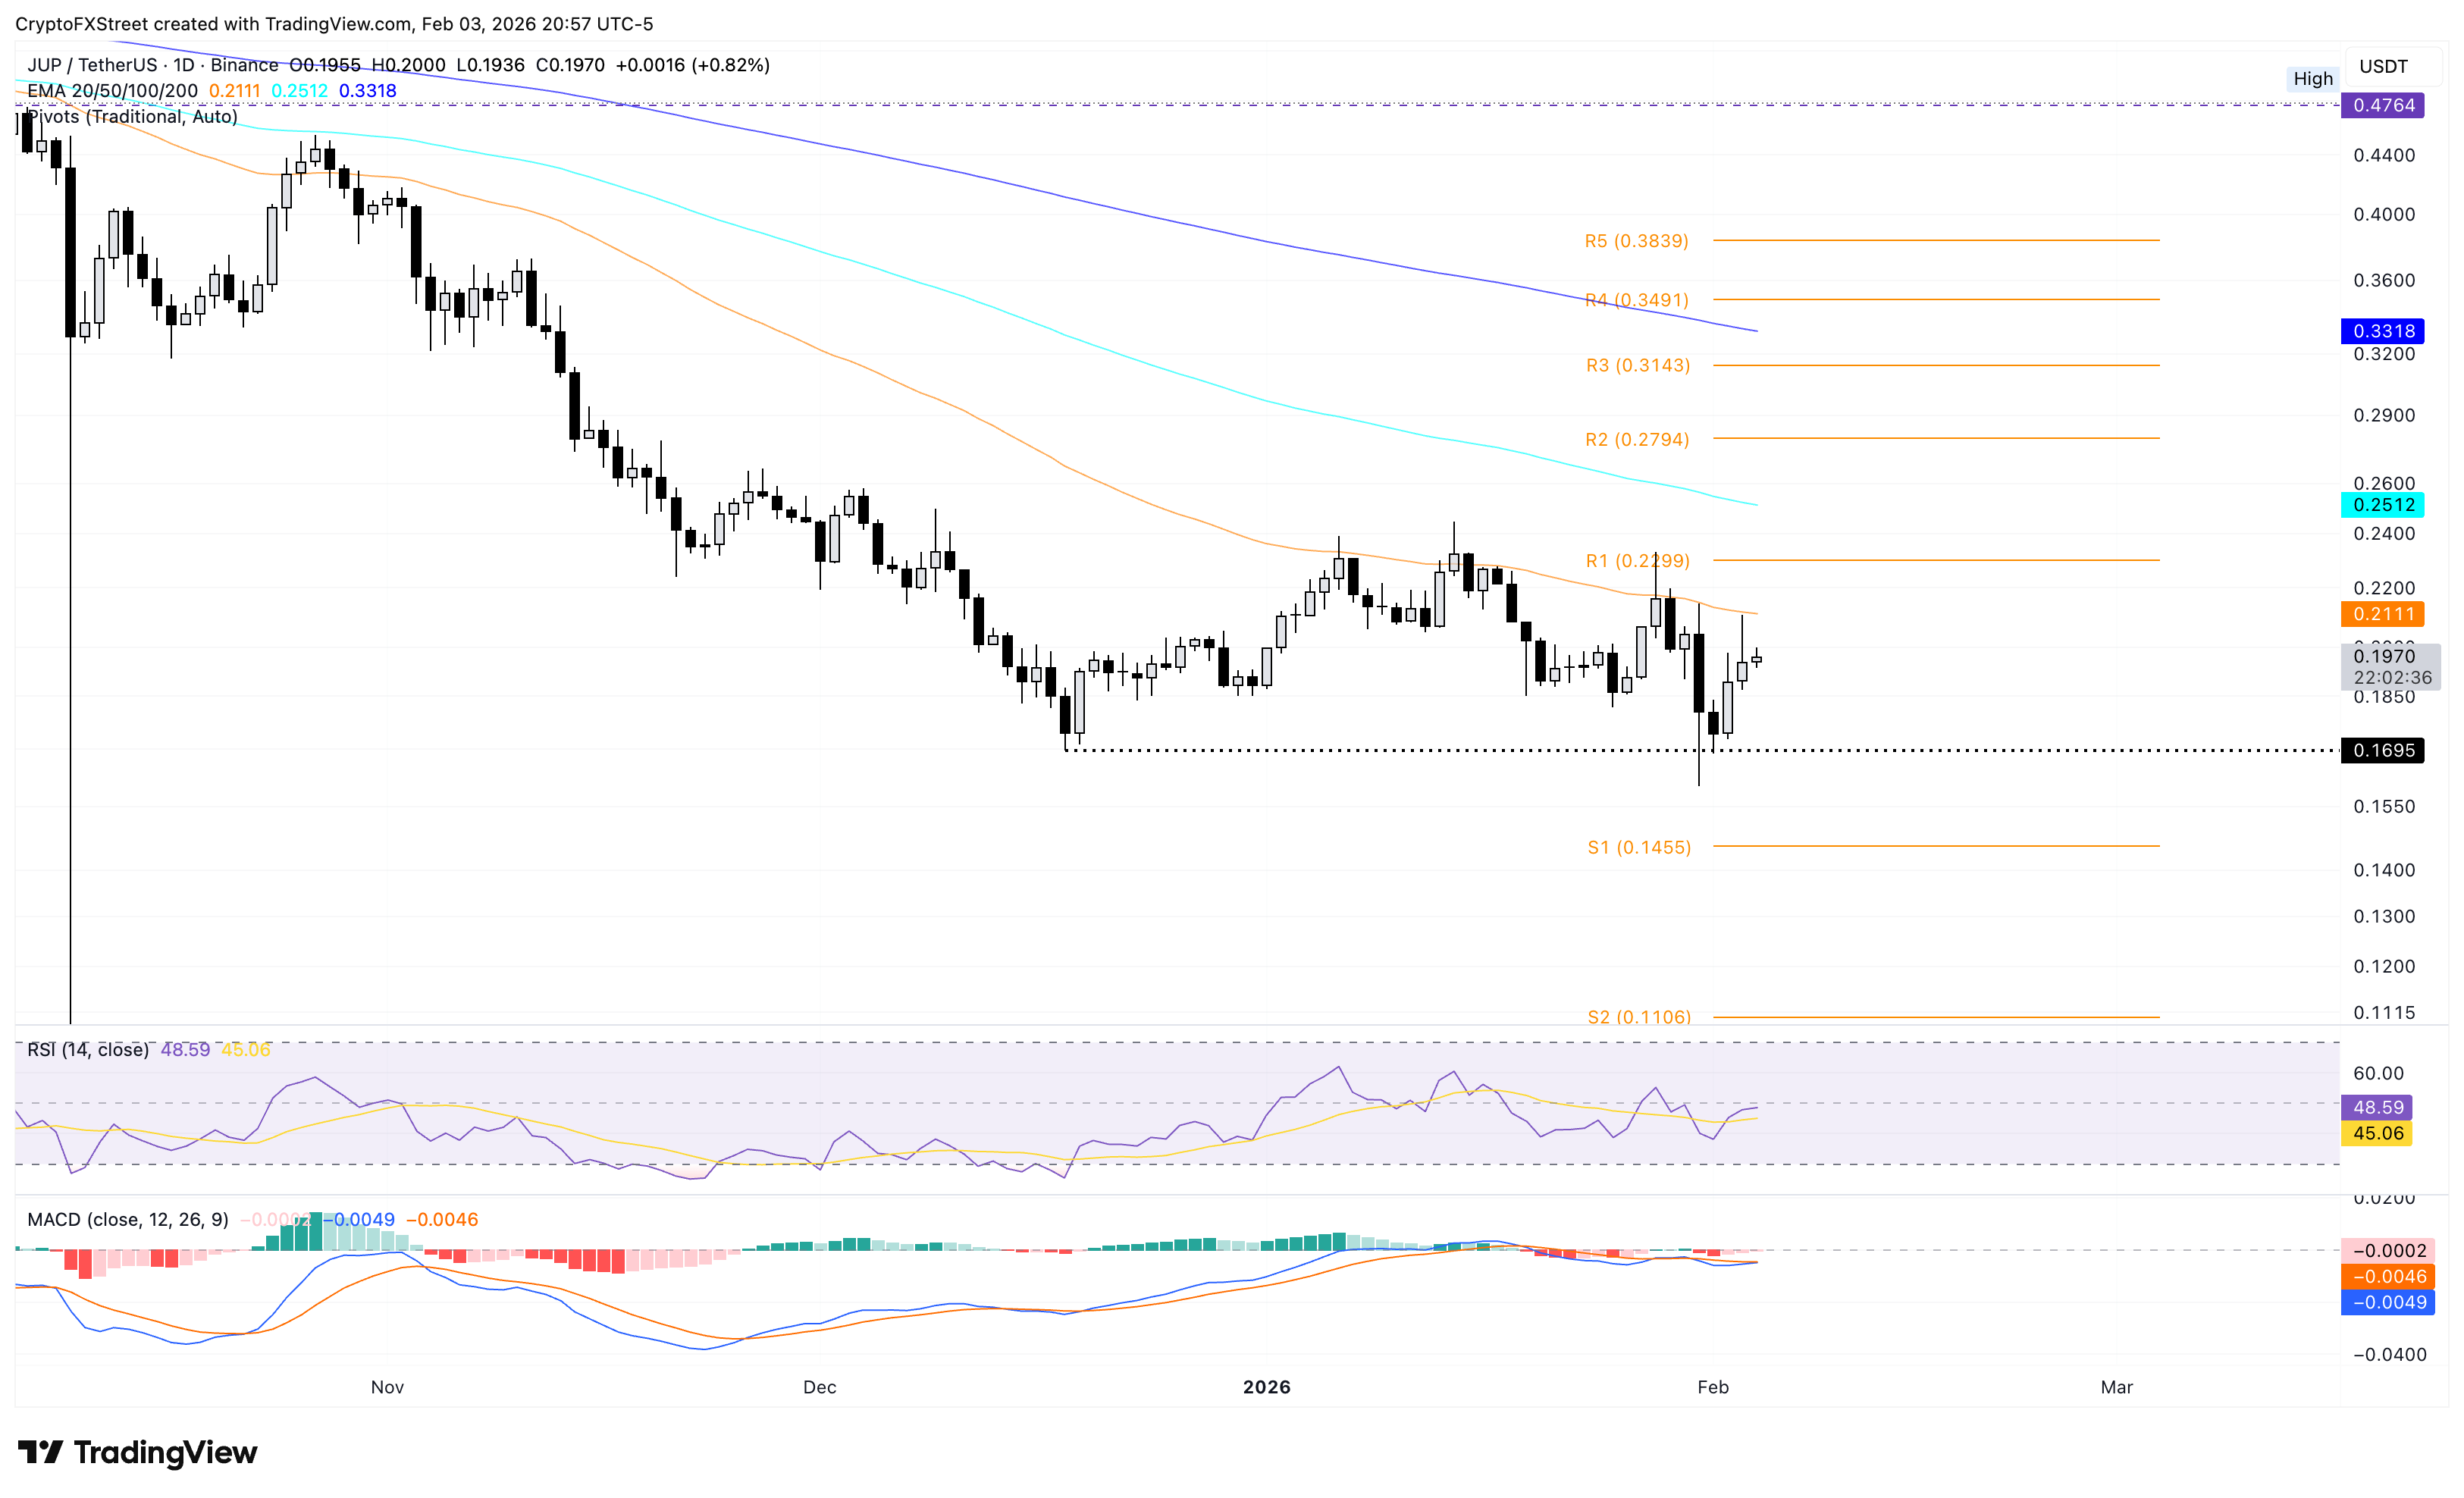
On a pullback, the key support for JUP remains at the December 18 low at $0.1695.
(The technical analysis of this story was written with the help of an AI tool.)

Plus d’un million d’utilisateurs se tournent vers FXStreet pour des données de marché en temps réel, des outils de graphiques, des analyses d’experts et des actualités Forex. Leur calendrier économique complet et leurs webinaires éducatifs aident les traders à rester informés et à prendre des décisions éclairées. FXStreet s’appuie sur une équipe d’environ 60 professionnels répartis entre le siège de Barcelone et diverses régions du monde.
Lire la suite


