
Top Crypto Losers: Pump.fun, SPX6900, Bittensor slide further with double-digit losses
Par Vishal Dixit
Date de publication: 18 Dec 2025 | Date de modification: 18 Dec 2025


ARTICLES POPULAIRES

Pump.fun (PUMP), SPX6900 (SPX), and Bittensor (TAO) are leading the losses in the cryptocurrency market over the last 24 hours amid total liquidations of over $500 million. The retail segment alleges institutional manipulation amid an early-morning Bitcoin sell-off routine in the US market.
- Pump.fun is down 12% in the last 24 hours, risking a bearish breakout of a falling wedge pattern.
- SPX extends losses after a 12% decline on Wednesday, flashing further bearish potential of nearly 8%.
- Bittensor logs a 10% drop over the last 24 hours, marking its fifth consecutive day of losses amid mounting selling pressure.
Pump.fun (PUMP), SPX6900 (SPX), and Bittensor (TAO) are leading the losses in the cryptocurrency market over the last 24 hours amid total liquidations of over $500 million. The retail segment alleges institutional manipulation amid an early-morning Bitcoin sell-off routine in the US market. Additionally, the US CPI data coming on Thursday and the Bank of Japan’s rate hike decision on Friday could further boost volatility in the crypto market.
Technically, the declining trend in PUMP, SPX, and TAO could extend the bearish streak as momentum indicators suggest intense selling pressure.
Pump.fun could fall out of a declining wedge pattern
Pump.fun edges lower by nearly 2% at press time on Thursday, extending the 10% decline from the previous day. The meme coin launchpad token approaches the support trendline connecting the November 17 and 21 lows, part of a falling wedge pattern.
If PUMP marks a decisive close below the S1 Pivot Point at $0.002000, it would confirm the bearish breakout. The declining trend in PUMP could find support at the October 10 low at $0.001496 or the S2 Pivot Point at $0.001051.
The Relative Strength Index (RSI) on the daily chart is at 29, indicating an oversold condition. Meanwhile, the Moving Average Convergence Divergence (MACD) and the signal line descend into the negative direction after a crossover on Monday.
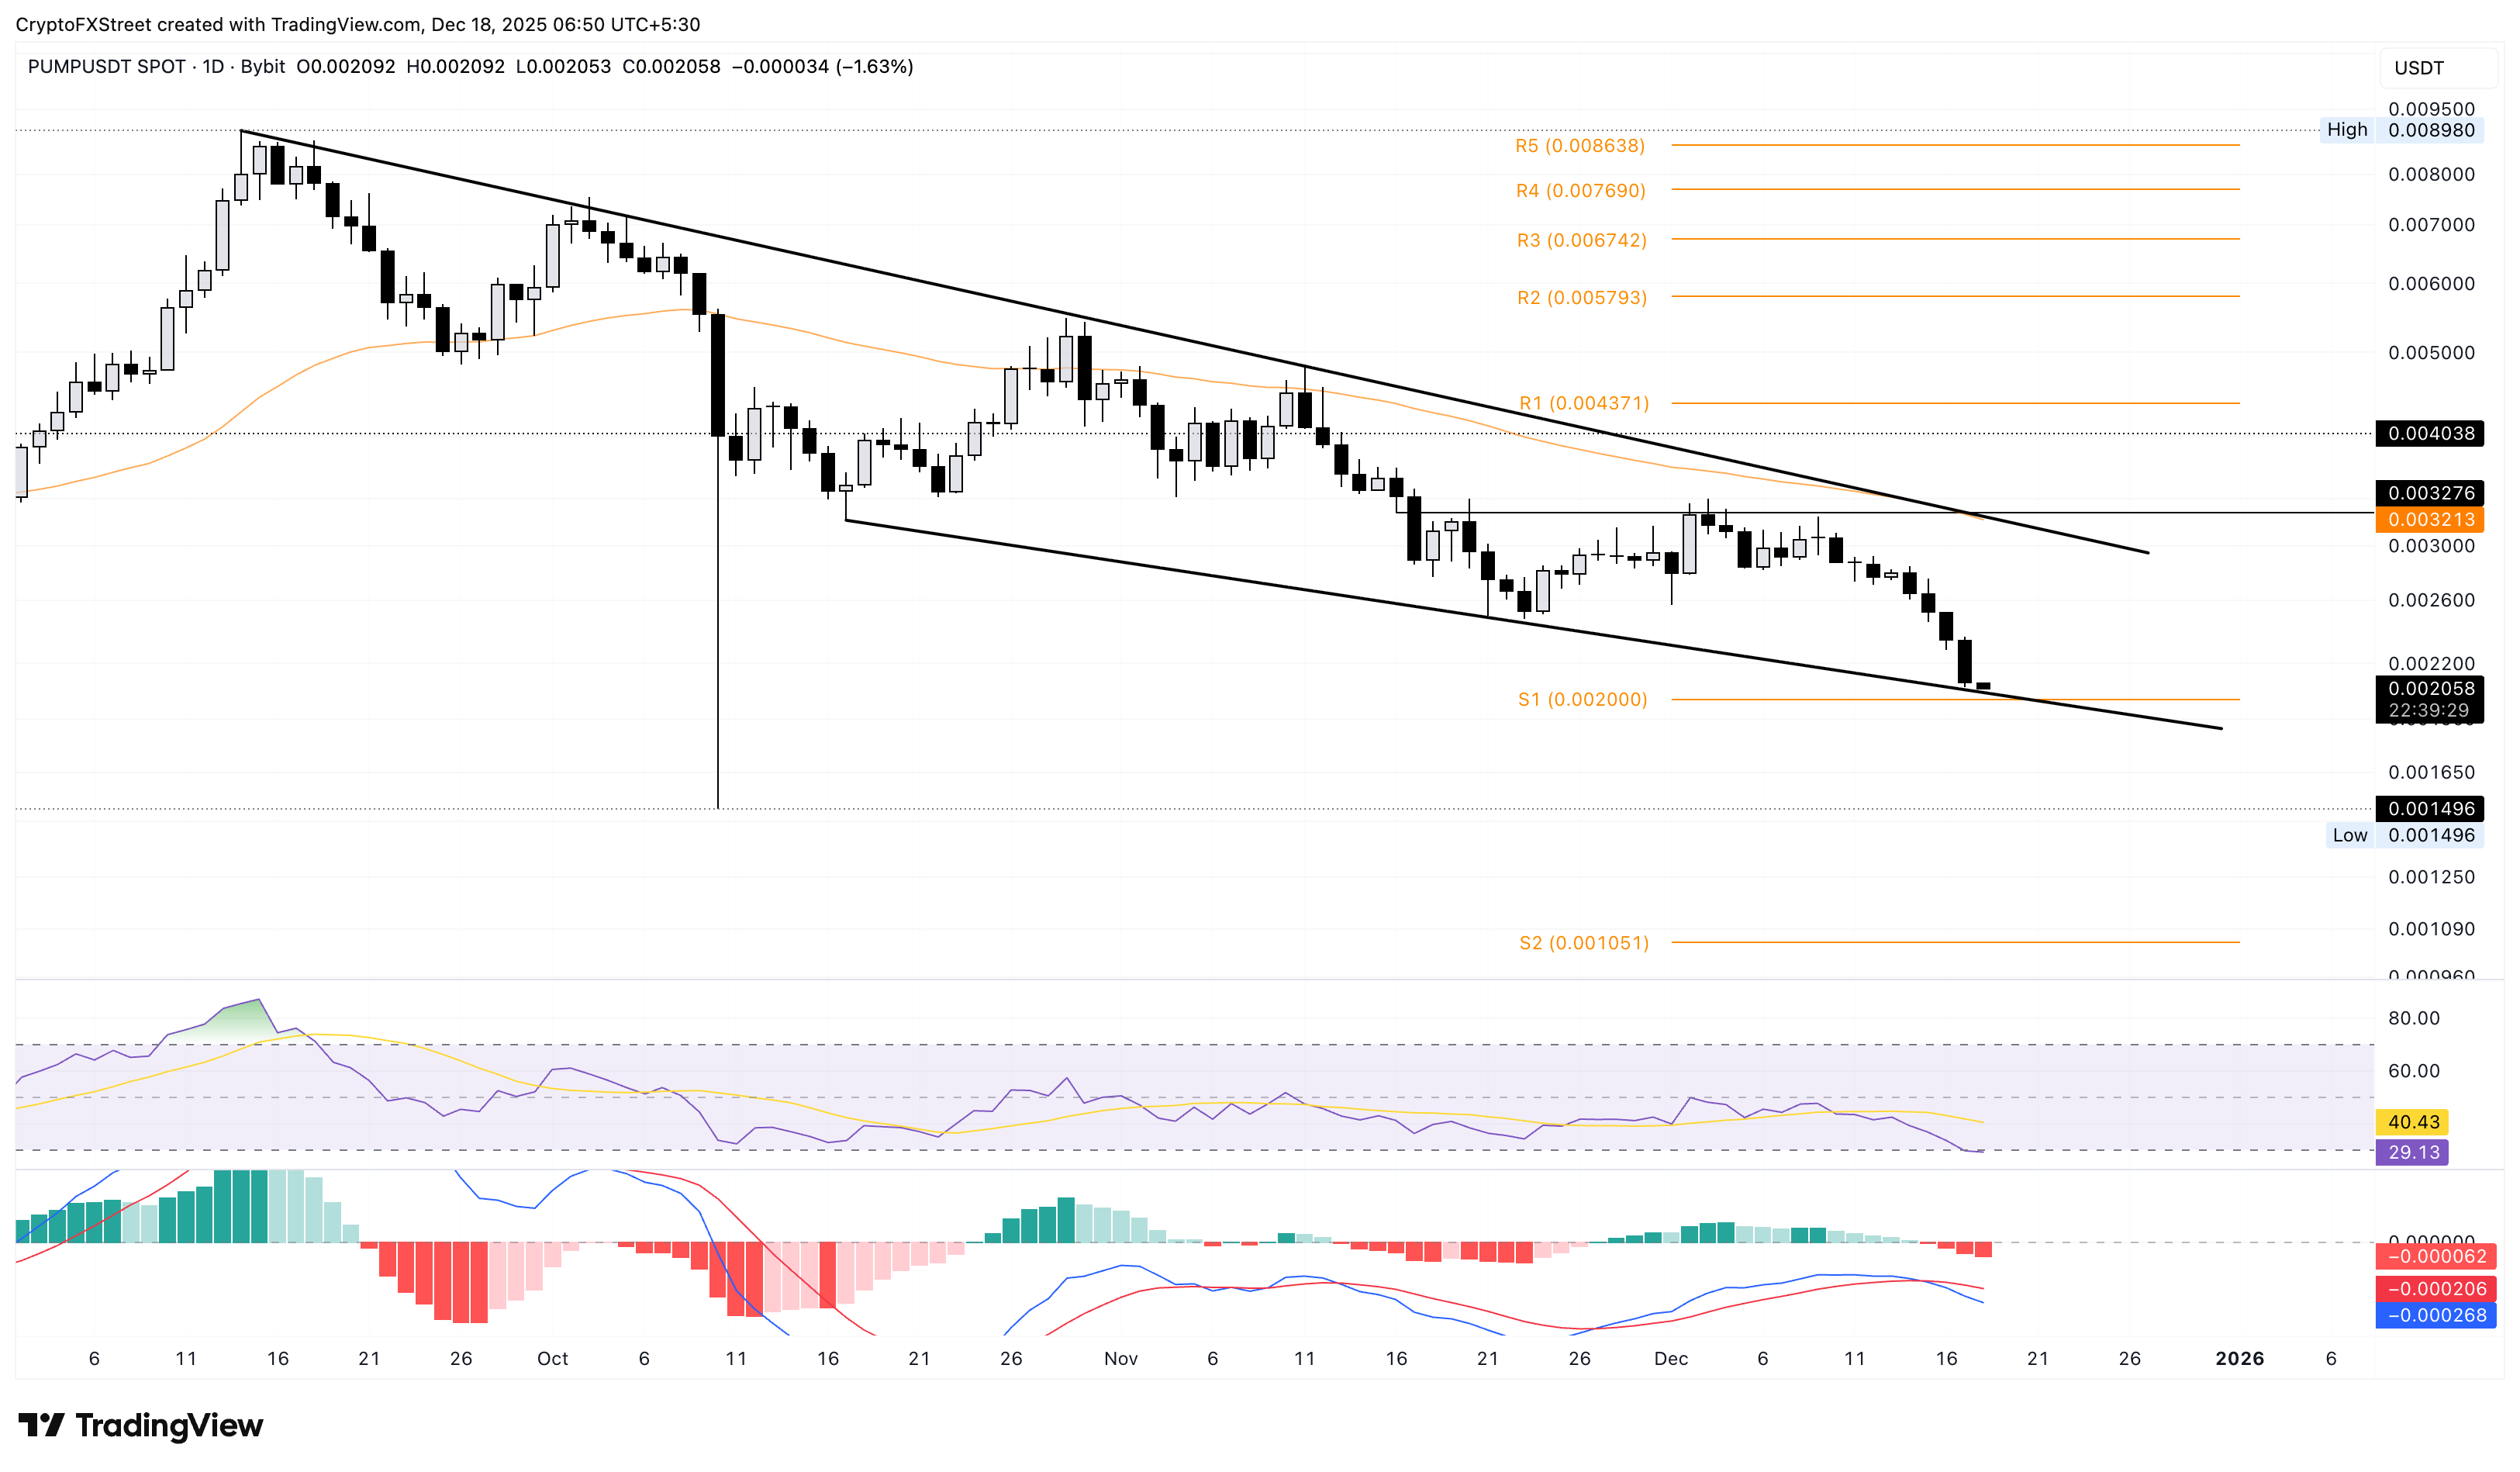
Looking up, a potential rebound in PUMP could aim for the overhead trendline connecting the September 14 and November 11 highs, near $0.003000.
SPX6900 is at risk of a steeper correction
SPX6900 is down almost 2% by press time on Thursday, extending Wednesday’s 12% decline. The path of least resistance for the meme coin points to the November 21 low at $0.4375, suggesting downside potential of nearly 8%.
The RSI at 34 continues to decline, inching closer to the oversold zone amid building selling pressure. Additionally, the declining trend in the MACD and signal line indicates a surge in bearish momentum.
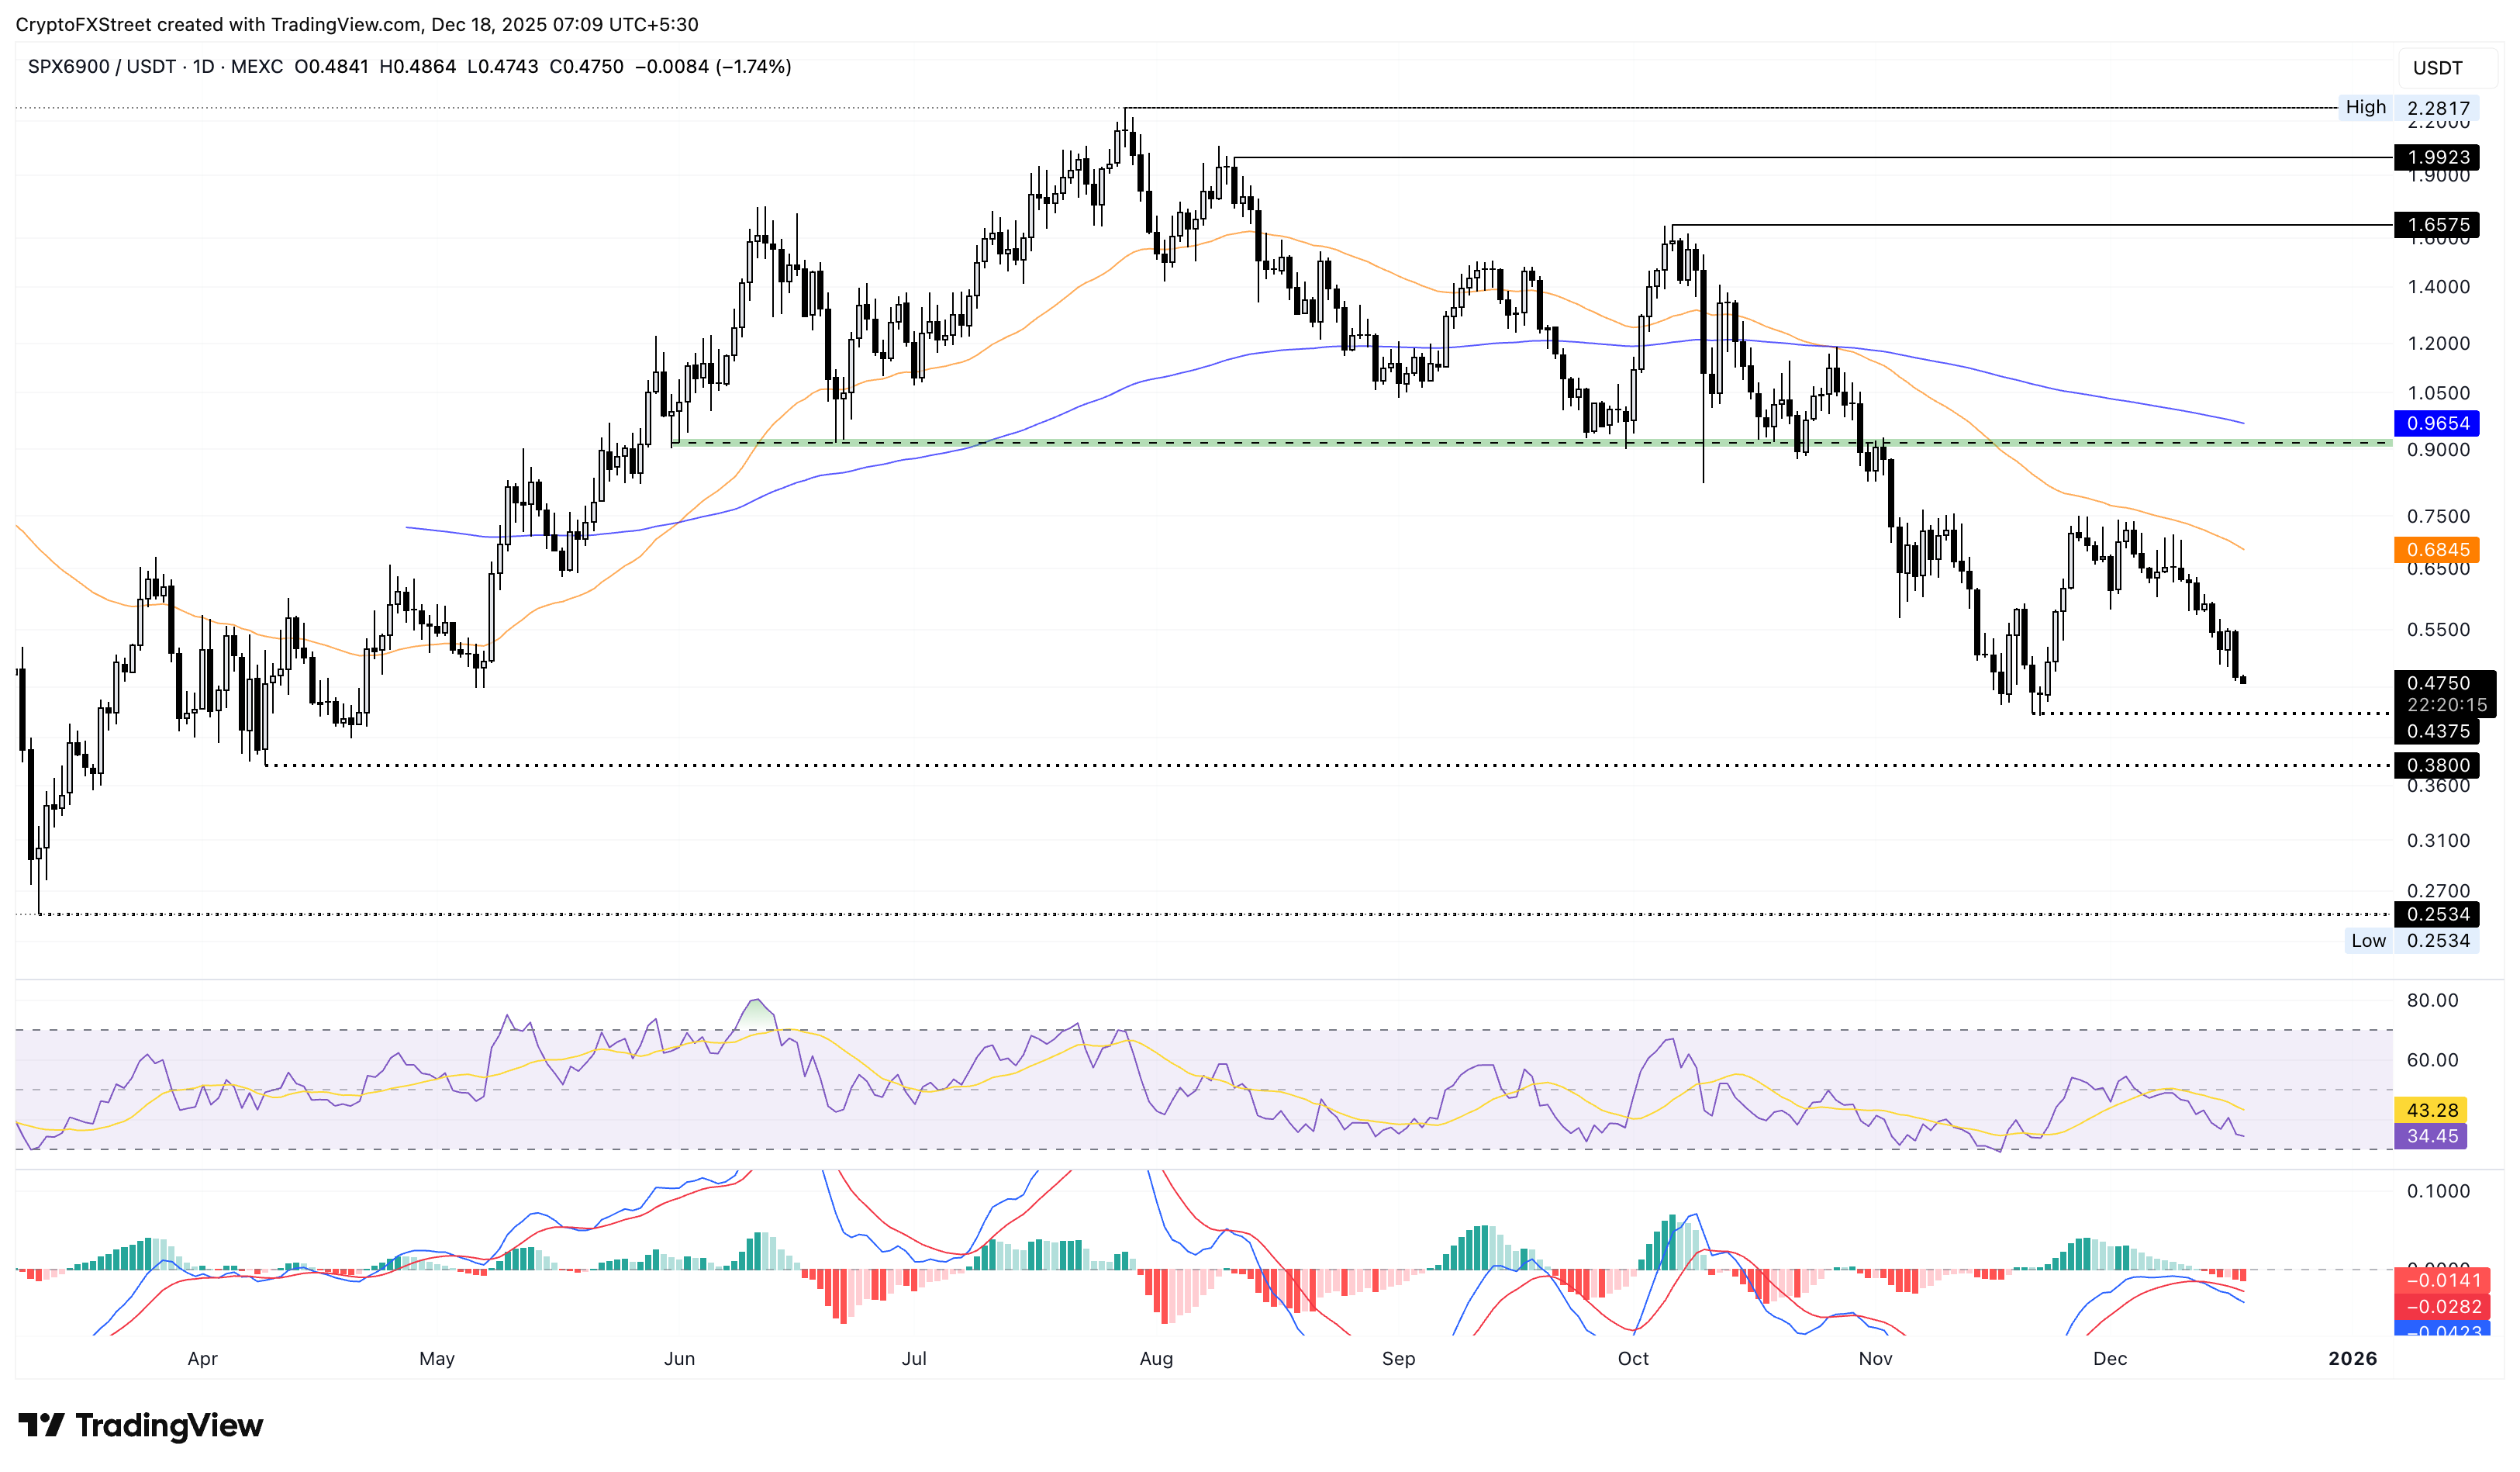
Conversely, a potential rise in SPX could find the falling 50-day Exponential Moving Average (EMA) at $0.6845 as the immediate resistance.
Bittensor’s decline gains bearish momentum
Bittensor extends its decline for the fifth consecutive day, crossing below the $250 mark. At the time of writing, the AI token is down nearly 3% on Thursday, adding to the 9% drop from the previous day.
The immediate support for TAO lies at the April 16 low of $222, followed by the $200 psychological level.
Similar to PUMP, the RSI at 30 signals oversold conditions for TAO, while the MACD remains in a sell signal following Wednesday's crossover.
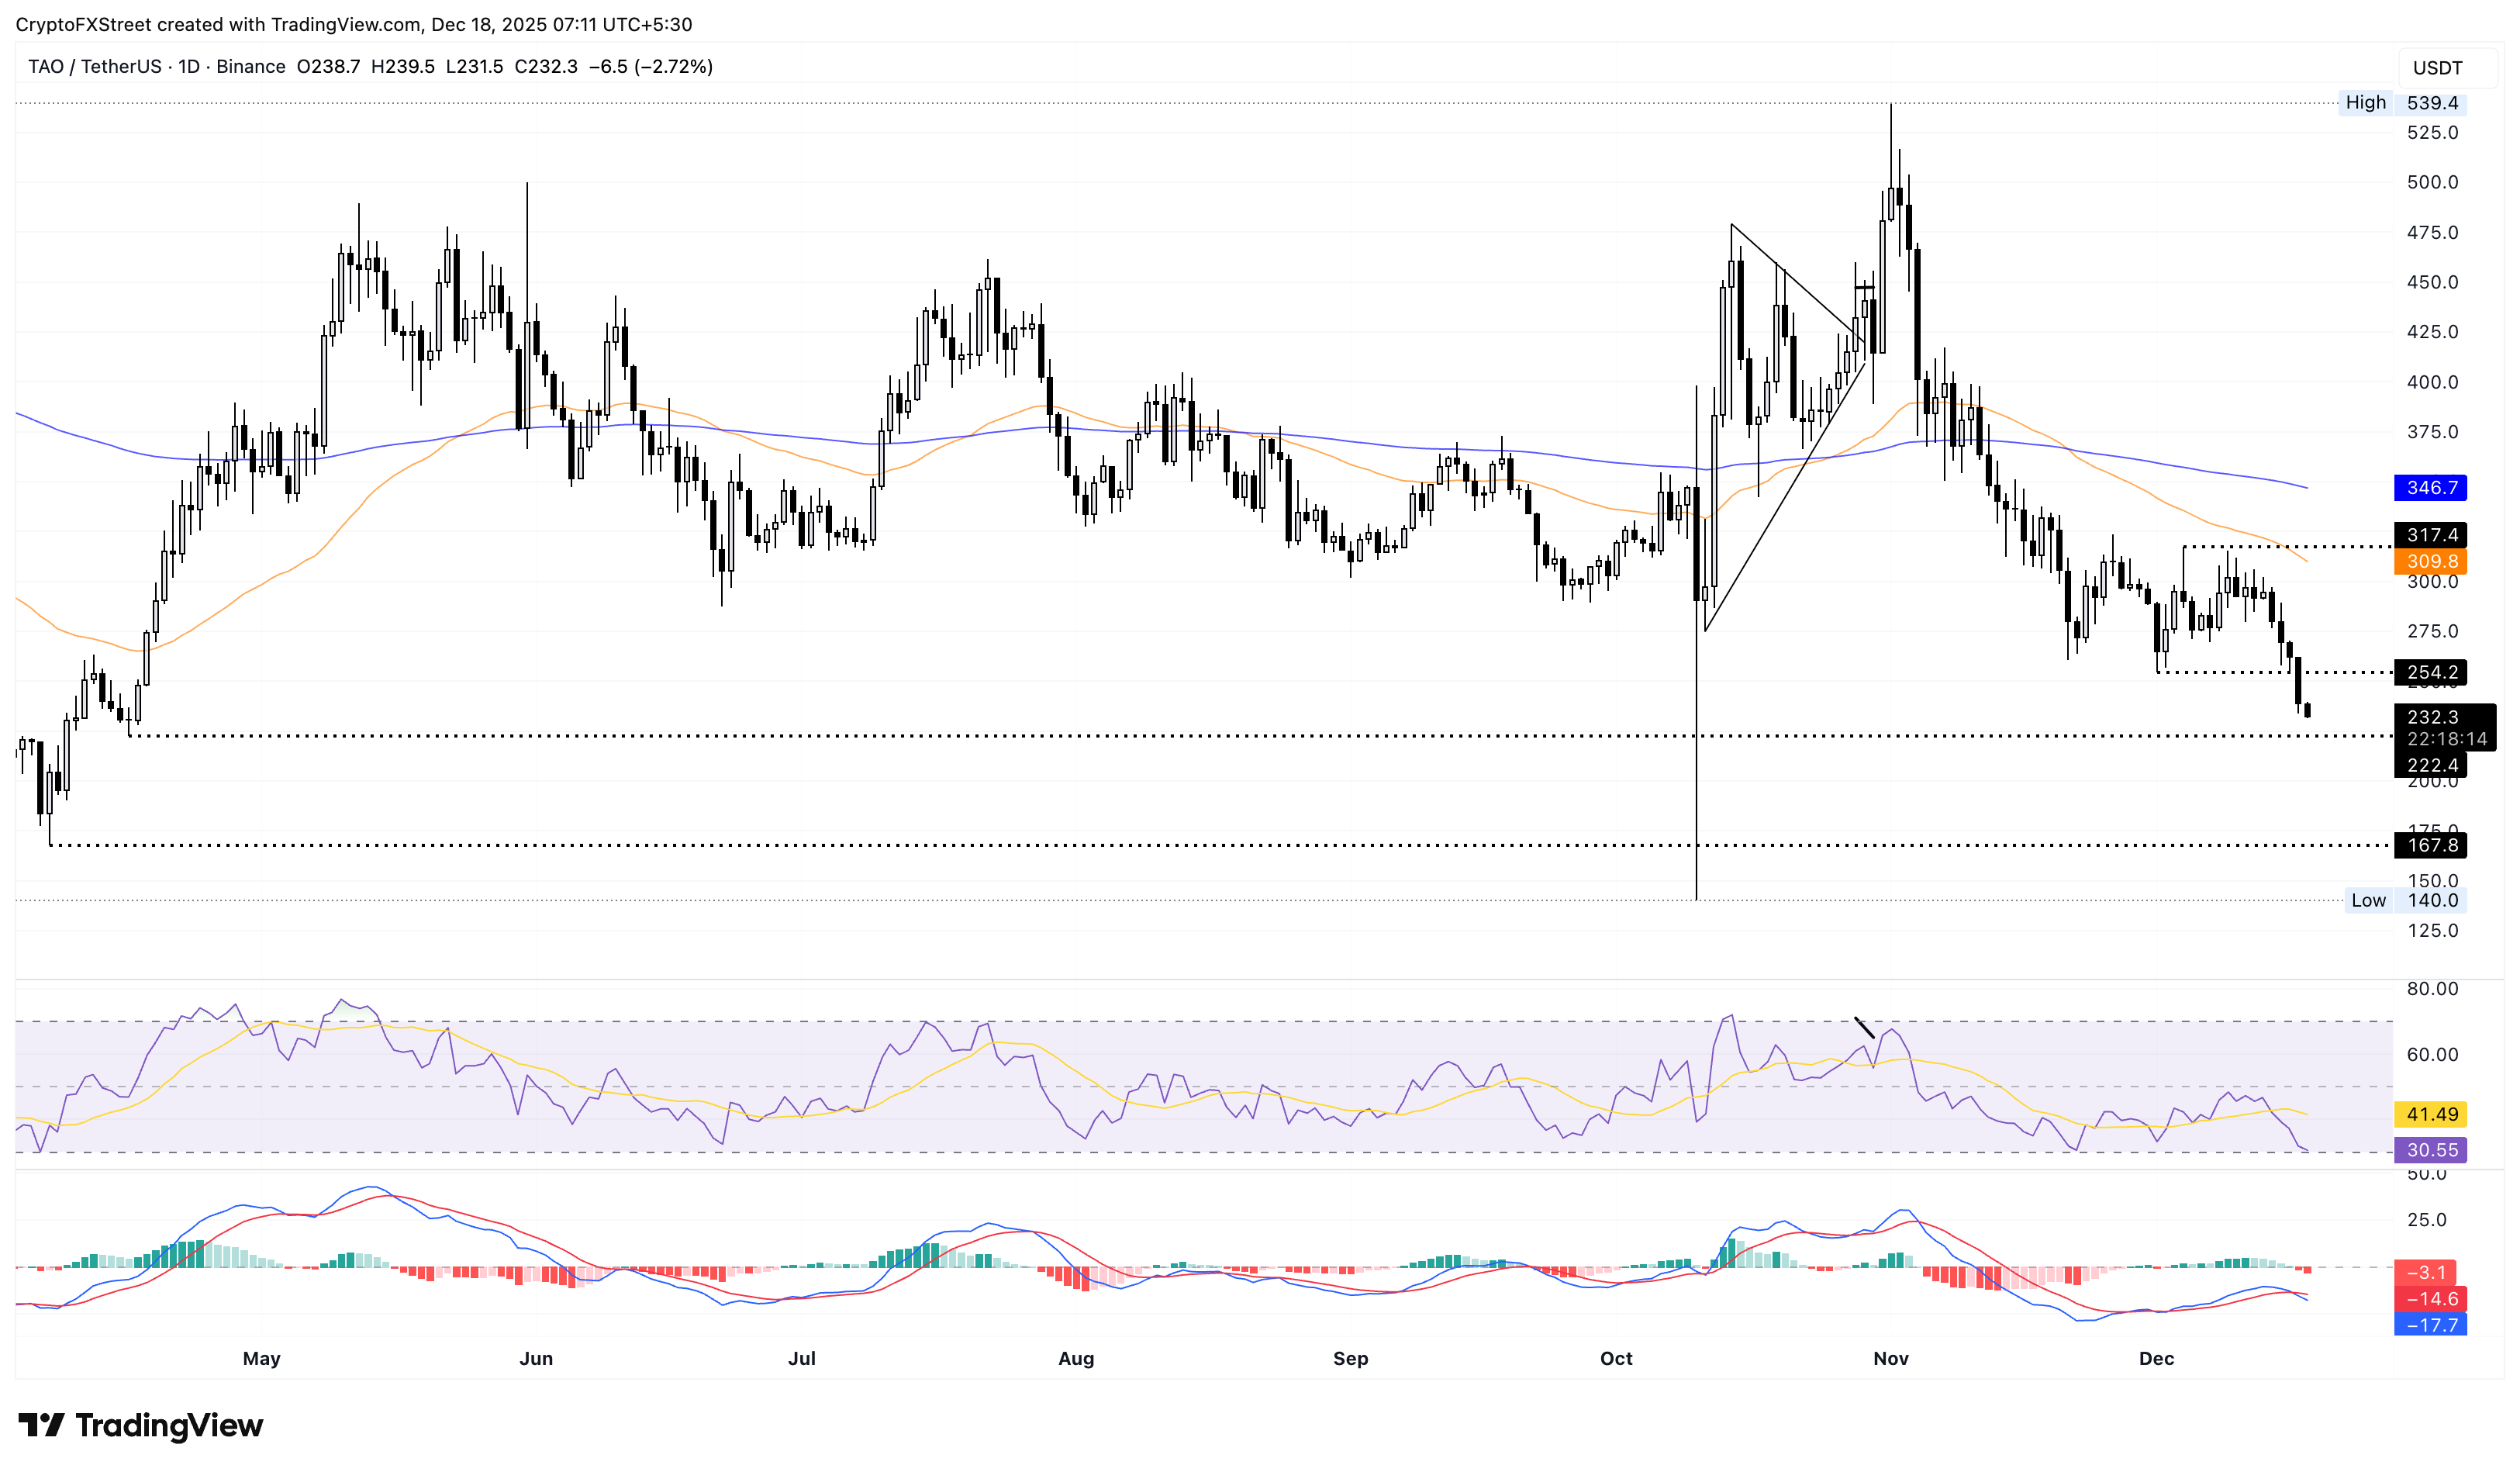
To reinstate a recovery, TAO should surface above the December 1 low at $254.

Plus d’un million d’utilisateurs se tournent vers FXStreet pour des données de marché en temps réel, des outils de graphiques, des analyses d’experts et des actualités Forex. Leur calendrier économique complet et leurs webinaires éducatifs aident les traders à rester informés et à prendre des décisions éclairées. FXStreet s’appuie sur une équipe d’environ 60 professionnels répartis entre le siège de Barcelone et diverses régions du monde.
Lire la suite


