
US Dollar Index climbs to two-week high as Fed rate hike bets intensify
Par Vishal Chaturvedi
Mis à jour: 14 May 2026


ARTICLES POPULAIRES
The US Dollar Index (DXY), which tracks the Greenback against a basket of six major currencies, climbs to a two-week high on Thursday as traders ramp up expectations that the Federal Reserve (Fed) could keep interest rates elevated for longer following a fresh batch of strong US economic data.
- The US Dollar Index (DXY) climbs to a two-week high as traders raise bets on a Fed rate hike following strong US economic data.
- Markets remain focused on stalled US-Iran peace talks and the Trump-Xi summit in Beijing for fresh geopolitical signals.
- Technically, the DXY maintains a mildly bullish tone above the 200-day SMA, while momentum indicators improve.
The US Dollar Index (DXY), which tracks the Greenback against a basket of six major currencies, climbs to a two-week high on Thursday as traders ramp up expectations that the Federal Reserve (Fed) could keep interest rates elevated for longer following a fresh batch of strong US economic data. At the time of writing, the index is trading around 98.83, extending gains for a third consecutive day.
US Retail Sales rose 0.5% month-over-month in April, matching market expectations but slowing from the 1.6% increase recorded in March. Meanwhile, the Retail Sales Control Group, which feeds directly into Gross Domestic Product (GDP) calculations, also rose 0.5% after increasing 0.8% in the previous month.
Earlier this week, stronger-than-expected US Consumer Price Index (CPI) and Producer Price Index (PPI) data pushed inflation further away from the Federal Reserve’s (Fed) 2% target, increasing pressure on the central bank to tighten monetary policy. Traders have increased bets that the Fed could raise interest rates by year-end, with the CME FedWatch Tool showing a roughly 42% probability of a hike at the December meeting, up from around 33% a day earlier.
Kansas City Fed President Jeff Schmid said on Thursday that the US economy is “less vulnerable” to global Oil disruptions than in the past, though high Oil prices still “drain household spending power” and “raise business costs.” Schmid added that the US economy has shown “remarkable resilience” and that economic fundamentals remain sound.
Geopolitical uncertainty is also supporting the US Dollar. Investors remain focused on the US-Iran peace talks, which remain stalled, alongside the summit between US President Donald Trump and Chinese President Xi Jinping in Beijing. Trump said on Thursday that Xi Jinping offered to help on Iran and supports reopening the Strait of Hormuz, through which around 20% of global Oil shipments pass.
Technical Analysis:
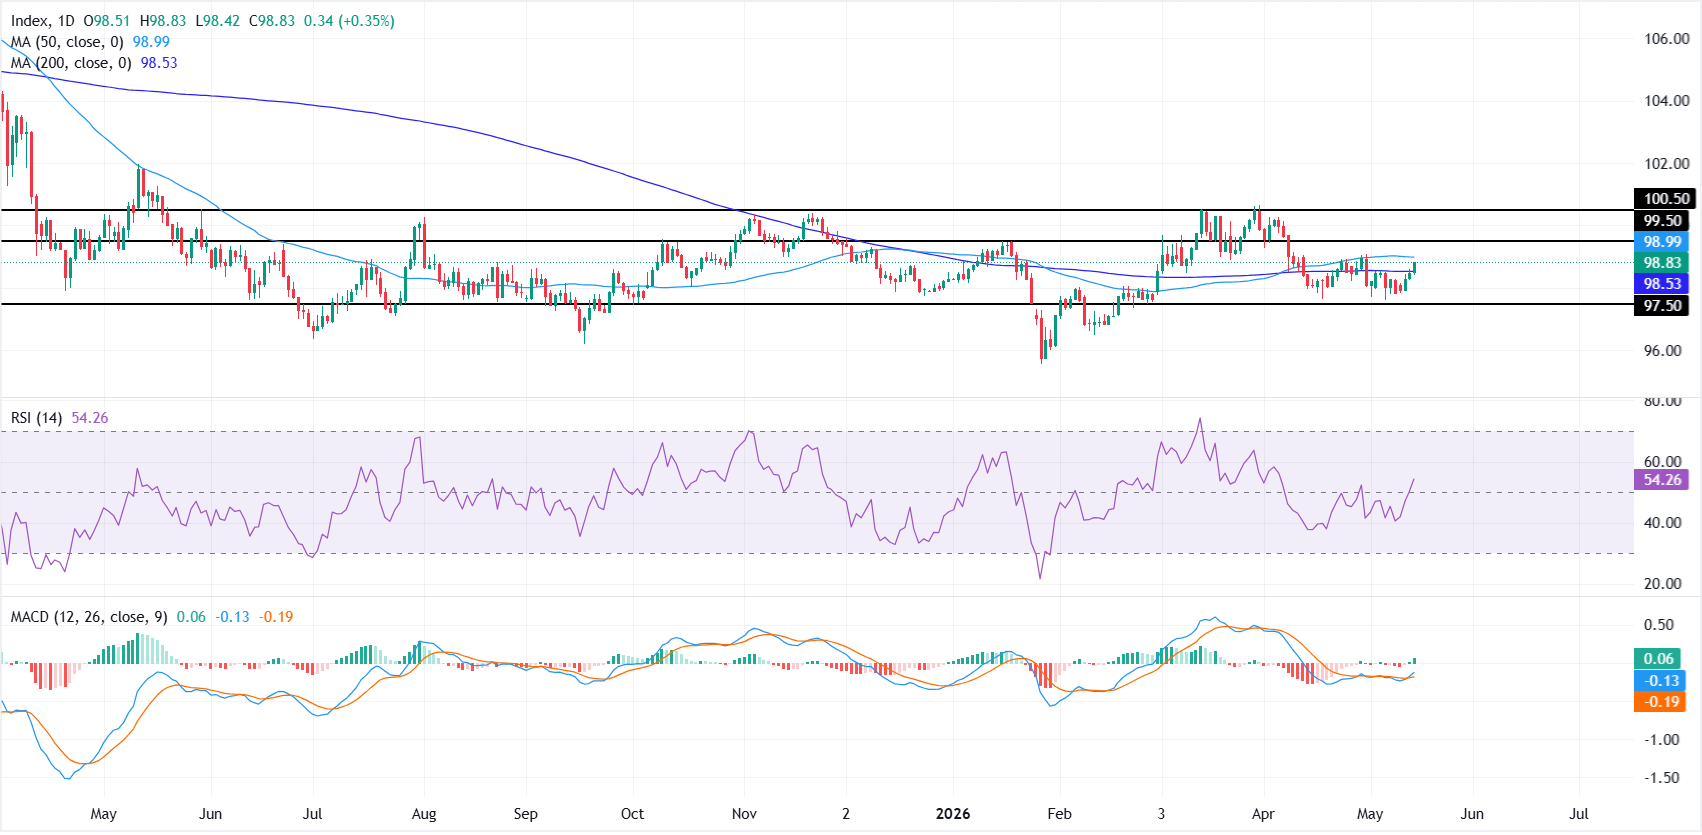
In the daily chart, Dollar Index Spot trades at 98.83. The near-term tone is mildly constructive as price holds above the 200-day Simple Moving Average (SMA) at 98.53, but remains capped just below the 50-day SMA at 98.99, keeping the broader range intact. The Relative Strength Index (RSI) at 54.15 has recovered from earlier levels near 40, while the Moving Average Convergence Divergence (MACD) histogram turns slightly positive, hinting that bullish pressure is rebuilding, albeit under nearby trend resistance.
On the topside, immediate resistance emerges at the 50-day SMA clustered around 98.99, with a subsequent barrier at the horizontal level near 99.50, and a more significant cap at 100.50 if buyers extend the advance. On the downside, initial support is provided by the 200-day SMA at 98.53, ahead of stronger structural demand at 97.50, where a break would expose a deeper corrective phase within the broader consolidation.
(The technical analysis of this story was written with the help of an AI tool.)
Inflation FAQs
Inflation measures the rise in the price of a representative basket of goods and services. Headline inflation is usually expressed as a percentage change on a month-on-month (MoM) and year-on-year (YoY) basis. Core inflation excludes more volatile elements such as food and fuel which can fluctuate because of geopolitical and seasonal factors. Core inflation is the figure economists focus on and is the level targeted by central banks, which are mandated to keep inflation at a manageable level, usually around 2%.
The Consumer Price Index (CPI) measures the change in prices of a basket of goods and services over a period of time. It is usually expressed as a percentage change on a month-on-month (MoM) and year-on-year (YoY) basis. Core CPI is the figure targeted by central banks as it excludes volatile food and fuel inputs. When Core CPI rises above 2% it usually results in higher interest rates and vice versa when it falls below 2%. Since higher interest rates are positive for a currency, higher inflation usually results in a stronger currency. The opposite is true when inflation falls.
Although it may seem counter-intuitive, high inflation in a country pushes up the value of its currency and vice versa for lower inflation. This is because the central bank will normally raise interest rates to combat the higher inflation, which attract more global capital inflows from investors looking for a lucrative place to park their money.
Formerly, Gold was the asset investors turned to in times of high inflation because it preserved its value, and whilst investors will often still buy Gold for its safe-haven properties in times of extreme market turmoil, this is not the case most of the time. This is because when inflation is high, central banks will put up interest rates to combat it. Higher interest rates are negative for Gold because they increase the opportunity-cost of holding Gold vis-a-vis an interest-bearing asset or placing the money in a cash deposit account. On the flipside, lower inflation tends to be positive for Gold as it brings interest rates down, making the bright metal a more viable investment alternative.

Plus d’un million d’utilisateurs se tournent vers FXStreet pour des données de marché en temps réel, des outils de graphiques, des analyses d’experts et des actualités Forex. Leur calendrier économique complet et leurs webinaires éducatifs aident les traders à rester informés et à prendre des décisions éclairées. FXStreet s’appuie sur une équipe d’environ 60 professionnels répartis entre le siège de Barcelone et diverses régions du monde.
Lire la suite


