
US Dollar Index Price Forecast: Aims to stabilize above 20-day EMA after three-day rally
Par Sagar Dua
Mis à jour: 24 Apr 2026


ARTICLES POPULAIRES

The US Dollar Index (DXY), which tracks the Greenback’s value against six major currencies, holds onto gains near the weekly high around 99.00 in the Asian trade on Friday.
- The US Dollar Index clings to gains near 99.00 amid higher energy prices.
- Investors fear a prolonged Hormuz closure as US-Iran peace talks stall.
- The Fed is expected to leave interest rates unchanged on Wednesday.
The US Dollar Index (DXY), which tracks the Greenback’s value against six major currencies, holds onto gains near the weekly high around 99.00 in the Asian trade on Friday. The US Dollar (USD) reflects strength as oil prices remain elevated amid fears of a prolonged closure of the Strait of Hormuz, a critical passage to almost 20% of global energy supply.
During the press time, the WTI Oil price trades flat around 95.00, but has gained almost 20% from its recent low of $78.88 posted on April 17.
Worries regarding the prolonged Hormuz closure stem from stalled peace talks between the United States (US) and Iran. Tehran has not displayed interest in the resumption of peace talks with Washington due to the continuous US blockade of Iranian sea ports.
Higher oil prices have de-anchored inflation expectations, a scenario that allows traders to pare bets supporting interest rate cuts by the Federal Reserve (Fed) in the near term. For meaningful cues on the US inflation projection, investors await the University of Michigan (UoM) one-year and five-year Consumer Inflation Expectations data for April, which will be published at 14:00 GMT.
Going forward, investors will majorly focus on the Fed’s monetary policy announcement on Wednesday, in which it is expected to leave interest rates unchanged at their current levels.
US Dollar Index technical analysis
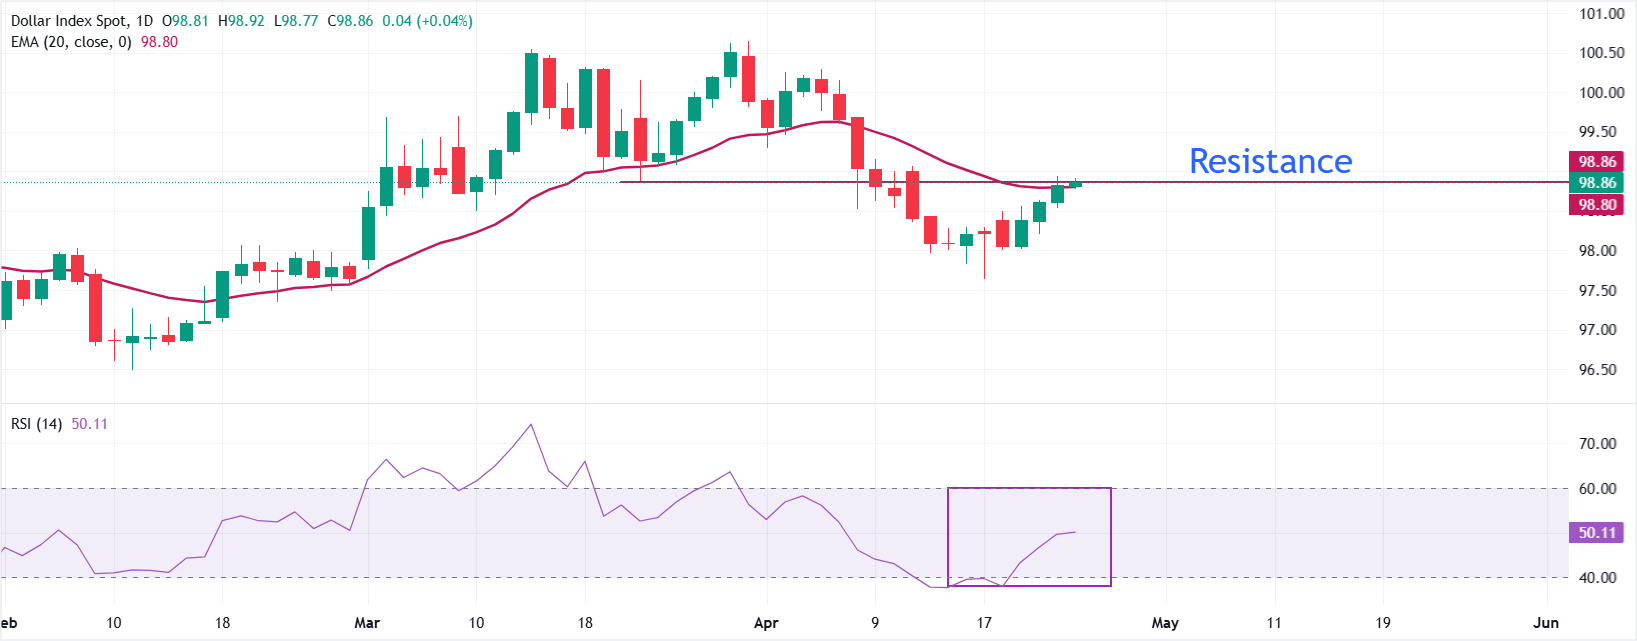
In the daily chart, the Dollar Index Spot trades at around 98.86. The price is marginally above the 20-day exponential moving average (EMA) at 98.80, keeping the near-term tone broadly neutral as the index consolidates just over this dynamic support.
The Relative Strength Index (14) at 50.11 sits near the midline, suggesting a lack of strong directional momentum and reinforcing the view of a market pausing after its recent pullback.
On the downside, immediate support is at the April 23 low of 98.53, followed by the April 21 low around 98.00. Looking up, the price could extend its upside move towards the April 9 high at 99.16 if it manages a sustained move above the 20-day EMA, and could rise further towards the April 8 high around 99.70.
(The technical analysis of this story was written with the help of an AI tool.)
Economic Indicator
Fed Interest Rate Decision
The Federal Reserve (Fed) deliberates on monetary policy and makes a decision on interest rates at eight pre-scheduled meetings per year. It has two mandates: to keep inflation at 2%, and to maintain full employment. Its main tool for achieving this is by setting interest rates – both at which it lends to banks and banks lend to each other. If it decides to hike rates, the US Dollar (USD) tends to strengthen as it attracts more foreign capital inflows. If it cuts rates, it tends to weaken the USD as capital drains out to countries offering higher returns. If rates are left unchanged, attention turns to the tone of the Federal Open Market Committee (FOMC) statement, and whether it is hawkish (expectant of higher future interest rates), or dovish (expectant of lower future rates).
Read more.Next release: Wed Apr 29, 2026 18:00
Frequency: Irregular
Consensus: 3.75%
Previous: 3.75%
Source: Federal Reserve

Plus d’un million d’utilisateurs se tournent vers FXStreet pour des données de marché en temps réel, des outils de graphiques, des analyses d’experts et des actualités Forex. Leur calendrier économique complet et leurs webinaires éducatifs aident les traders à rester informés et à prendre des décisions éclairées. FXStreet s’appuie sur une équipe d’environ 60 professionnels répartis entre le siège de Barcelone et diverses régions du monde.
Lire la suite


