
US Dollar Index Price Forecast: Tests 99.50 support near nine-day EMA
Par Akhtar Faruqui
Date de publication: 18 Mar 2026 | Date de modification: 18 Mar 2026


ARTICLES POPULAIRES

The US Dollar Index (DXY), which measures the value of the US Dollar (USD) against six major currencies, is extending its losing streak for the third successive session and trading around 99.50 during the early European hours on Wednesday.
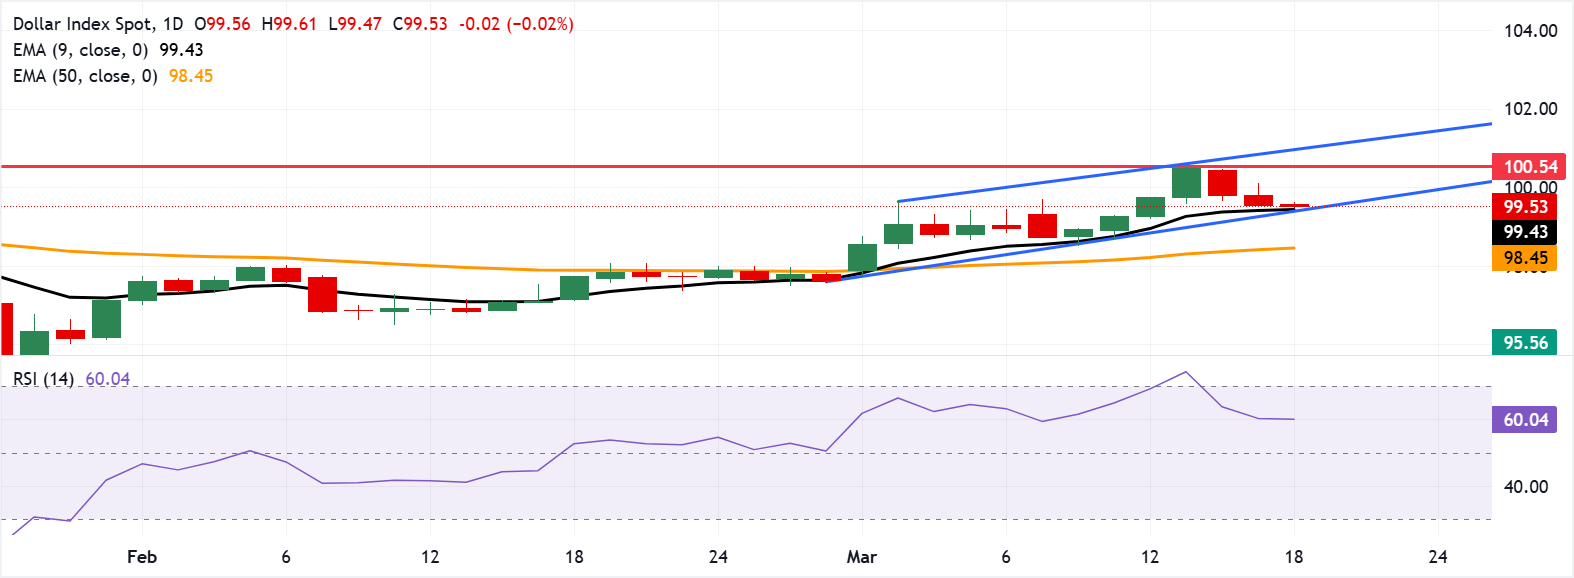
- US Dollar Index may rebound toward a nearly 10-month high of 100.54.
- The 14-day RSI eased from above 70 to 59, signaling positive but less overbought momentum.
- The DXY may find immediate support at the nine-day EMA of 99.43.
The US Dollar Index (DXY), which measures the value of the US Dollar (USD) against six major currencies, is extending its losing streak for the third successive session and trading around 99.50 during the early European hours on Wednesday. The technical analysis of the daily chart shows that the dollar index remains within the ascending channel pattern, suggesting a persistent bullish bias.
The near-term bias stays mildly bullish as the US Dollar Index holds above both the nine-day and 50-day Exponential Moving Averages (EMAs), keeping the short-term trend aligned with the broader upturn. The nine-day EMA has risen steadily above the 50-day band through the recent advance, signalling persistent buying interest despite the latest consolidation.
The 14-day Relative Strength Index (RSI) has cooled from overbought extremes above 70 to around 59, indicating positive momentum without stretched conditions and leaving room for the uptrend to resume if buyers defend current levels.
On the upside, the US Dollar Index may rebound and test a nearly 10-month high of 100.54, followed by the upper boundary of the ascending channel around 101.00.
The immediate support lies at the nine-day EMA of 99.43, aligned with the lower ascending channel boundary around 99.50. Further declines below the channel would cause the emergence of the bearish bias and expose the 50-day EMA at 98.45.
(The technical analysis of this story was written with the help of an AI tool.)
US Dollar FAQs
The US Dollar (USD) is the official currency of the United States of America, and the ‘de facto’ currency of a significant number of other countries where it is found in circulation alongside local notes. It is the most heavily traded currency in the world, accounting for over 88% of all global foreign exchange turnover, or an average of $6.6 trillion in transactions per day, according to data from 2022. Following the second world war, the USD took over from the British Pound as the world’s reserve currency. For most of its history, the US Dollar was backed by Gold, until the Bretton Woods Agreement in 1971 when the Gold Standard went away.
The most important single factor impacting on the value of the US Dollar is monetary policy, which is shaped by the Federal Reserve (Fed). The Fed has two mandates: to achieve price stability (control inflation) and foster full employment. Its primary tool to achieve these two goals is by adjusting interest rates. When prices are rising too quickly and inflation is above the Fed’s 2% target, the Fed will raise rates, which helps the USD value. When inflation falls below 2% or the Unemployment Rate is too high, the Fed may lower interest rates, which weighs on the Greenback.
In extreme situations, the Federal Reserve can also print more Dollars and enact quantitative easing (QE). QE is the process by which the Fed substantially increases the flow of credit in a stuck financial system. It is a non-standard policy measure used when credit has dried up because banks will not lend to each other (out of the fear of counterparty default). It is a last resort when simply lowering interest rates is unlikely to achieve the necessary result. It was the Fed’s weapon of choice to combat the credit crunch that occurred during the Great Financial Crisis in 2008. It involves the Fed printing more Dollars and using them to buy US government bonds predominantly from financial institutions. QE usually leads to a weaker US Dollar.
Quantitative tightening (QT) is the reverse process whereby the Federal Reserve stops buying bonds from financial institutions and does not reinvest the principal from the bonds it holds maturing in new purchases. It is usually positive for the US Dollar.

Plus d’un million d’utilisateurs se tournent vers FXStreet pour des données de marché en temps réel, des outils de graphiques, des analyses d’experts et des actualités Forex. Leur calendrier économique complet et leurs webinaires éducatifs aident les traders à rester informés et à prendre des décisions éclairées. FXStreet s’appuie sur une équipe d’environ 60 professionnels répartis entre le siège de Barcelone et diverses régions du monde.
Lire la suite


