

USD/JPY Price Forecast: Hurdles 159.00 but upside capped on intervention fears
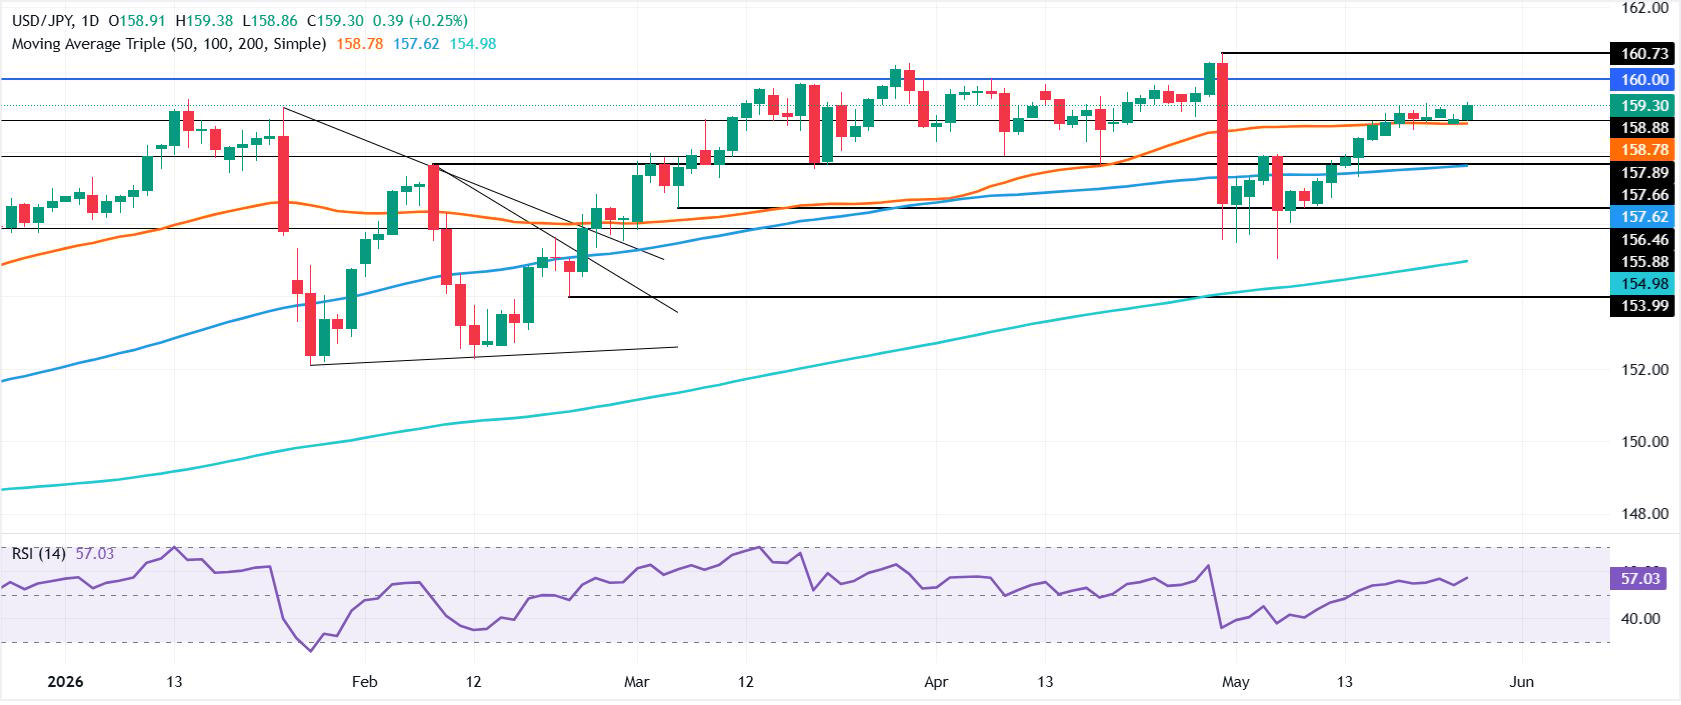
- USD/JPY clears 159.00 after bouncing from 50-day SMA support.
- RSI remains bullish, but intervention fears cap upside momentum.
- Break below 159.00 exposes 158.78 and 157.62 supports.
The USD/JPY recovers some ground, rising by over 0.25%, as buyers ignore the intervention zone, with the pair clearing the 159.00 figure and aiming to challenge the 159.50 area. At the time of writing, the pair trades at 159.38.
USD/JPY Price Forecast: Technical outlook
Price action shows the USD/JPY is poised to consolidate further within the 159.00-160.00 area, even though further upside is seen, after the pair bounced off the 50-day Simple Moving Average (SMA) at 158.79, extending its gains past 159.00.

Momentum, although bullish with the Relative Strength Index (RSI) above its 50-neutral level, remains capped by fears for a possible intervention by Japanese authorities in the FX markets.
On the downside, if USD/JPY moves below 159.00, traders could eye the 50-day SMA at 158.78. Below this level lies the 100-day SMA at 157.62, ahead of the May 6 low of 155.04.
USD/JPY Price Chart – Daily
Japanese Yen Price Today
The table below shows the percentage change of Japanese Yen (JPY) against listed major currencies today. Japanese Yen was the strongest against the New Zealand Dollar.
| USD | EUR | GBP | JPY | CAD | AUD | NZD | CHF | |
|---|---|---|---|---|---|---|---|---|
| USD | 0.13% | 0.43% | 0.25% | 0.07% | 0.06% | 0.61% | 0.36% | |
| EUR | -0.13% | 0.34% | 0.15% | -0.02% | -0.03% | 0.51% | 0.24% | |
| GBP | -0.43% | -0.34% | -0.17% | -0.36% | -0.36% | 0.17% | -0.08% | |
| JPY | -0.25% | -0.15% | 0.17% | -0.17% | -0.17% | 0.34% | 0.13% | |
| CAD | -0.07% | 0.02% | 0.36% | 0.17% | 0.01% | 0.54% | 0.29% | |
| AUD | -0.06% | 0.03% | 0.36% | 0.17% | -0.01% | 0.53% | 0.29% | |
| NZD | -0.61% | -0.51% | -0.17% | -0.34% | -0.54% | -0.53% | -0.25% | |
| CHF | -0.36% | -0.24% | 0.08% | -0.13% | -0.29% | -0.29% | 0.25% |
The heat map shows percentage changes of major currencies against each other. The base currency is picked from the left column, while the quote currency is picked from the top row. For example, if you pick the Japanese Yen from the left column and move along the horizontal line to the US Dollar, the percentage change displayed in the box will represent JPY (base)/USD (quote).














