
Trade The World
AUD/JPY Price Forecast: Remains below 97.00, support appears at nine-day EMA
Par Akhtar Faruqui
Date de publication: 25 Jul 2025 | Date de modification: 25 Jul 2025


POPULAR ARTICLES

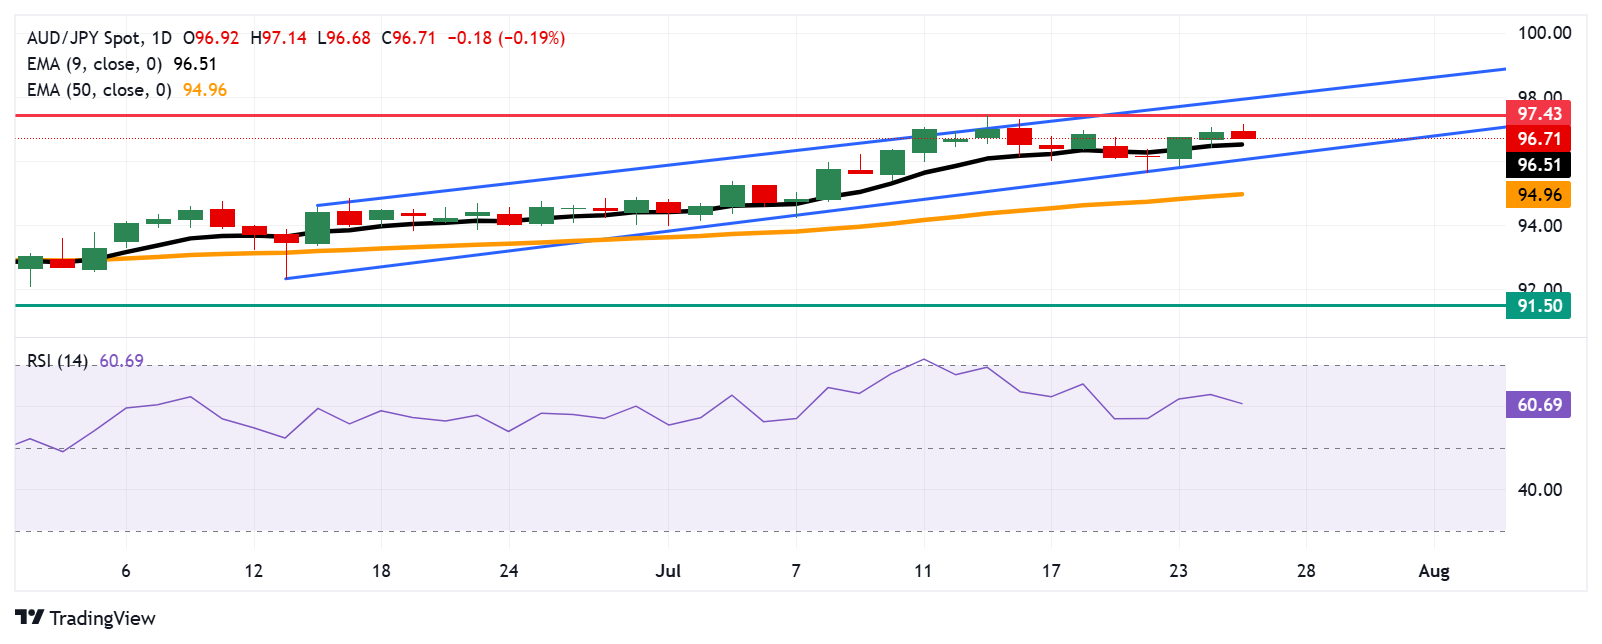
AUD/JPY edges lower after two days of losses, trading around 96.90 during the Asian hours on Friday. The technical analysis of the daily chart shows that the currency cross remains within the ascending channel pattern, suggesting a prevailing bullish bias.
- AUD/JPY may find primary resistance at the six-month high of 97.40.
- The 14-day Relative Strength Index remains above the 50 mark, strengthening bullish bias.
- The nine-day EMA of 96.50 appears at the immediate support.
AUD/JPY edges lower after two days of losses, trading around 96.90 during the Asian hours on Friday. The technical analysis of the daily chart shows that the currency cross remains within the ascending channel pattern, suggesting a prevailing bullish bias.
The 14-day Relative Strength Index (RSI) is remaining above the 50 mark, strengthening bullish sentiment. Additionally, the AUD/JPY cross is positioned above the nine-day Exponential Moving Average (EMA), indicating short-term price momentum is stronger.
On the upside, the AUD/JPY cross may target the six-month high at 97.40, which was recorded on July 15, followed by the upper boundary of the ascending channel around 98.00. A successful breach above the channel could reinforce the bullish bias and prompt the currency cross to approach the psychological level of 99.00.
The AUD/JPY cross may find immediate support at the nine-day EMA of 96.51, followed by the ascending channel’s lower boundary around 96.10. A successful break below the channel would weaken the short-term price momentum and put downward pressure on the currency cross to target the 50-day EMA at 94.96.
AUD/JPY: Daily Chart
Australian Dollar PRICE Today
The table below shows the percentage change of Australian Dollar (AUD) against listed major currencies today. Australian Dollar was the weakest against the US Dollar.
| USD | EUR | GBP | JPY | CAD | AUD | NZD | CHF | |
|---|---|---|---|---|---|---|---|---|
| USD | 0.05% | 0.15% | 0.09% | 0.17% | 0.38% | 0.15% | 0.09% | |
| EUR | -0.05% | 0.14% | 0.02% | 0.14% | 0.24% | 0.10% | 0.03% | |
| GBP | -0.15% | -0.14% | -0.08% | -0.01% | 0.10% | -0.01% | -0.10% | |
| JPY | -0.09% | -0.02% | 0.08% | 0.08% | 0.22% | 0.07% | -0.00% | |
| CAD | -0.17% | -0.14% | 0.01% | -0.08% | 0.25% | -0.02% | -0.11% | |
| AUD | -0.38% | -0.24% | -0.10% | -0.22% | -0.25% | -0.13% | -0.17% | |
| NZD | -0.15% | -0.10% | 0.01% | -0.07% | 0.02% | 0.13% | -0.07% | |
| CHF | -0.09% | -0.03% | 0.10% | 0.00% | 0.11% | 0.17% | 0.07% |
The heat map shows percentage changes of major currencies against each other. The base currency is picked from the left column, while the quote currency is picked from the top row. For example, if you pick the Australian Dollar from the left column and move along the horizontal line to the US Dollar, the percentage change displayed in the box will represent AUD (base)/USD (quote).

FXStreet
Plus d’un million d’utilisateurs se tournent vers FXStreet pour des données de marché en temps réel, des outils de graphiques, des analyses d’experts et des actualités Forex. Leur calendrier économique complet et leurs webinaires éducatifs aident les traders à rester informés et à prendre des décisions éclairées. FXStreet s’appuie sur une équipe d’environ 60 professionnels répartis entre le siège de Barcelone et diverses régions du monde.
Read More


