
Trade The World
Bitcoin Cash Price Forecast: BCH eyes breakout as futures data hint at bullish bias
Par Manish Chhetri
Date de publication: 30 Oct 2025 | Date de modification: 30 Oct 2025


POPULAR ARTICLES

Bitcoin Cash (BCH) price steadies around $560 at the time of writing on Thursday, nearing its key resistance zone. While on-chain data remains neutral, slight bullish signals in the futures market indicate growing optimism among traders.
- Bitcoin Cash price steadies around $560 on Thursday, approaching a key resistance zone.
- On-chain data remains neutral, while the futures market shows a mild bullish tilt.
- The technical outlook suggests that a daily close above $565.1 could open the door to further upside momentum.
Bitcoin Cash (BCH) price steadies around $560 at the time of writing on Thursday, nearing its key resistance zone. While on-chain data remains neutral, slight bullish signals in the futures market indicate growing optimism among traders. On the technical side, a decisive close above $565.1 could confirm renewed upward momentum for BCH in the near term.
BCH’s show bullish bias on the futures market
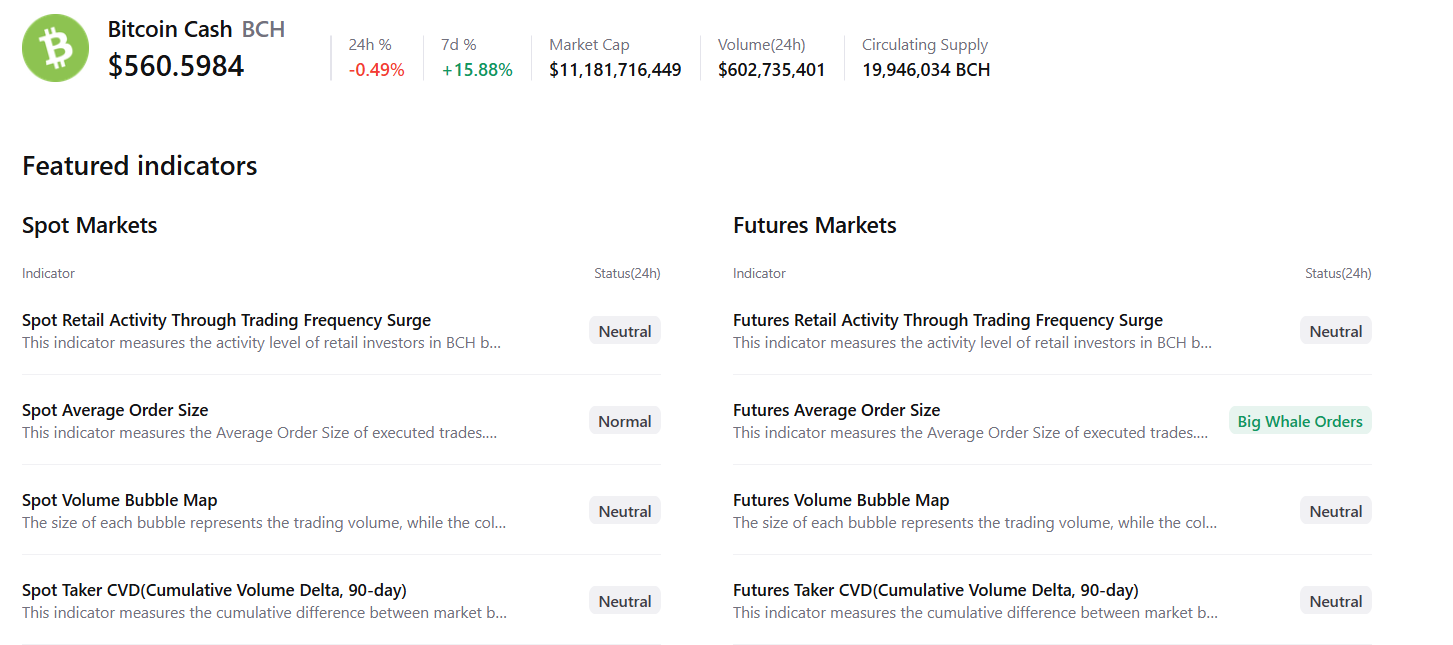
CryptoQuant’s summary data supports a mildly bullish outlook for Bitcoin Cash, showing that while the spot market remains neutral, the futures market indicates rising whale activity, signaling a rally ahead.
On the derivatives side, Coinglass’s OI-Weighted Funding Rate data shows that the number of traders betting that the price of BCH will slide further is lower than that anticipating a price increase. The metric has flipped to a positive rate, standing at 0.0007% on Thursday, indicating that longs are paying shorts. Historically, as shown in the chart below, when the funding rates have flipped from negative to positive, BCH has rallied sharply.
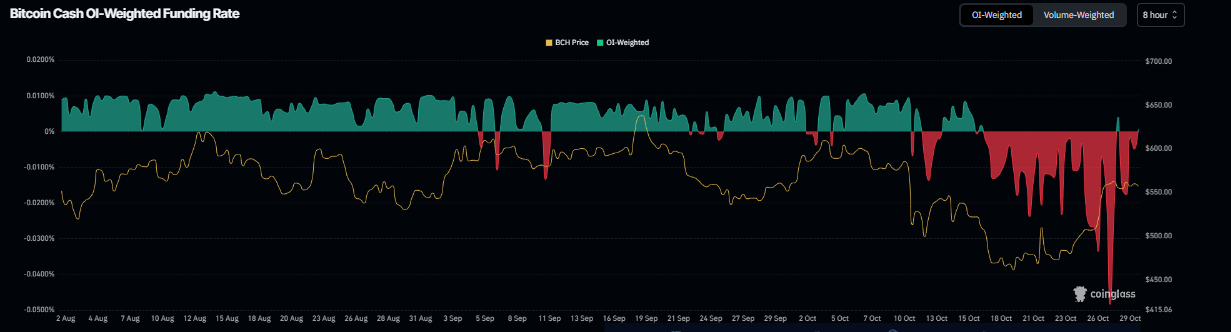
BCH funding rate chart. Source: Coinglass
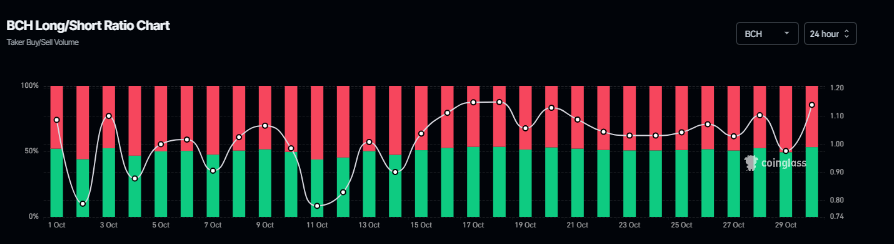
Coinglass’s long-to-short ratio for BCH reads 1.14 on Thursday, nearing the highest level over a month. The ratio above one suggests that more traders are betting on BCH’s price to rally.
Bitcoin Cash Price Forecast: BCH could rally if it closes above $565.1 mark
Bitcoin Cash price has been facing resistance around the 78.6% Fibonacci retracement level (drawn from the April low of $249.4 to the September high of $651) at $565.1 since Monday and has found support around the 50-day Exponential Moving Average (EMA) at $542.3. At the time of writing on Thursday, BCH trades slightly above the 78.6% resistance level.
If BCH closes above the $565.1 resistance level on a daily basis, it could extend the rally toward the September 18 high of $651.
The Relative Strength Index (RSI) on the daily chart reads 59, above the neutral level of 50, indicating bullish momentum gaining traction. Additionally, the Moving Average Convergence Divergence (MACD) showed a bullish crossover last week, providing a buy signal. Moreover, the rising green histogram bars above the neutral level support bullish momentum and suggest an upward trend.
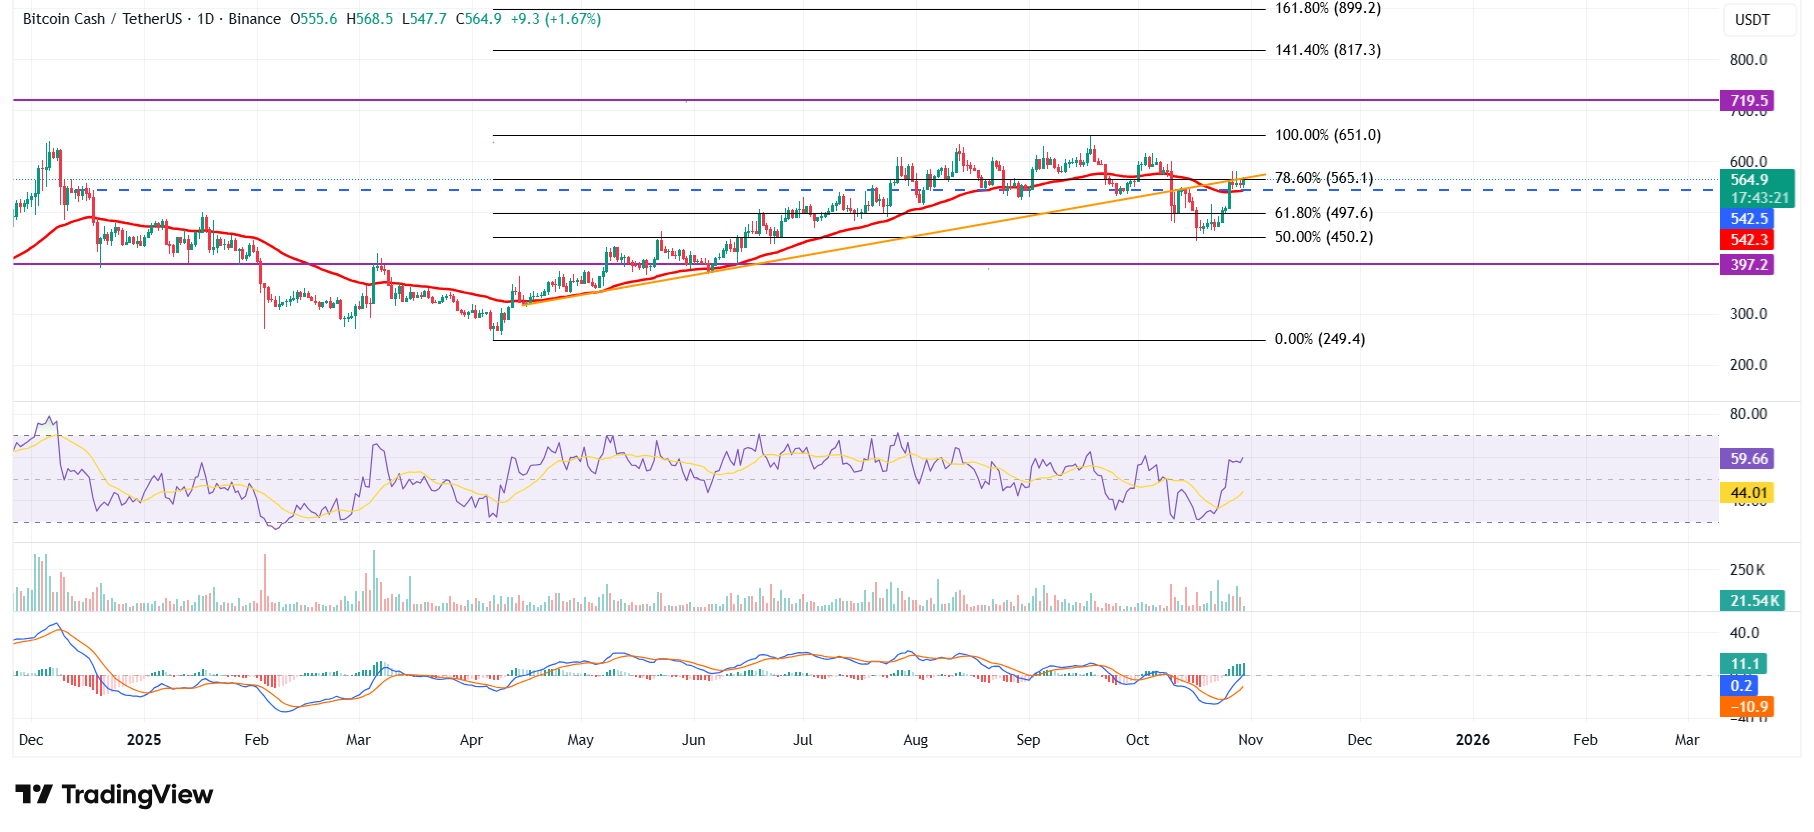
BCH/USDT daily chart
On the other hand, if BCH faces a correction, it could extend the decline toward the 50-day EMA at $542.3.

FXStreet
Plus d’un million d’utilisateurs se tournent vers FXStreet pour des données de marché en temps réel, des outils de graphiques, des analyses d’experts et des actualités Forex. Leur calendrier économique complet et leurs webinaires éducatifs aident les traders à rester informés et à prendre des décisions éclairées. FXStreet s’appuie sur une équipe d’environ 60 professionnels répartis entre le siège de Barcelone et diverses régions du monde.
Read More


