
Trade The World
Bitcoin Cash Price Forecast: BCH flashes bullish potential as momentum strengthens
Par Vishal Dixit
Date de publication: 11 Nov 2025 | Date de modification: 11 Nov 2025


POPULAR ARTICLES

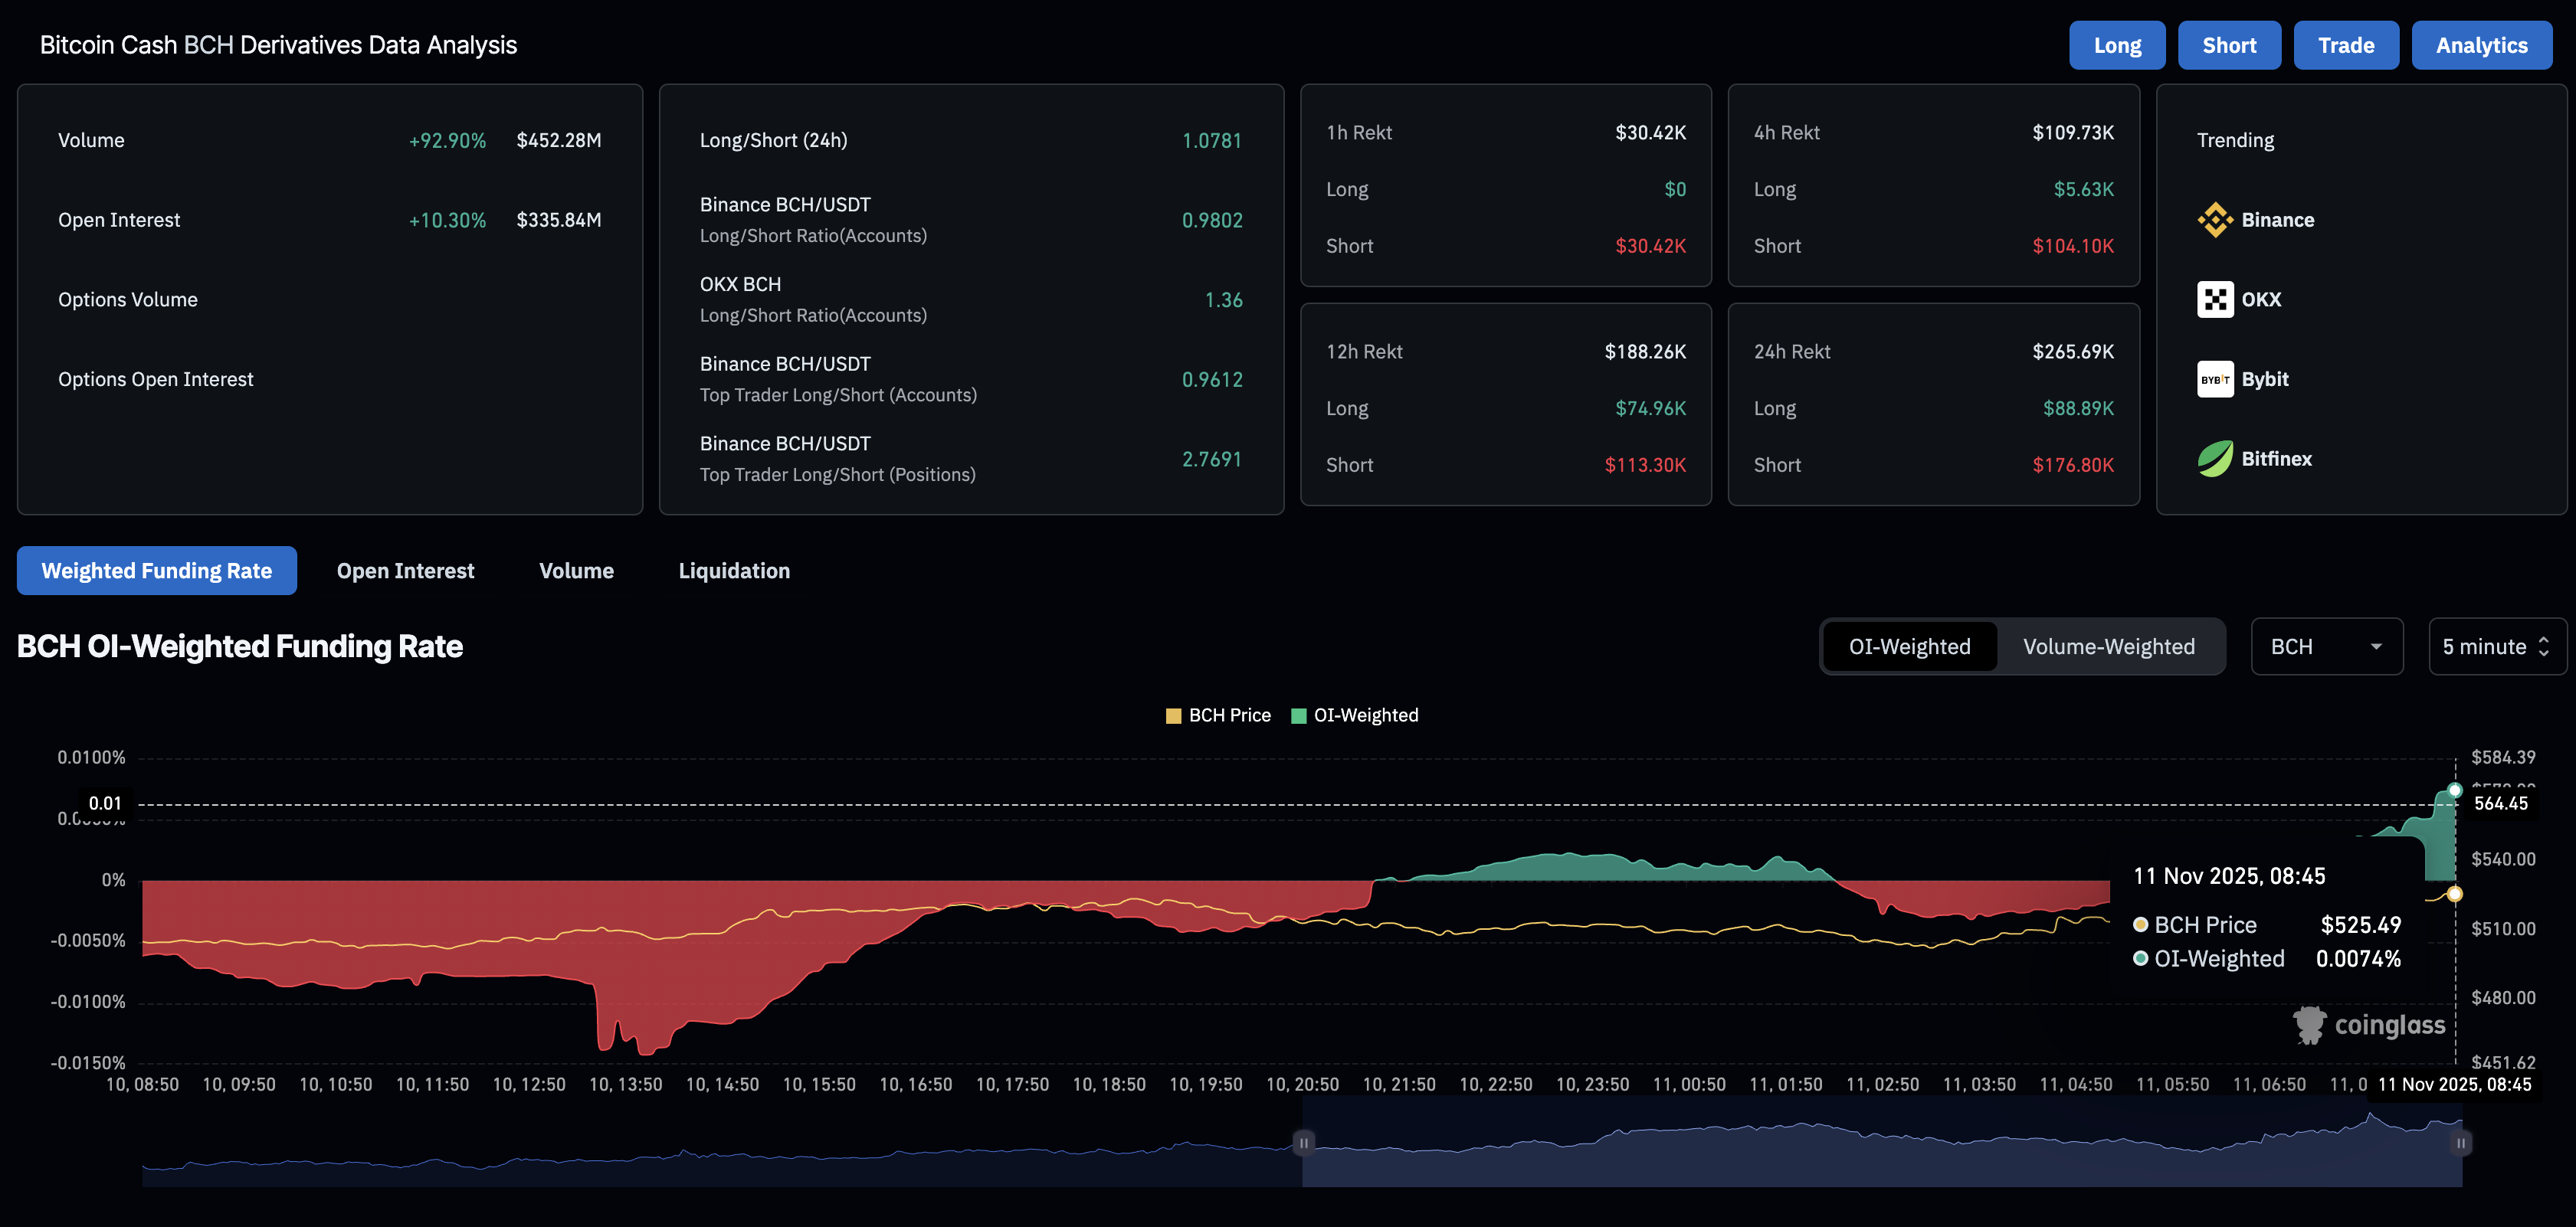
Bitcoin Cash (BCH) price edges higher by 1% at press time on Tuesday, extending the uptrend for the third consecutive day. Derivatives data showcase an increase in capital inflow in BCH futures, suggesting a buy-side dominance.
- Bitcoin Cash crosses above the 200-period EMA, aiming for a key resistance trendline.
- Derivatives data indicate an increase in BCH futures Open Interest, reflecting risk-on sentiment among traders.
- The technical outlook suggests a rise in bullish momentum, supporting upside potential.
Bitcoin Cash (BCH) price edges higher by 1% at press time on Tuesday, extending the uptrend for the third consecutive day. Derivatives data showcase an increase in capital inflow in BCH futures, suggesting a buy-side dominance. The technical outlook for the Bitcoin (BTC) hard fork indicates an increase in bullish momentum, signaling opportunities for further gains.
Market stability boosts demand among BCH traders
The retail interest in BCH is increasing against the backdrop of a potential resolution to the longest US government shutdown, which has lasted over 40 days. CoinGlass data shows that the BCH futures Open Interest (OI) stands at $335.90 million, representing a 10.24% increase over the last 24 hours. This suggests a buy-side bias among traders, resulting in increased risk exposure.
Furthermore, the OI-weighted funding rate has increased to 0.0074% from -0.0032% earlier in the day, indicating that traders are paying a premium to hold long positions, signaling strong confidence.
Technical outlook: Will Bitcoin Cash price hit $600?
Bitcoin Cash’s recovery run on the 4-hour chart forms a local support trendline. BCH extends the rally above the $500 psychological mark, approaching the $527 resistance level, marked by the October 15 high.
A decisive close above this level could target the local resistance trendline formed by connecting the highs of October 5 and October 28, near $557. If the recovery surpasses the trendline, the swing highs that form the trendline — $580 and $613 — could serve as immediate resistance.
The momentum indicators on the 4-hour chart indicate a surge in bullish momentum as the Moving Average Convergence Divergence (MACD) and the signal line hold a steady upward trend crossing above the zero line. At the same time, the Relative Strength Index (RSI) at 63 suggests a consistent increase in buying pressure supporting the recovery run.
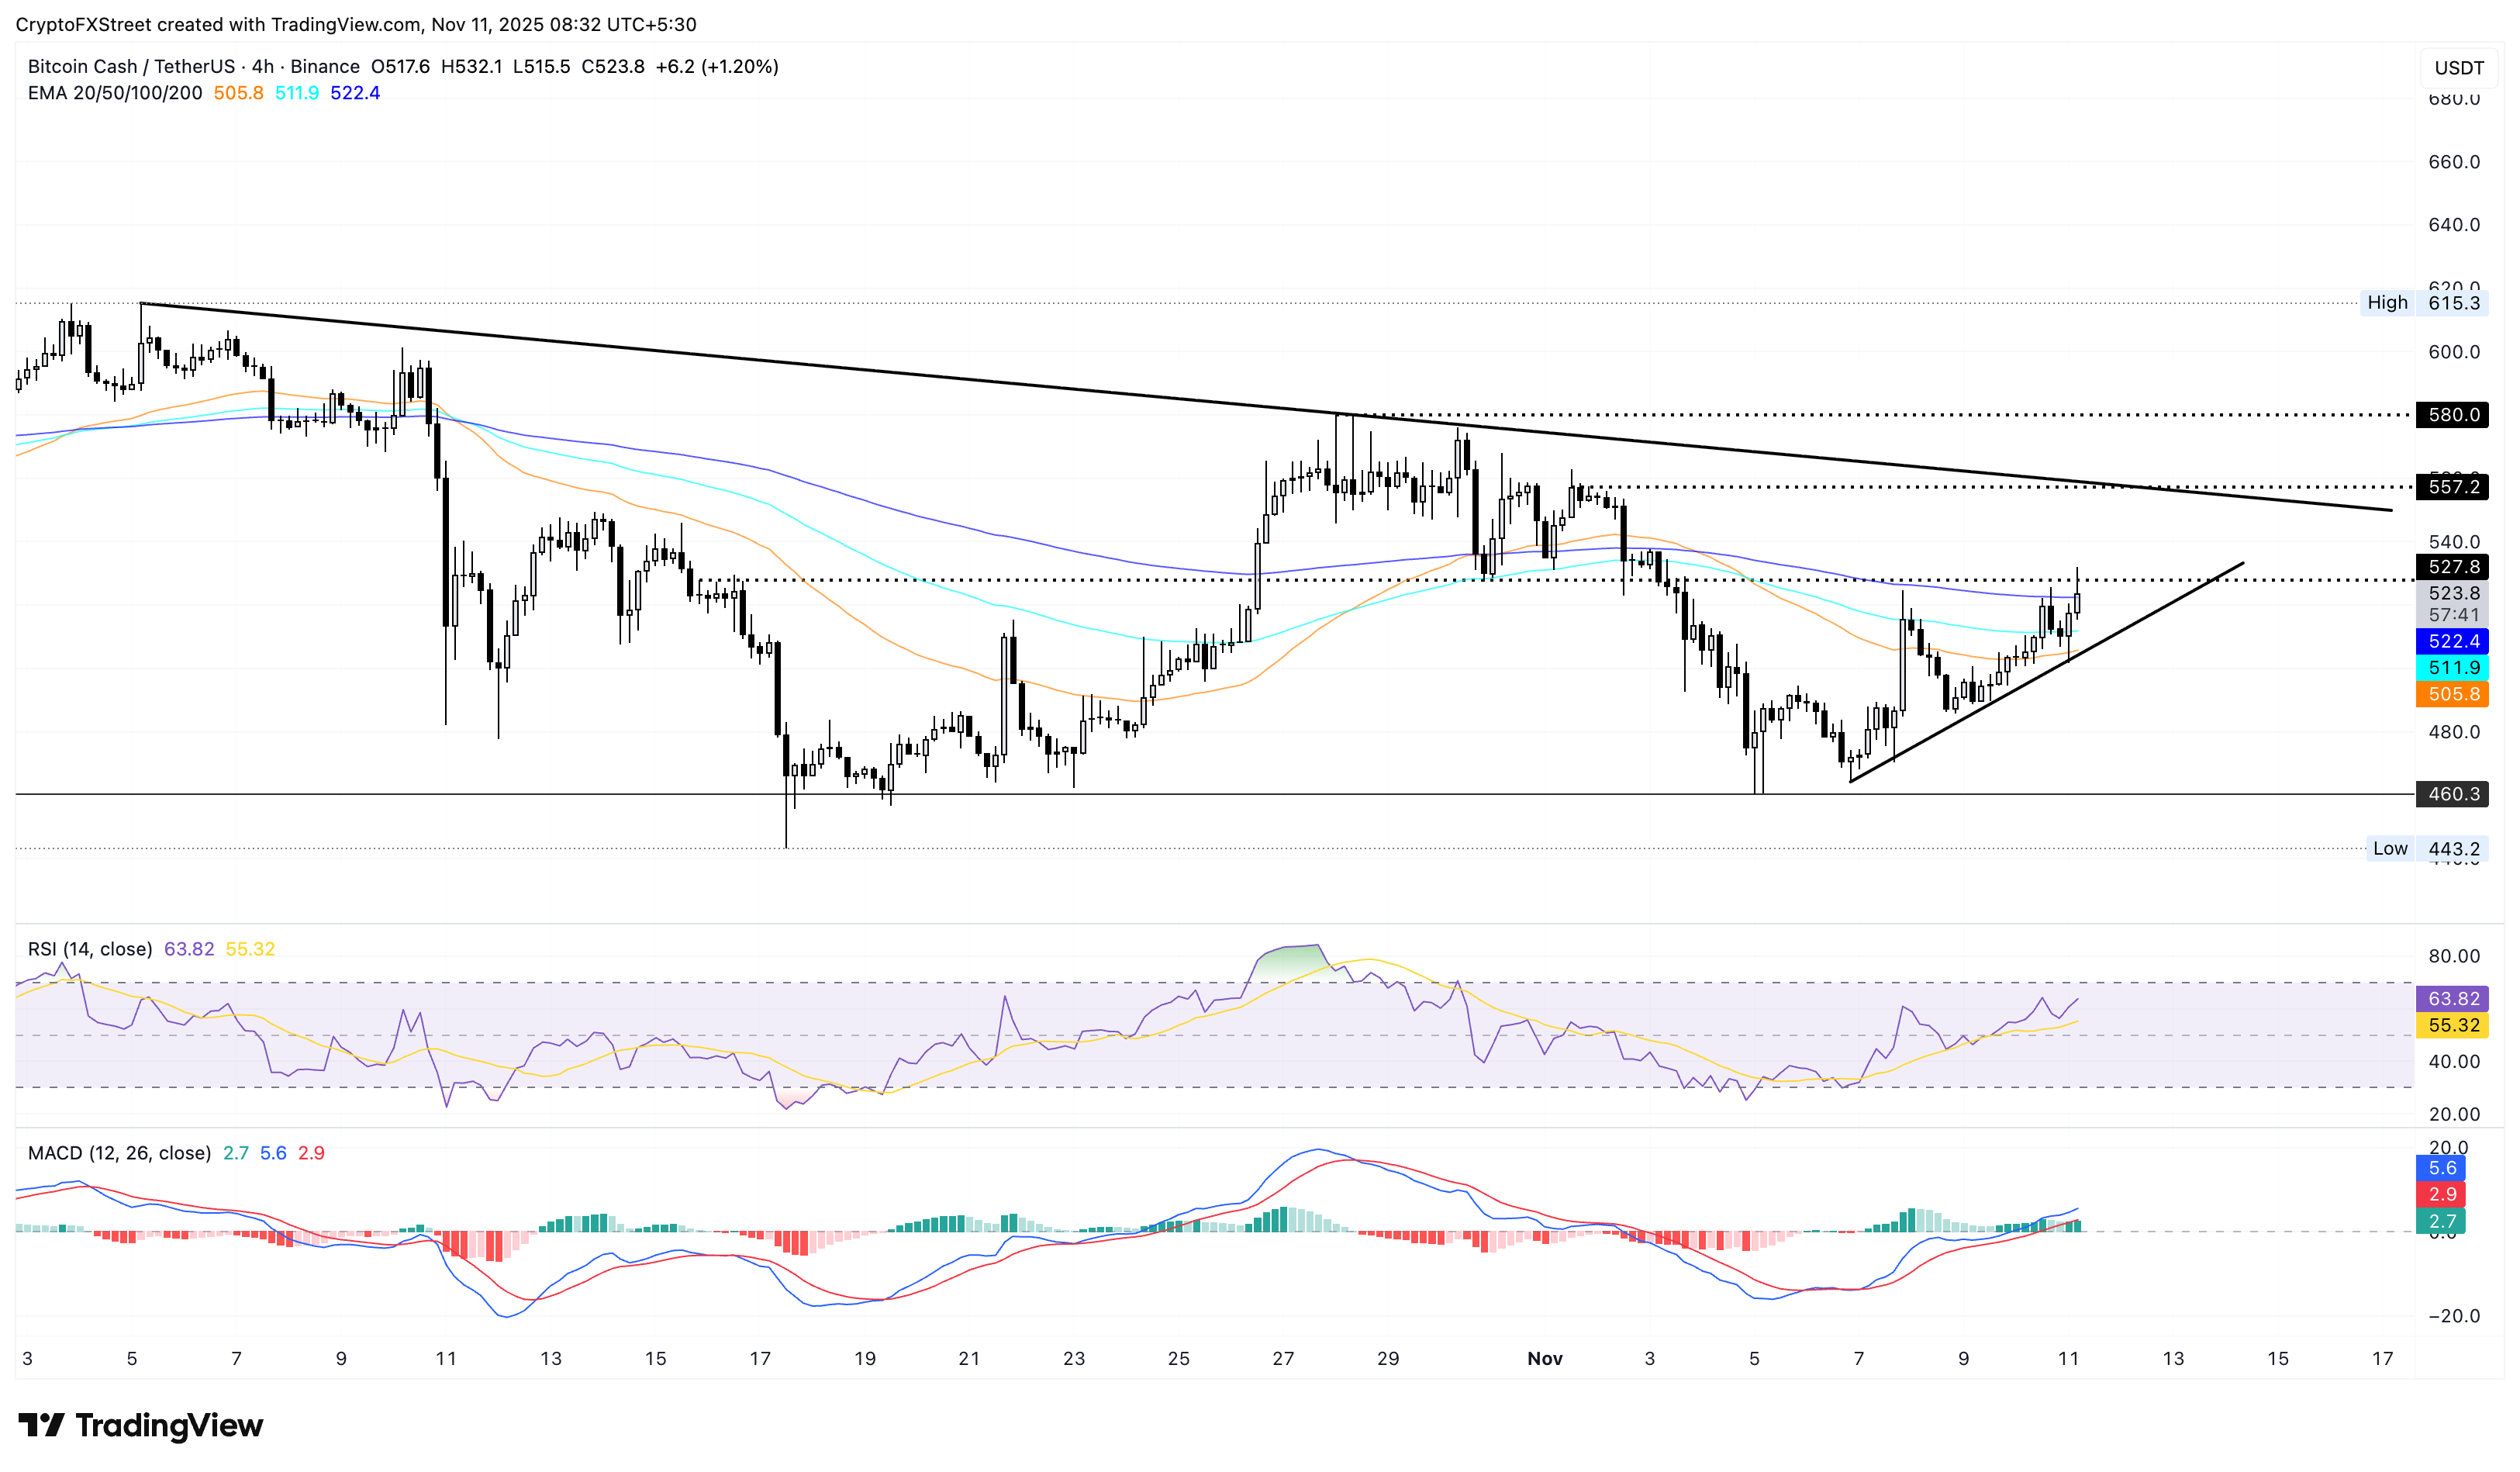
Looking at the downside, the 50-day EMA at $505 and the $500 psychological level are crucial supports for Bitcoin Cash. If BCH slips below $500, it would nullify the breakout chances and threaten the $460 support floor, formed on Wednesday.

FXStreet
Plus d’un million d’utilisateurs se tournent vers FXStreet pour des données de marché en temps réel, des outils de graphiques, des analyses d’experts et des actualités Forex. Leur calendrier économique complet et leurs webinaires éducatifs aident les traders à rester informés et à prendre des décisions éclairées. FXStreet s’appuie sur une équipe d’environ 60 professionnels répartis entre le siège de Barcelone et diverses régions du monde.
Read More


