
BNB Price Forecast: BNB loses strength as crypto market drops
Par Vishal Dixit
Date de publication: 21 Jan 2026 | Date de modification: 21 Jan 2026


ARTICLES POPULAIRES

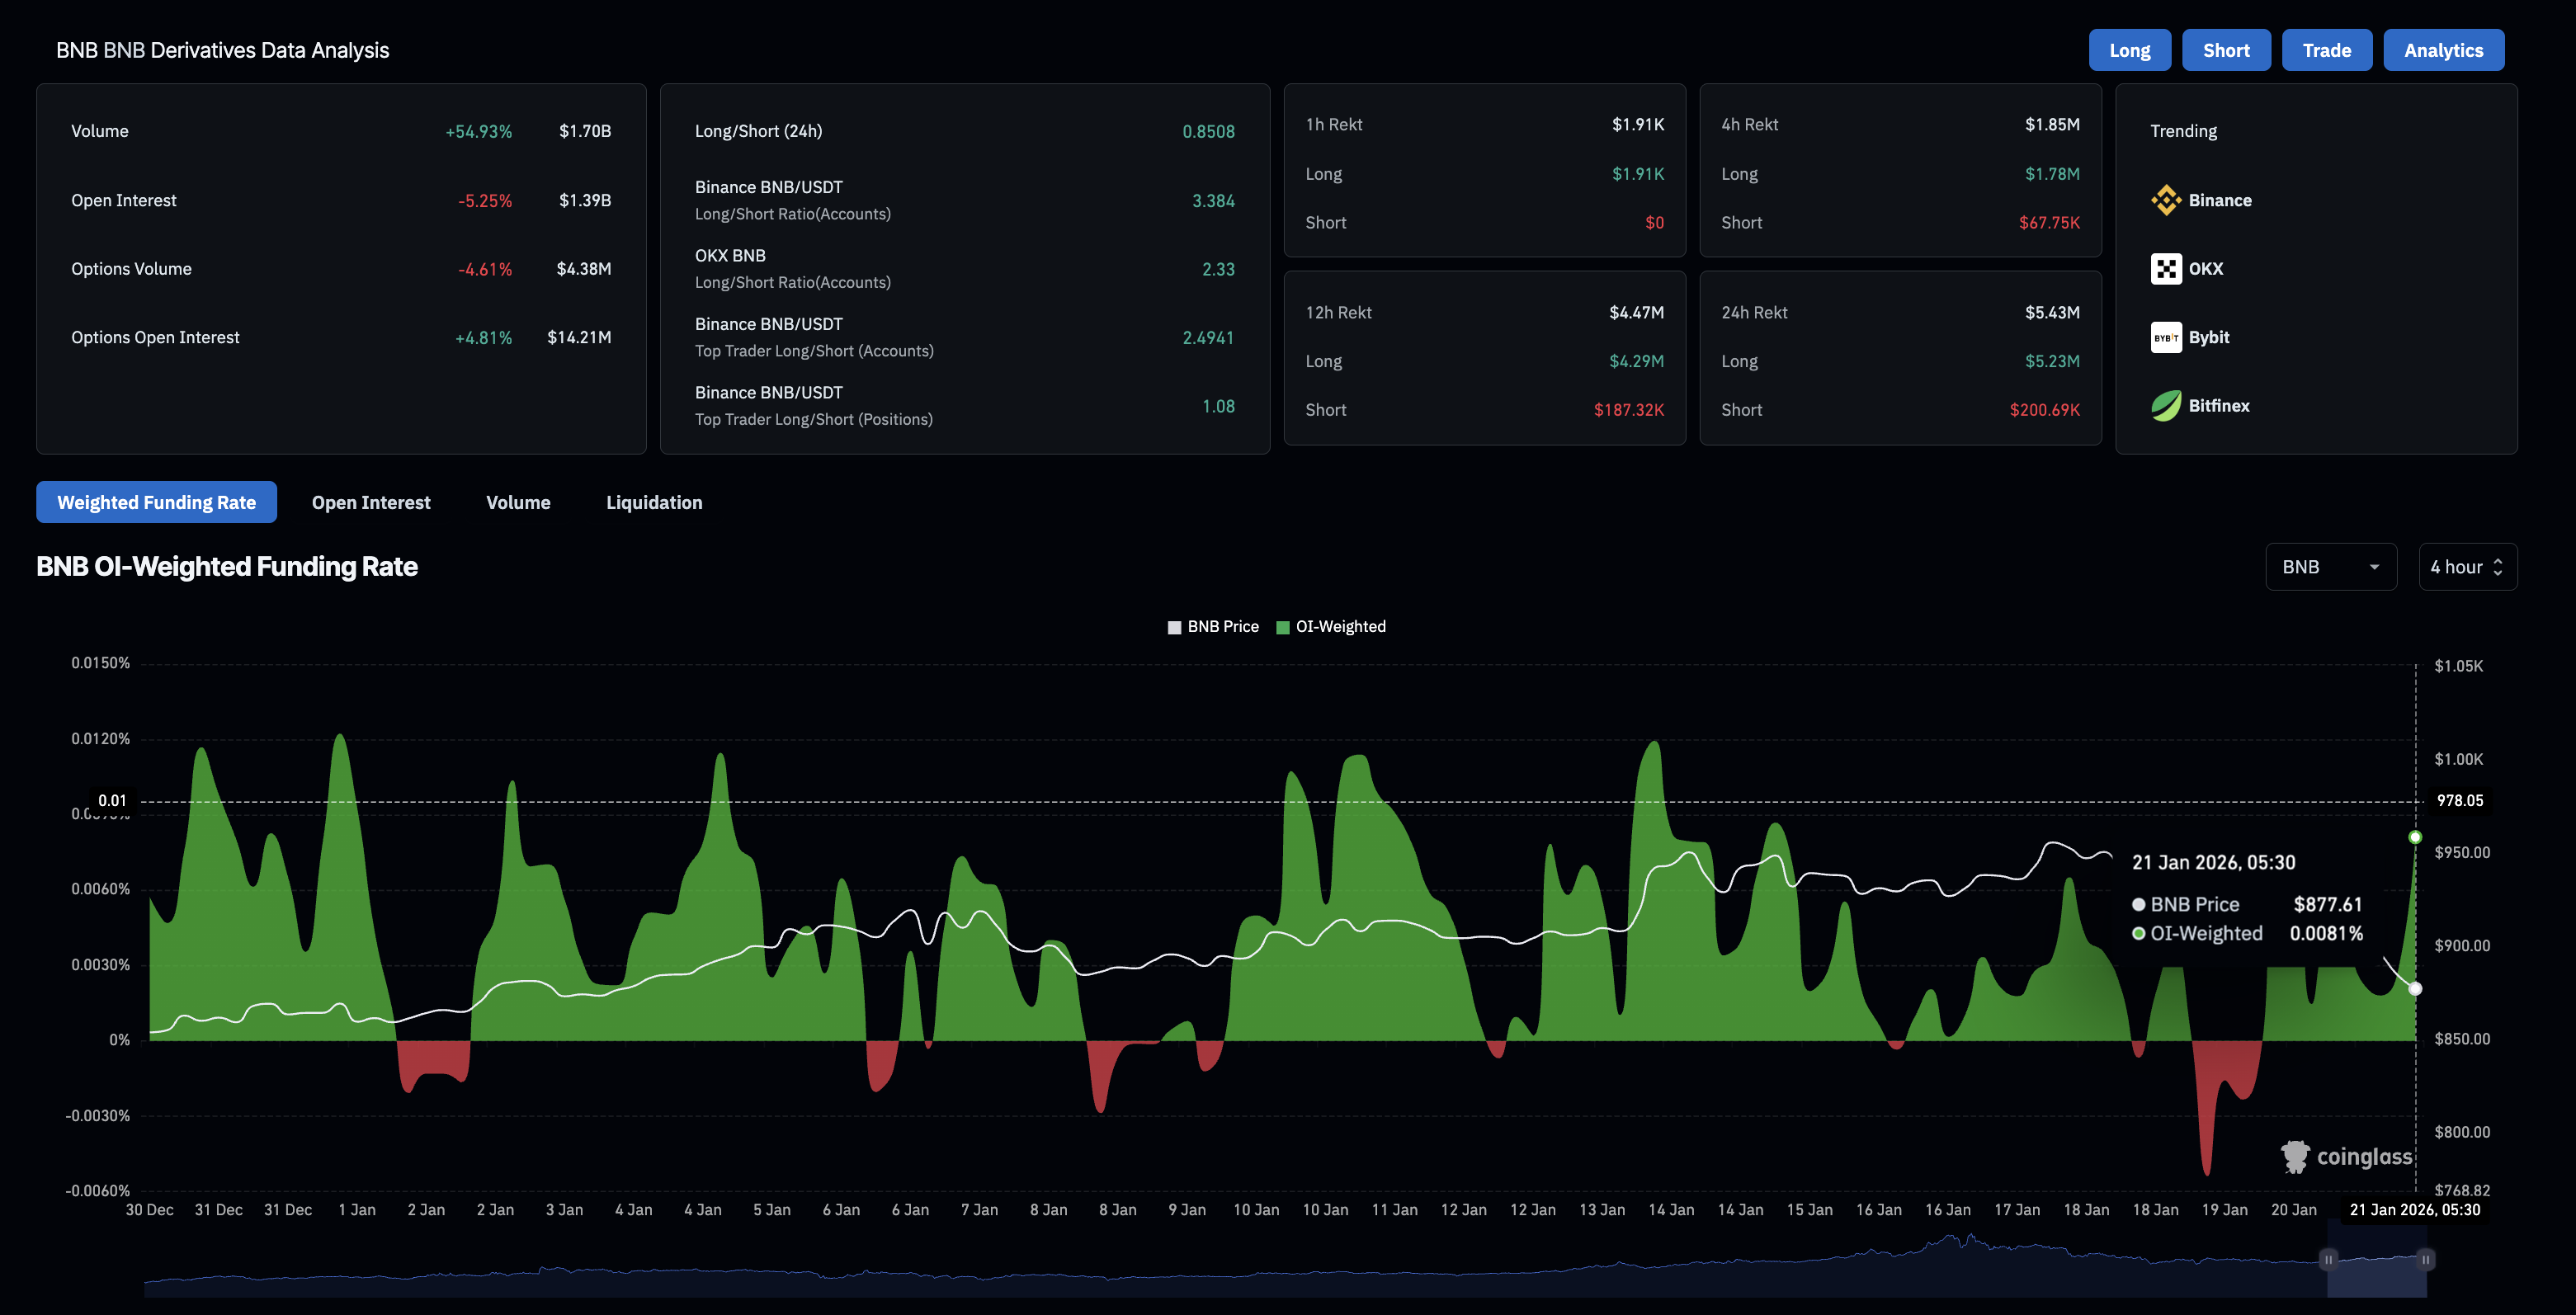
BNB (formerly Binance Coin) loses ground as the broader cryptocurrency market falls, recording a 1% drop at the time of writing on Wednesday. Retail interest in the exchange token is declining, as evidenced by the massive wipeout of long positions and a decline in futures Open Interest.
- BNB edges lower by nearly 1% on Wednesday, extending the decline below the 200-day EMA.
- Derivatives data signals increased long liquidations and over 5% reduction in Open Interest, indicating a bearish shift in sentiment.
- The path of least resistance for BNB signals further downside risk toward $800.
BNB (formerly Binance Coin) loses ground as the broader cryptocurrency market falls, recording a 1% drop at the time of writing on Wednesday. Retail interest in the exchange token is declining, as evidenced by the massive wipeout of long positions and a decline in futures Open Interest. The technical outlook for BNB suggests further downside risk, as momentum indicators flash a sell signal.
Retail sentiment dims amid large liquidations
CoinGlass data shows that BNB Open Interest dropped by 5.25% to $1.39 billion over the last 24 hours, suggesting a decline in the value of outstanding futures contracts as traders close positions or reduce leverage.
A surge in long liquidations to $5.23 million over the last 24 hours, outpacing short liquidations of $220,690 by a wide margin, suggests that the wipeout of mostly bullish positions reduced capital exposure in BNB futures.
Technical outlook: Will BNB price crash to $800?
BNB price holds marginally below the 200-day Exponential Moving Average (EMA) at $883, while the 50-day EMA at $902 is sloping downward, suggesting a potential Death Cross.
The Moving Average Convergence Divergence (MACD) slips below the red line, races toward zero, widens the negative histogram, and suggests a surge in bearish momentum.
The Relative Strength Index (RSI) is at 42, crossing below the halfway line, indicating a surge in bearish momentum.
To reinstate an upward trend, BNB should resurface above the 200-day EMA at $883, which would improve the upside bias and target the 50-day EMA at $902.
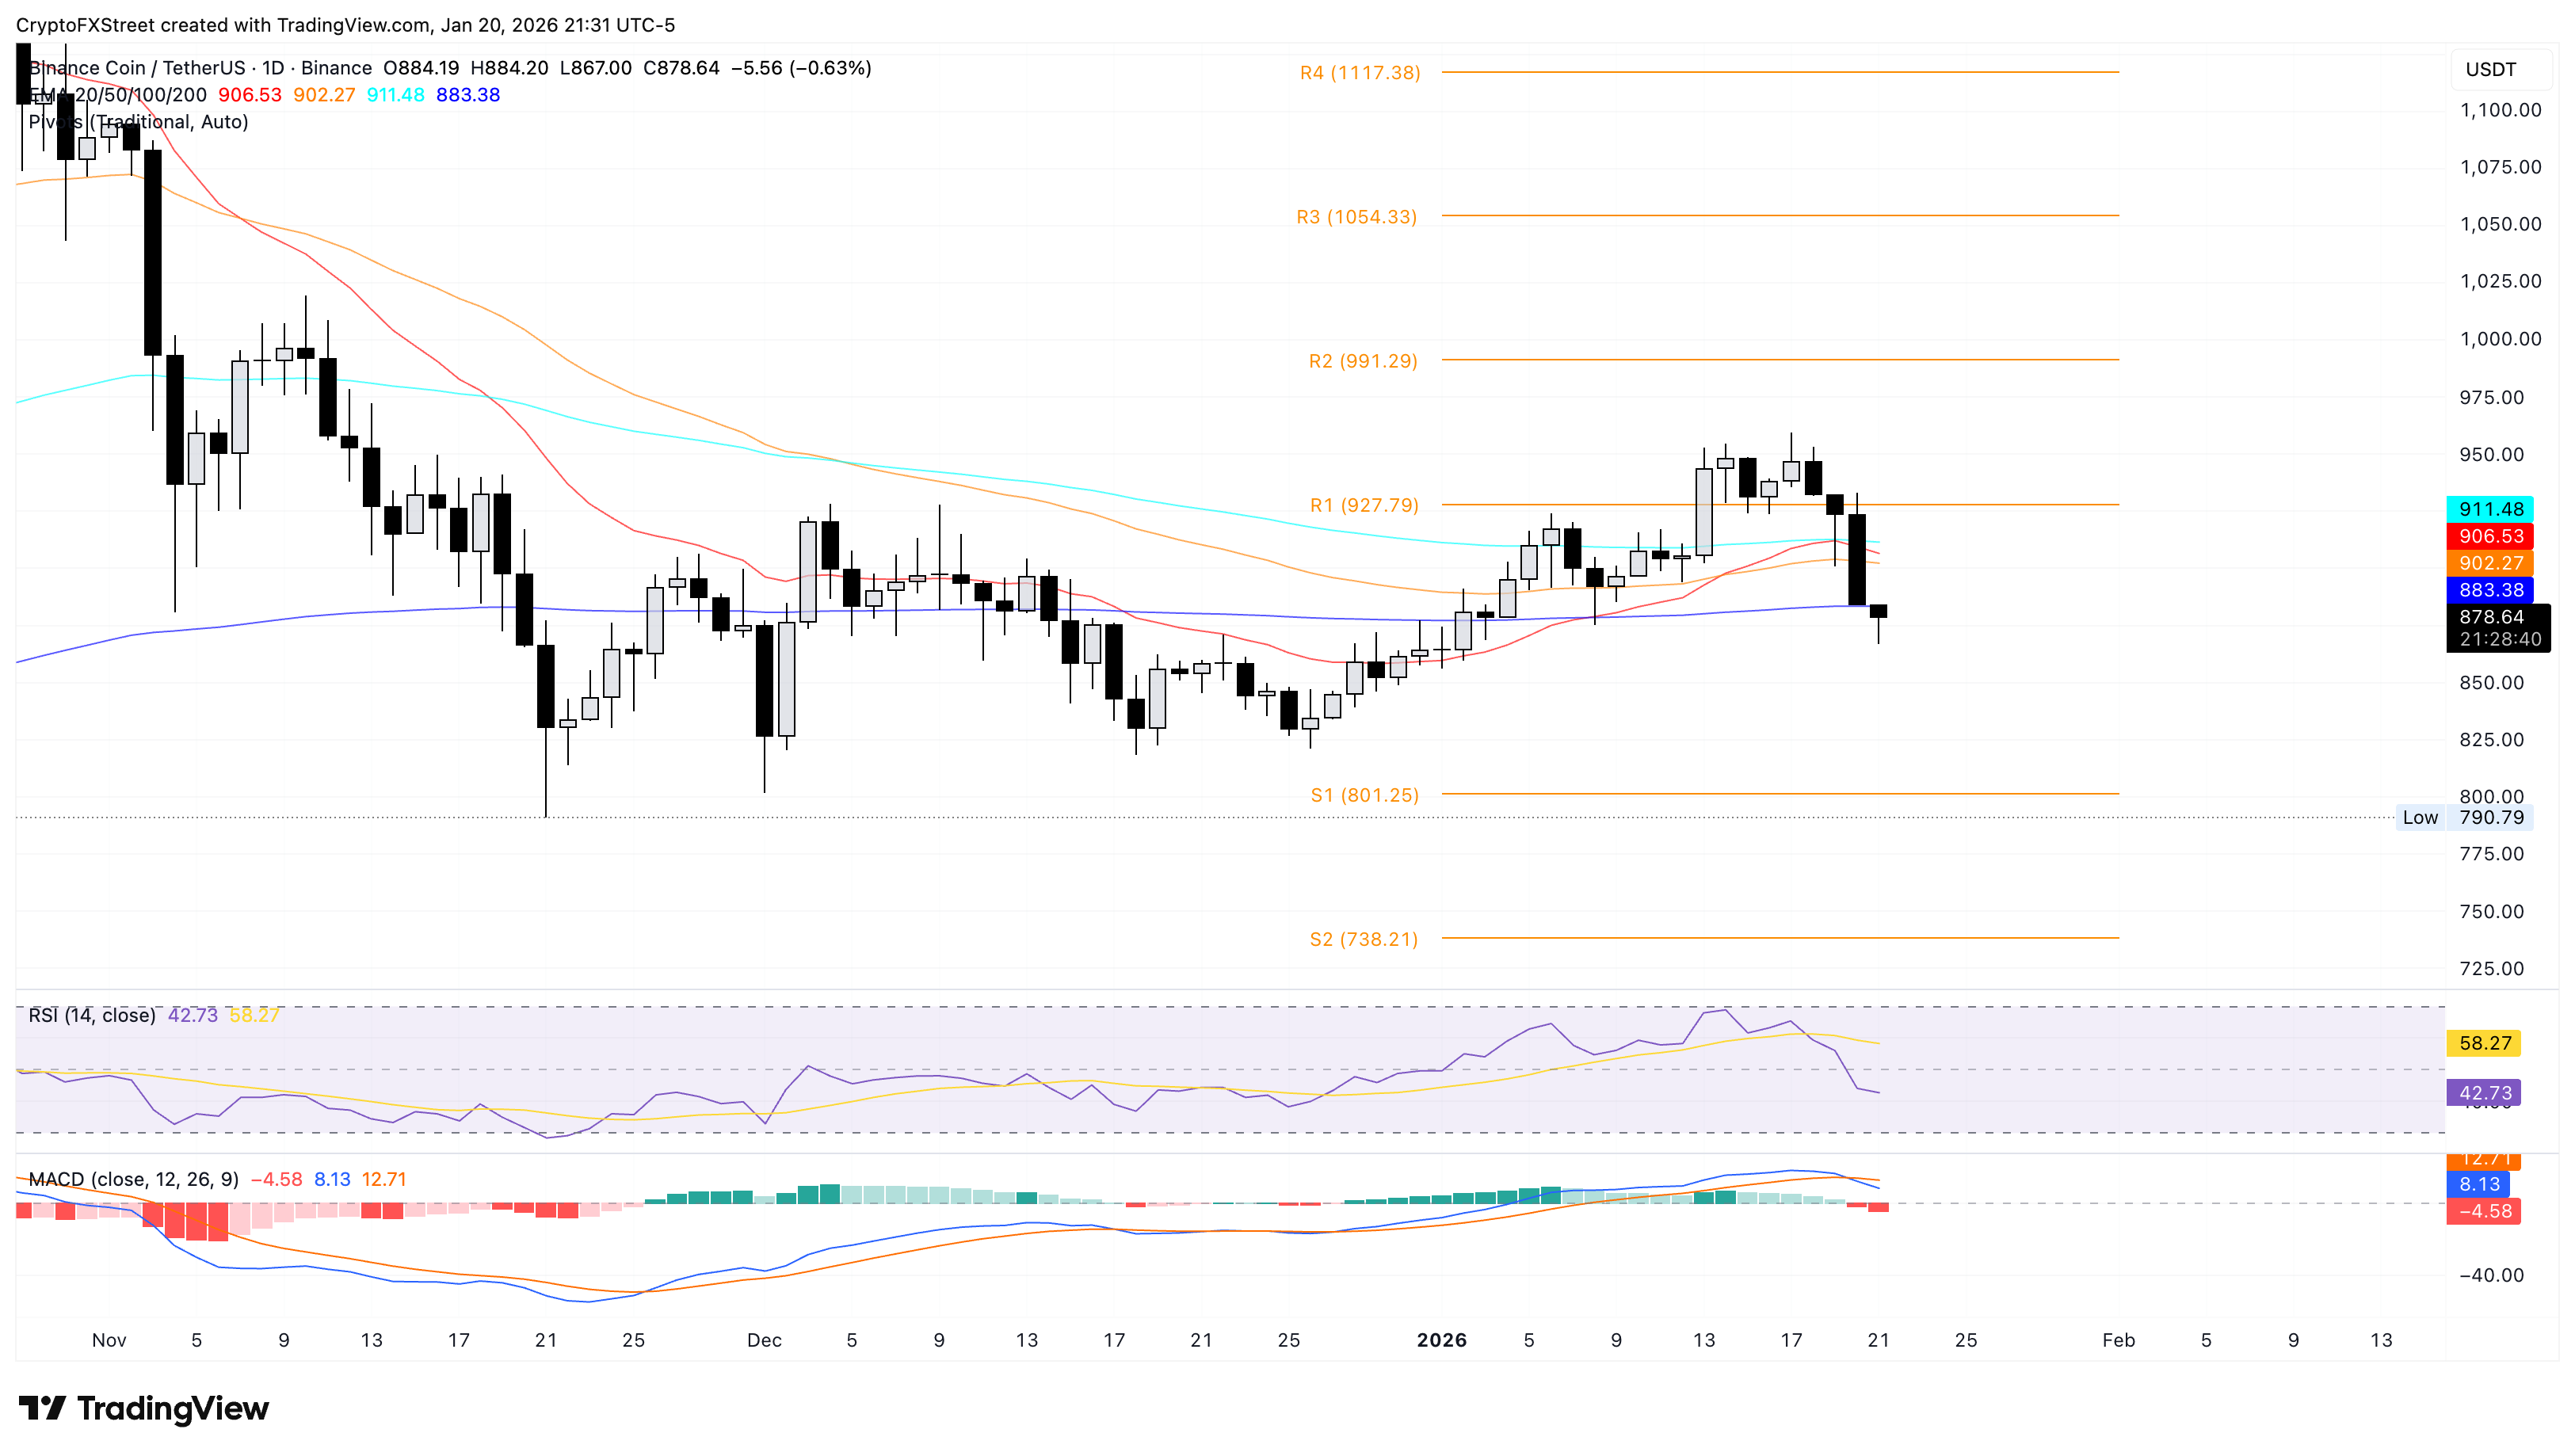
However, the path of least resistance targets the S1 Pivot Point at $801, consistent with the bearish shift in momentum.
(The technical analysis of this story was written with the help of an AI tool.)

Plus d’un million d’utilisateurs se tournent vers FXStreet pour des données de marché en temps réel, des outils de graphiques, des analyses d’experts et des actualités Forex. Leur calendrier économique complet et leurs webinaires éducatifs aident les traders à rester informés et à prendre des décisions éclairées. FXStreet s’appuie sur une équipe d’environ 60 professionnels répartis entre le siège de Barcelone et diverses régions du monde.
Lire la suite


