
Trade The World
Bonk Price Forecast: Bull run potential sparks amid wedge breakout, token burn plans
Par Vishal Dixit
Date de publication: 8 Sep 2025 | Date de modification: 8 Sep 2025


POPULAR ARTICLES

Bonk (BONK) trades above $0.00002100 level at press time on Monday, extending Sunday’s recovery to challenge the 200-day Exponential Moving Average (EMA). A falling wedge pattern breakout backed by a surge of interest among derivatives traders suggests an extended rally in BONK.
- Bonk extends the falling wedge pattern breakout by 2% on Monday, targeting the 200-day EMA.
- The derivative data suggests a surge in bullish sentiment among traders.
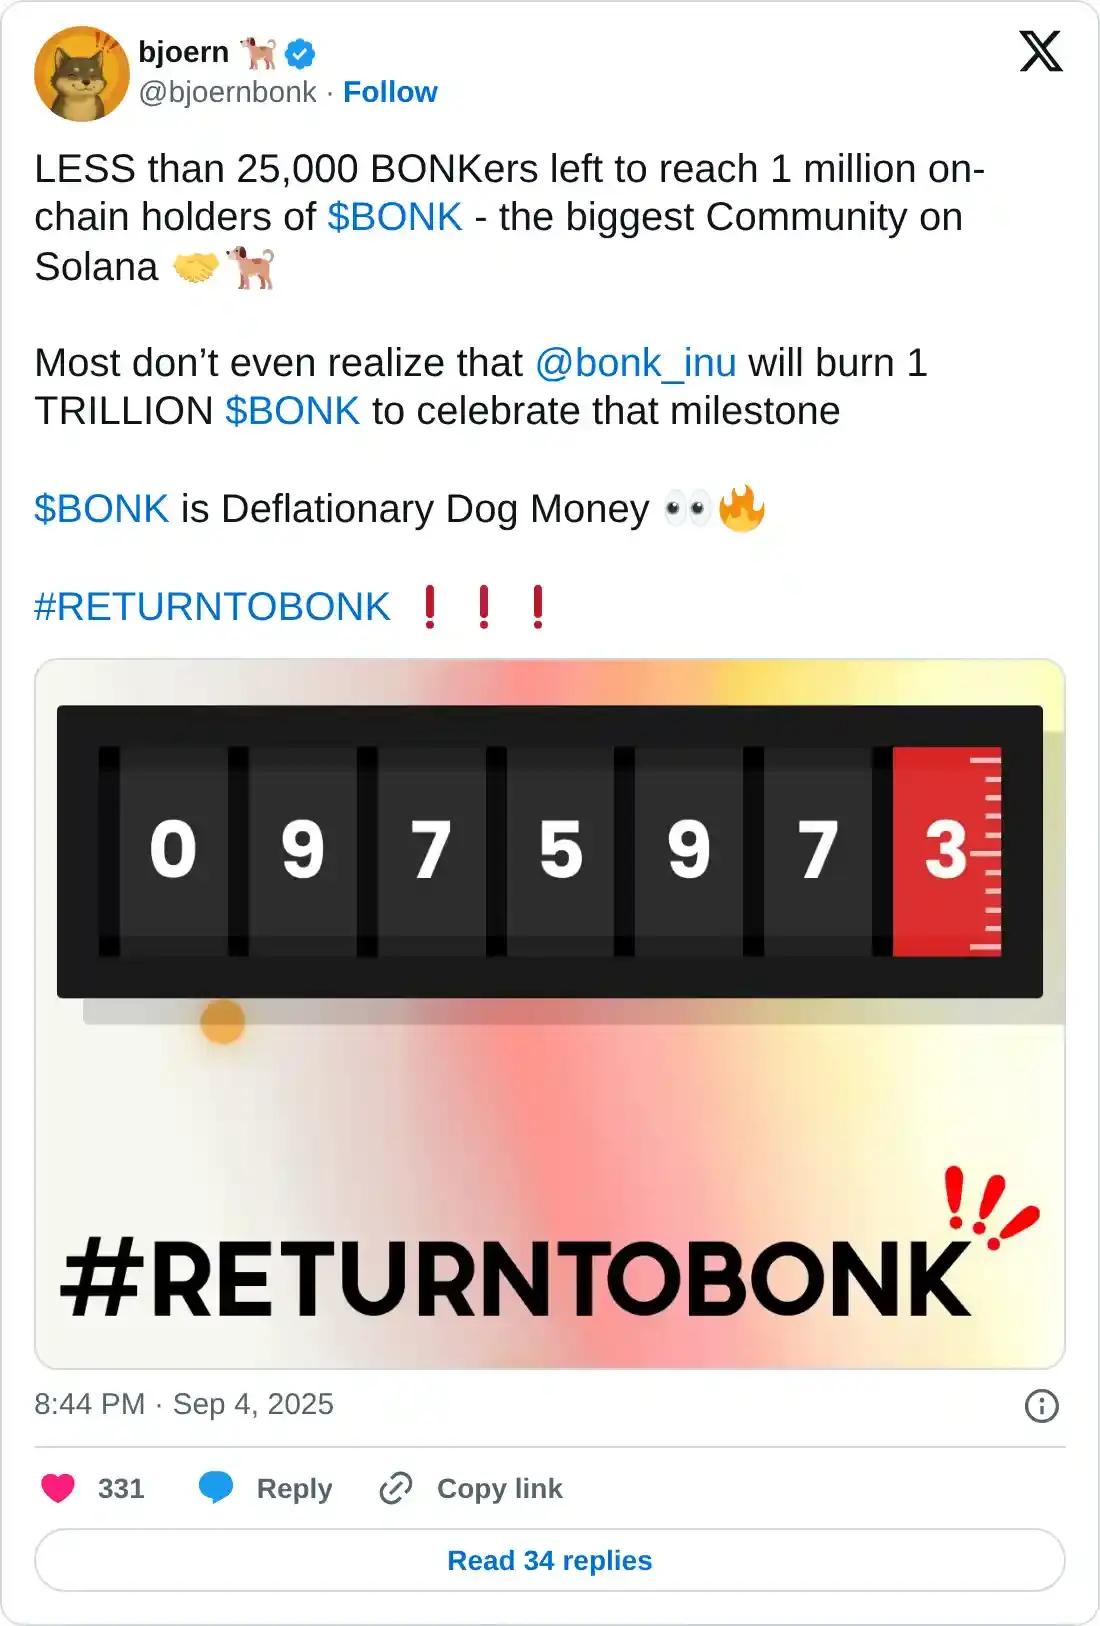
- Bonk prepares to burn a trillion tokens as on-chain holders count approaches 1 million.
Bonk (BONK) trades above $0.00002100 level at press time on Monday, extending Sunday’s recovery to challenge the 200-day Exponential Moving Average (EMA). A falling wedge pattern breakout backed by a surge of interest among derivatives traders suggests an extended rally in BONK. Additionally, the team plans to burn 1 trillion tokens when the on-chain holders count hits 1 million, which could result in a lower supply, fueling the retail demand.
Derivatives data points to rising bullish anticipation
CoinGlass data shows that the BONK Open Interest (OI) has increased by 9.53% in the last 24 hours, reaching $30.71 million. This surge in OI refers to increased capital inflows in the Bonk derivatives.
The OI-weighted funding rate at 0.0105%, down from 0.0111% on Sunday, suggests a minor decline in the bullish intent of derivative traders. Funding rates, when positive, are premiums paid by bulls to align spot and derivative market prices and offset the leverage-driven imbalance.
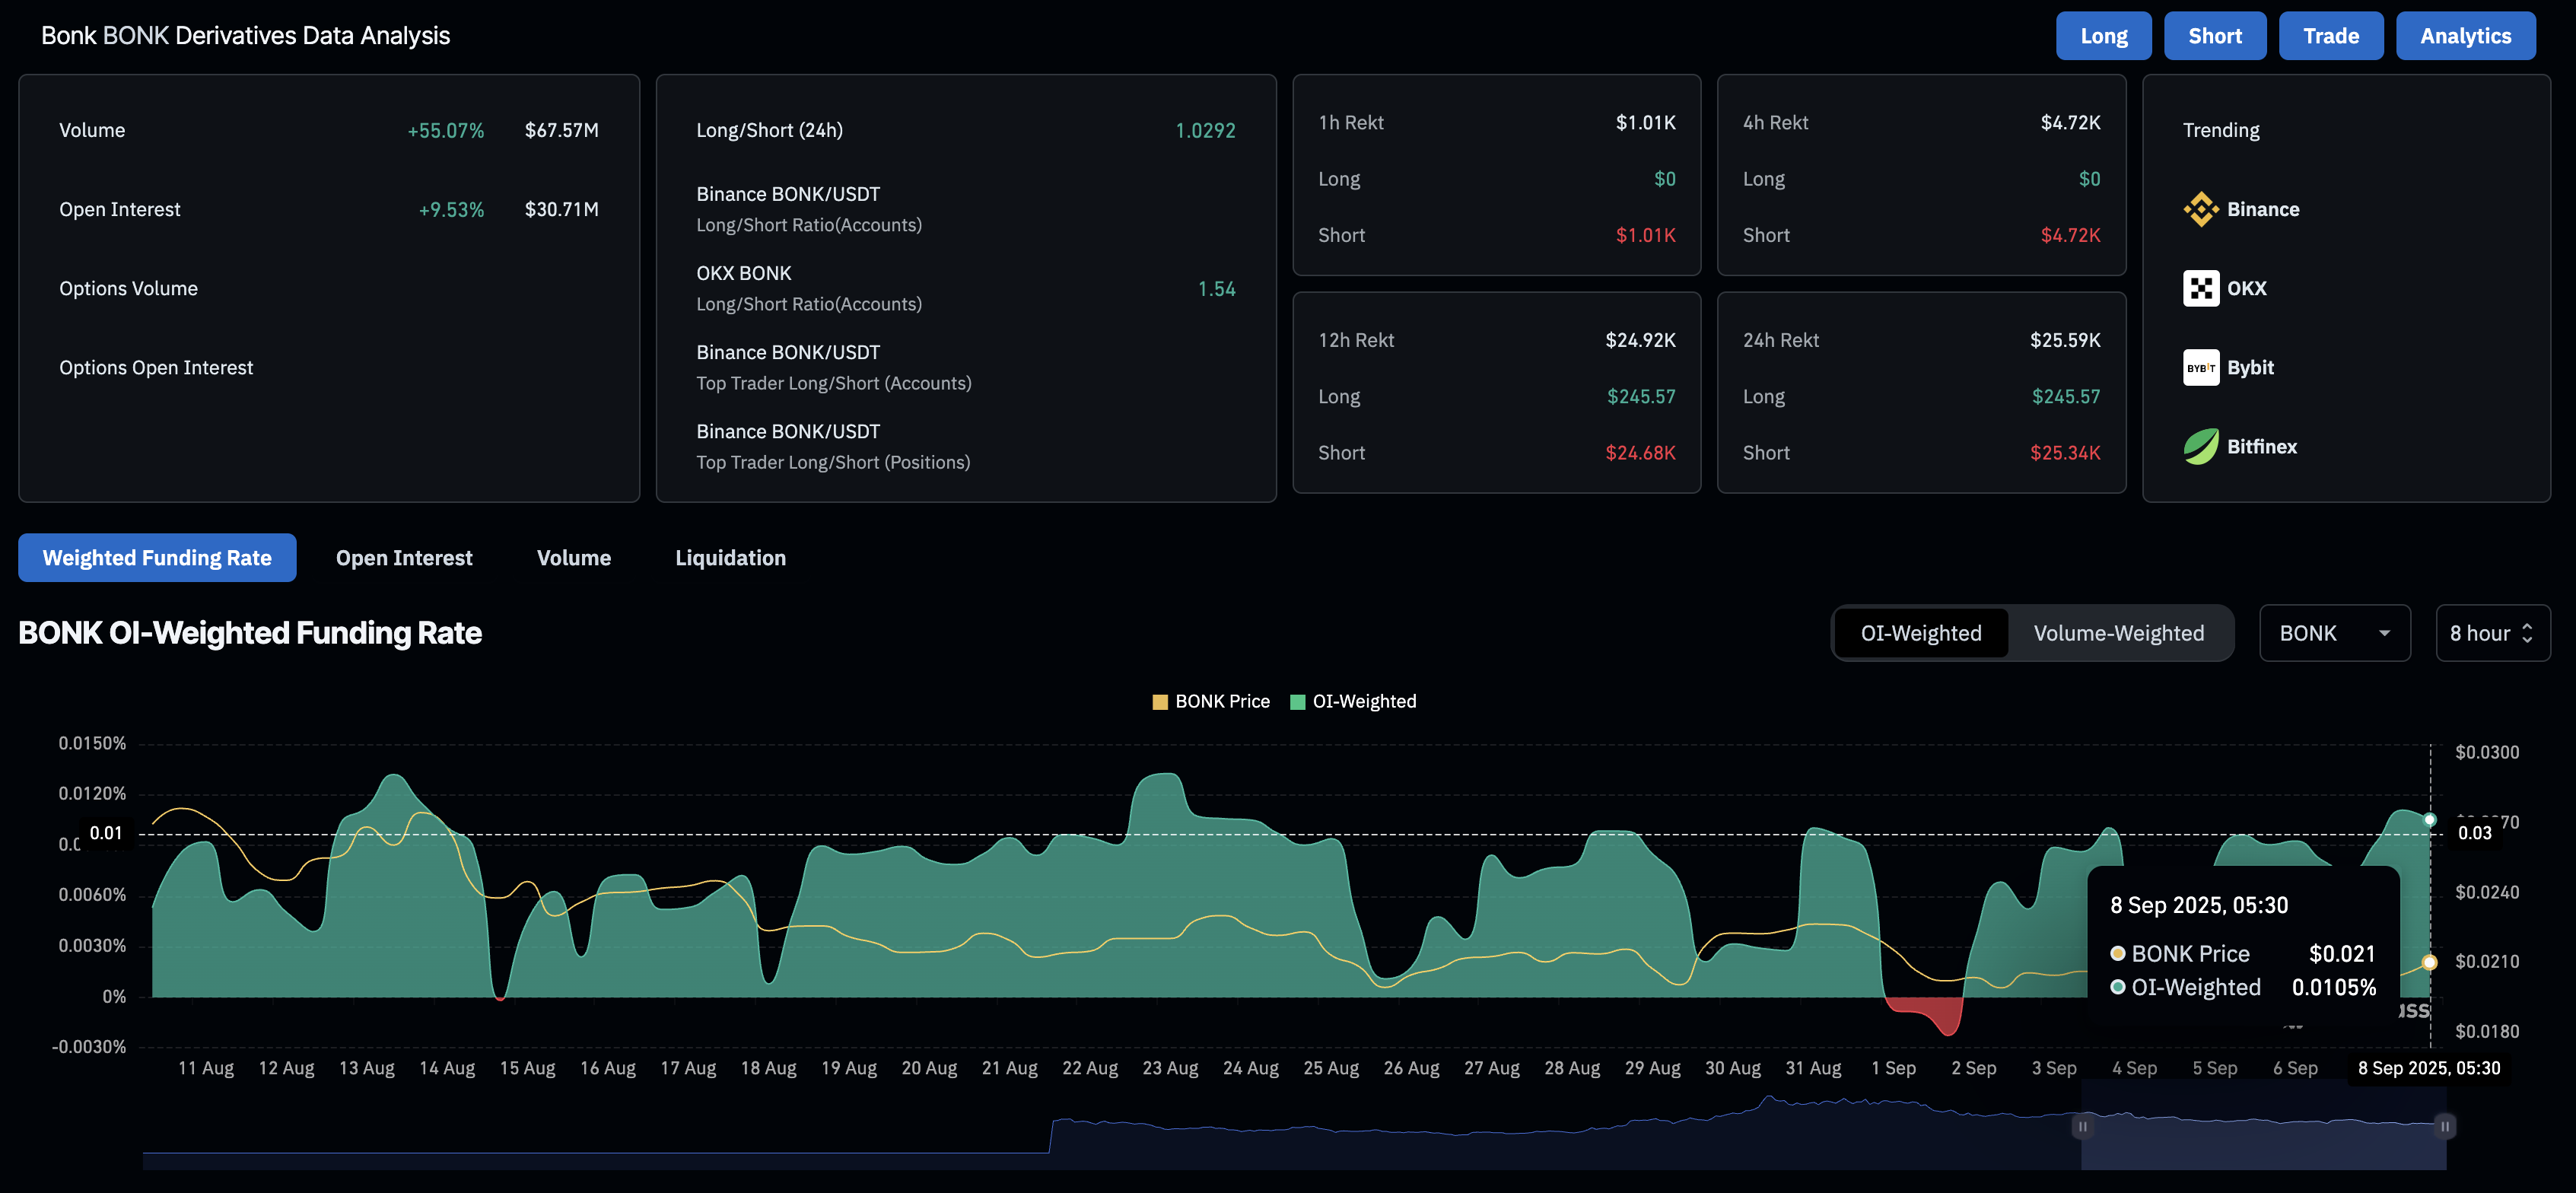
BONK derivatives. Source: CoinGlass
Token burn plans could increase demand for BONK
The on-chain BONK holders count inches closer to 1 million, indicating that the community is gradually expanding towards a new milestone. Bonk team plans to burn 1 trillion tokens once the community hits the 1 million mark. This will account for a 1.23% decline in the current circulating supply of 81.06 trillion.
Typically, a reduction in supply leads to a demand surge that could catalyze a rally in the spot market.
BONK wedge breakout signals a potential trend reversal
BONK edges higher by 3% at press time on Monday, extending the 5.58% rise from the previous day. The deflationary dog-themed meme coin has marked a falling wedge pattern breakout on the daily chart, rising to the 200-day EMA at $0.00002169.
If the meme coin marks a decisive close above this average line, it could target the 50% Fibonacci retracement level at $0.00002350, drawn from $0.00006230 high on November 20, 2024, to $0.00000886 low on April 7. To reinforce a fresh bull run, the uptrend should overcome the halfway level, which could target the 61.8% Fibonacci level at $0.00002958.
The technical indicators suggest a bullish shift in trend momentum on the daily chart as the Moving Average Convergence Divergence (MACD) line diverges from its signal line on the upside, catalyzing a surge in green histogram bars from the zero line. This indicates a rise in trend momentum.
Additionally, the Relative Strength Index (RSI) at 48 rises towards the neutral from lower levels. This positive shift indicates increased demand for the meme coin.
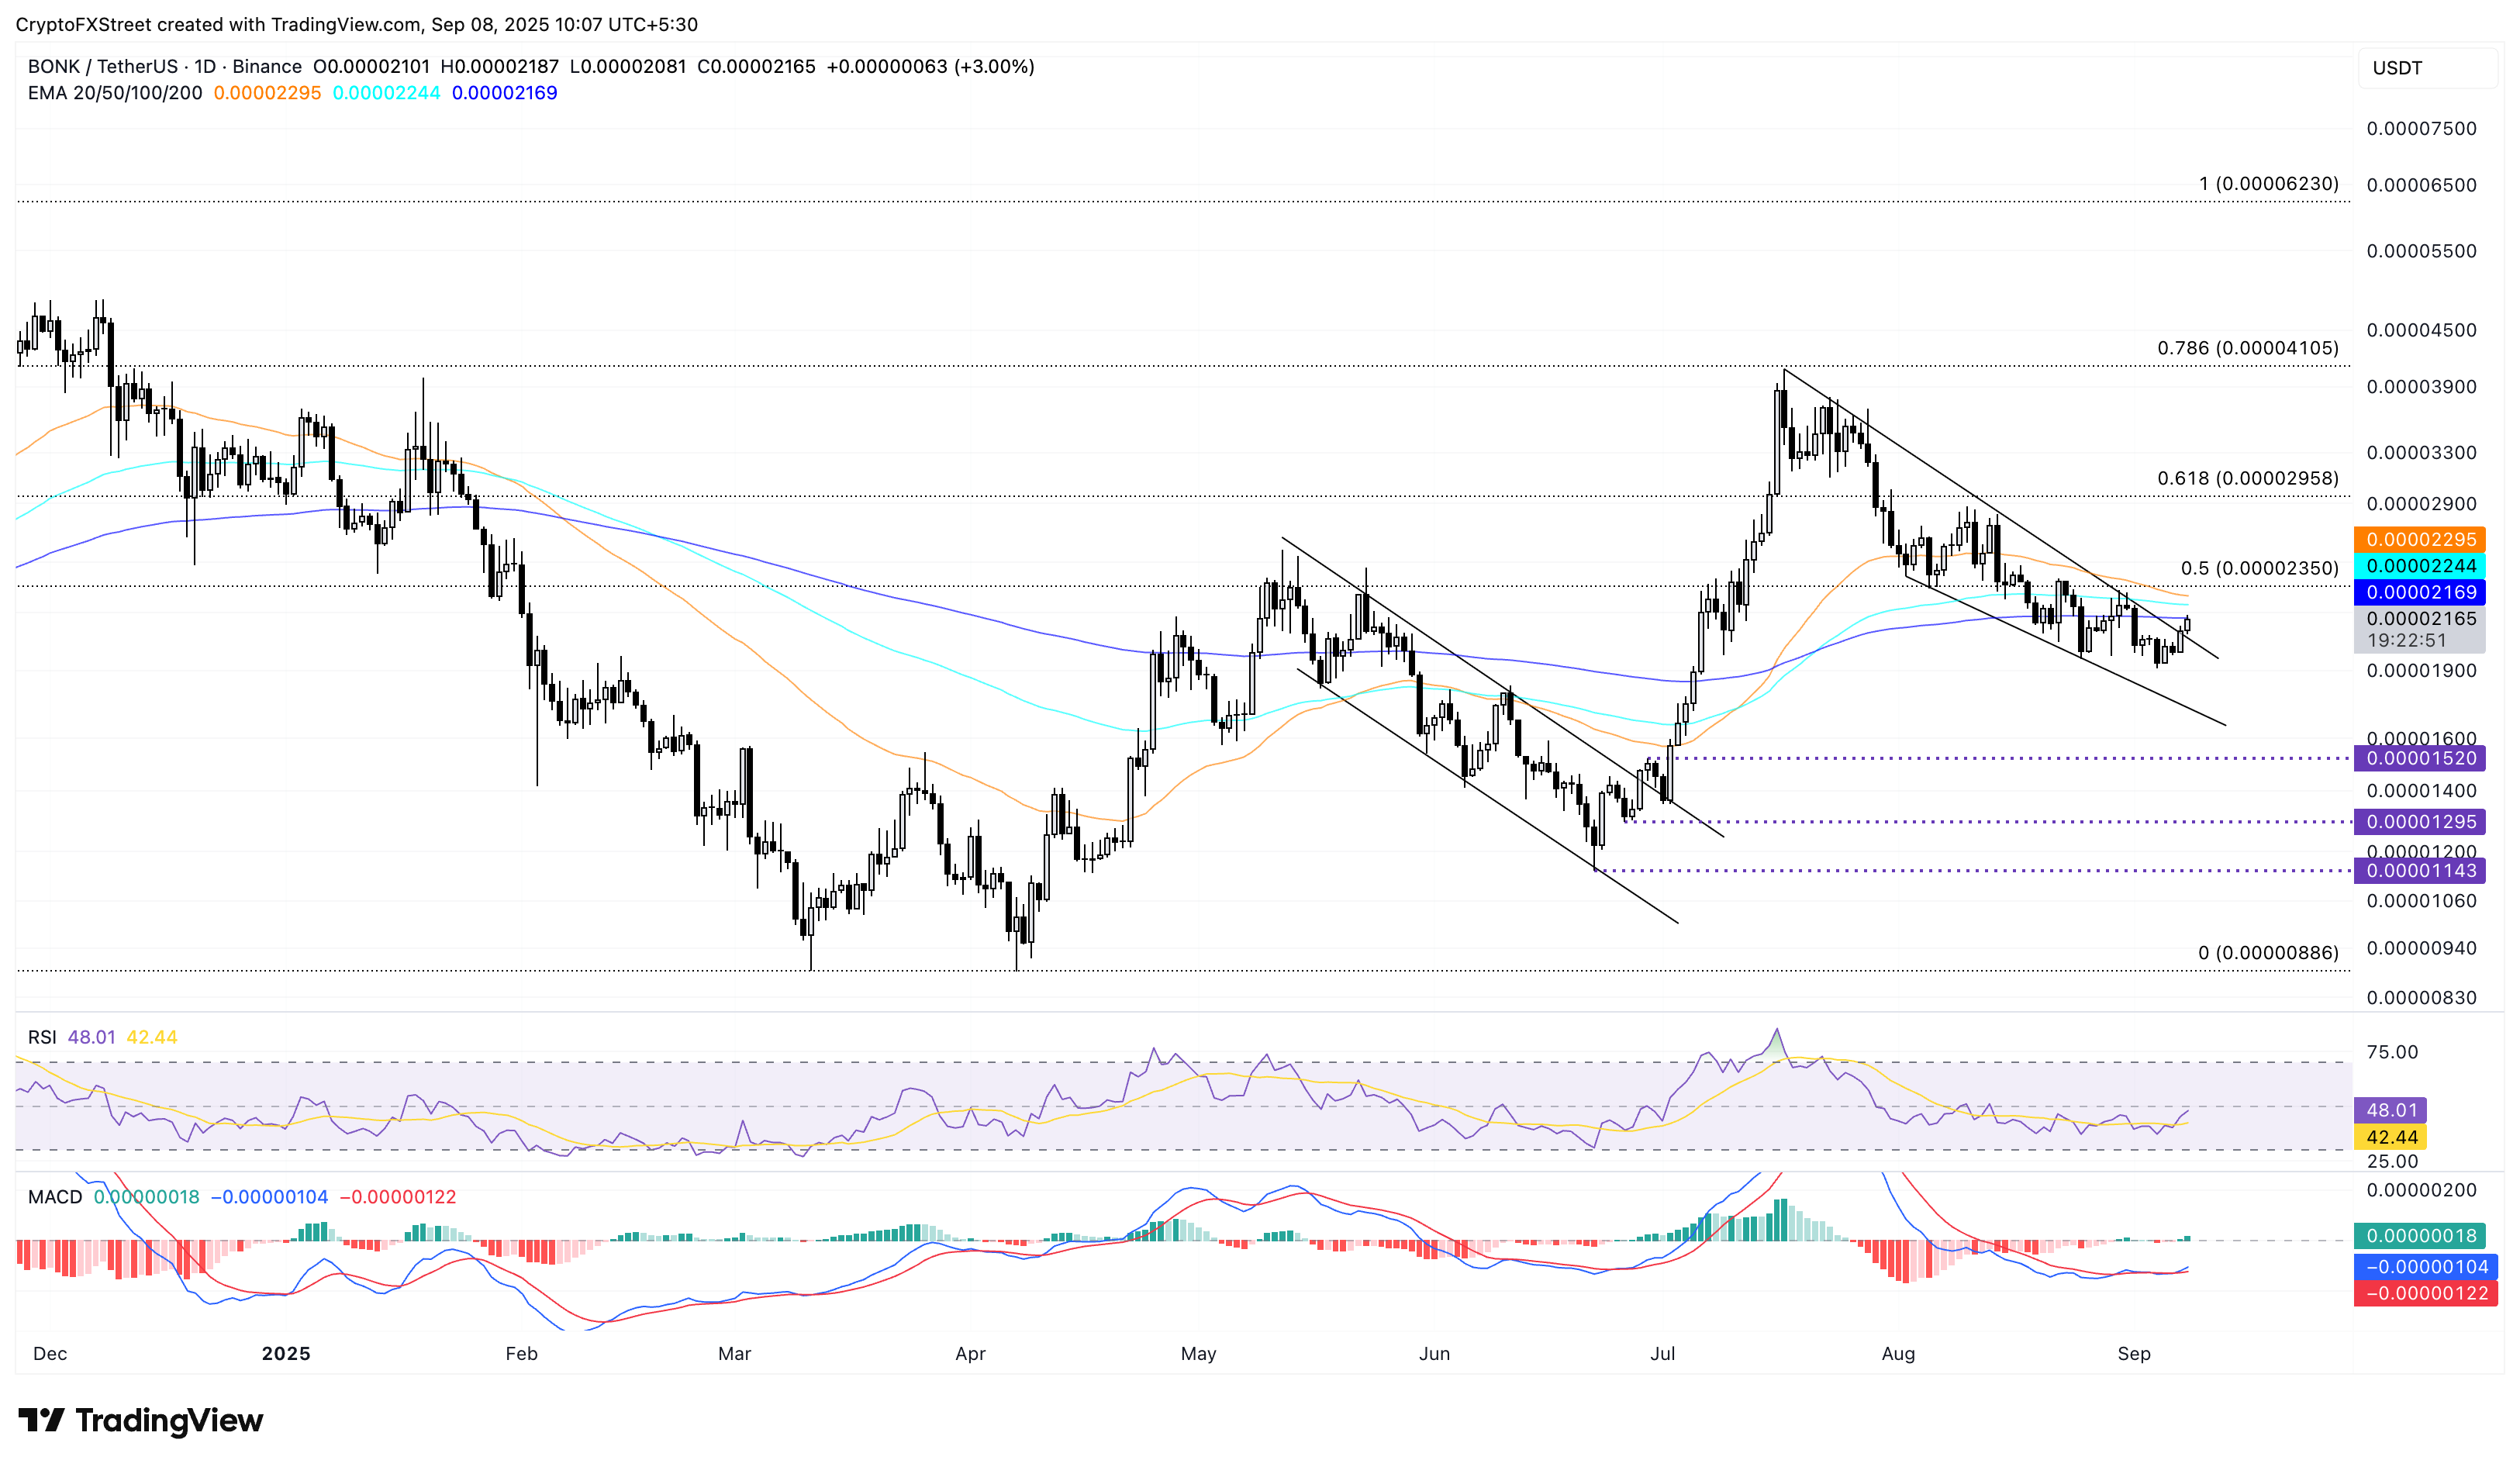
BONK/USDT daily price chart.
Looking down, if BONK fails to surpass the 200-day EMA at $0.00002169, a potential reversal below the $0.00002000 psychological mark could invalidate the pattern breakout. This would increase the possibility of an extended decline towards the $0.00001520 support level.

FXStreet
Plus d’un million d’utilisateurs se tournent vers FXStreet pour des données de marché en temps réel, des outils de graphiques, des analyses d’experts et des actualités Forex. Leur calendrier économique complet et leurs webinaires éducatifs aident les traders à rester informés et à prendre des décisions éclairées. FXStreet s’appuie sur une équipe d’environ 60 professionnels répartis entre le siège de Barcelone et diverses régions du monde.
Read More


