
Ethereum Price Forecast: ETH's rise driven by spot investors amid drop in leverage exposure
Par Michael Ebiekutan
Date de publication: 16 Jan 2026 | Date de modification: 16 Jan 2026


ARTICLES POPULAIRES

Spot market investors and the return of US buying pressure primarily drove Ethereum's (ETH) recent move above $3,300.
Ethereum price today: $3,310
- The decline in Ethereum's estimated leverage ratio, alongside a drop in open interest, indicates ETH's recent rise has been spot-driven.
- US investors are leading buying activity again following a recovery in the Coinbase Premium Index and ETH ETF inflows.
- ETH could find support around the 20-day EMA after seeing a rejection near the 200-day EMA.
Spot market investors and the return of US buying pressure primarily drove Ethereum's (ETH) recent move above $3,300.
The Ethereum estimated leverage ratio (ELR), which compares open interest to a coin's exchange reserve, has been declining steadily over the past week. The ratio fell from 0.79 at the beginning of the year to 0.66 on Wednesday, indicating low appetite for leverage and a more spot-driven market.
-1768504255451-1768504255452.png)
The move aligns with a decline in Ethereum's open interest (OI), which fell by 140K ETH despite the price appreciation over the past three days, according to Coinglass data. Open interest is the total worth of outstanding contracts in a derivatives market.
US investors leading buying activity again
In contrast, US investors on the spot market resumed buying activity, with the Coinbase Premium Index on the verge of flipping positive following ETH's rise over the past three days. The Coinbase Premium Index measures the percentage difference between prices on Coinbase Pro (USD pair) and Binance (USDT pair).
-1768504287313-1768504287313.png)
Similarly, US spot ETH exchange-traded funds (ETFs) posted a second consecutive day of net inflows worth $175 million, their highest in over a month, according to SoSoValue data. In the past two days, the products have pulled in $305 million.
Ethereum Price Forecast: ETH faces rejection at 200-day EMA
Ethereum has seen $61.6 million in liquidations over the past 24 hours, led by $40.4 million in long liquidations.
ETH faces a potential rejection near the 200-day Exponential Moving Average (EMA) on Thursday following a decline in buying pressure.
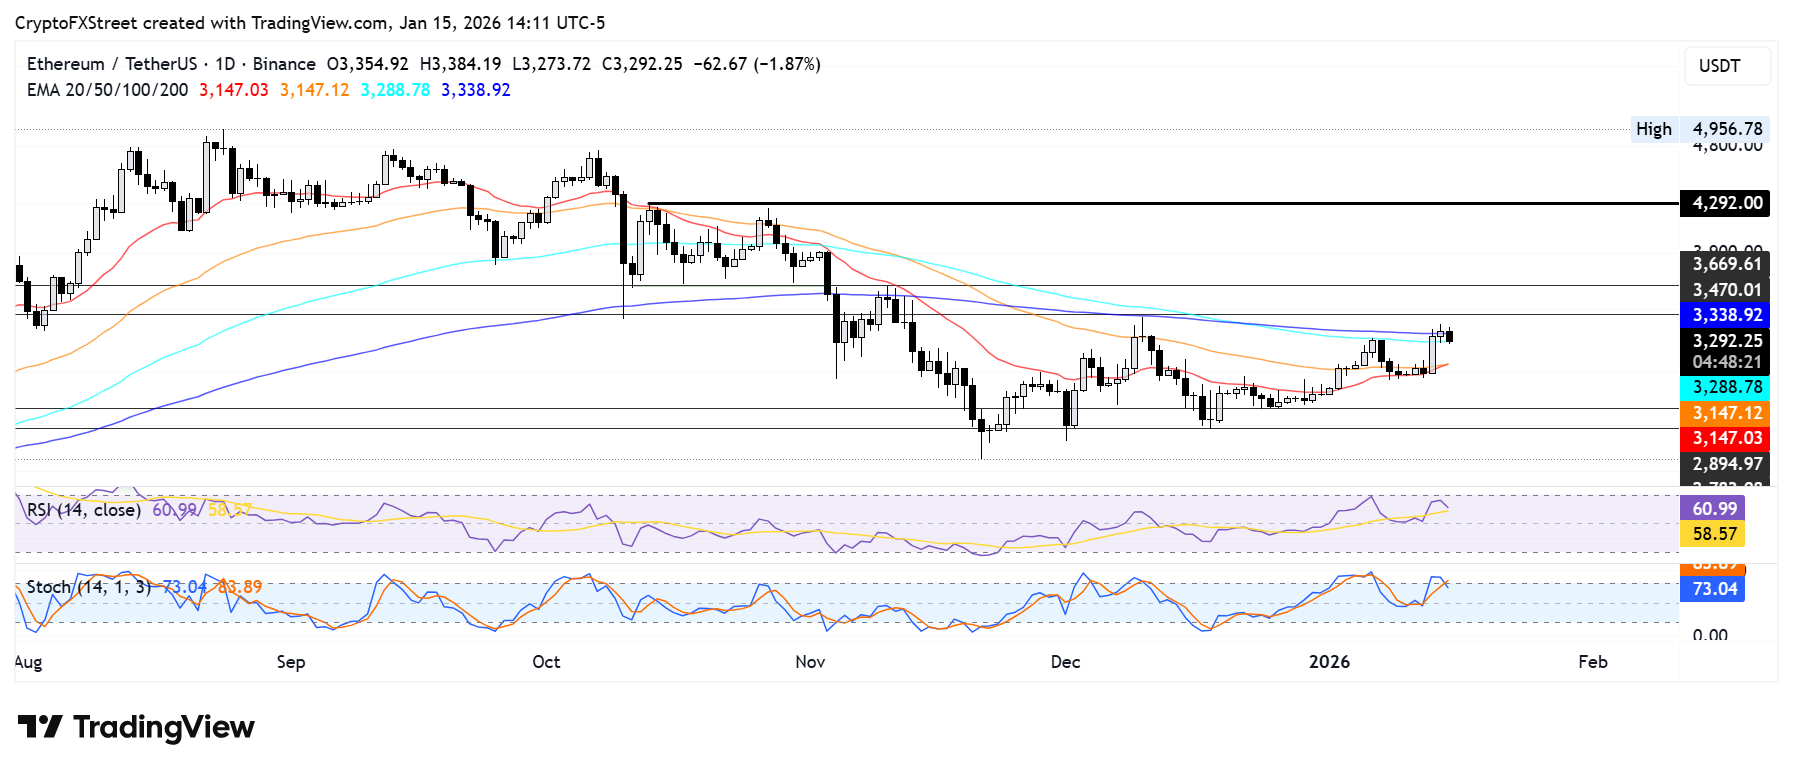
The top altcoin risks a decline toward $2,890 if it fails to find support near the 20-day EMA. On the upside, ETH has to clear the 200-day EMA to test the resistance at $3,470.
The Relative Strength Index (RSI) and Stochastic Oscillator (Stoch) are trending downward, indicating a declining bullish momentum.

Plus d’un million d’utilisateurs se tournent vers FXStreet pour des données de marché en temps réel, des outils de graphiques, des analyses d’experts et des actualités Forex. Leur calendrier économique complet et leurs webinaires éducatifs aident les traders à rester informés et à prendre des décisions éclairées. FXStreet s’appuie sur une équipe d’environ 60 professionnels répartis entre le siège de Barcelone et diverses régions du monde.
Lire la suite


