
Trade The World
EUR/JPY Price Forecast: Rises above 173.00 due to prevailing bullish bias
Par Akhtar Faruqui
Date de publication: 3 Sep 2025 | Date de modification: 3 Sep 2025


POPULAR ARTICLES

EUR/JPY continues its winning streak for the fifth successive session, trading around 173.20 during the European hours on Wednesday. The technical analysis of the daily chart suggests the prevailing bullish market bias as the currency cross is remaining within the ascending channel pattern.
- EUR/JPY may find its primary barrier at 173.90, the highest since July 2024.
- Bullish bias strengthens as the 14-day Relative Strength Index remains above the 50 mark.
- The initial support lies at nine-day EMA of 172.31.
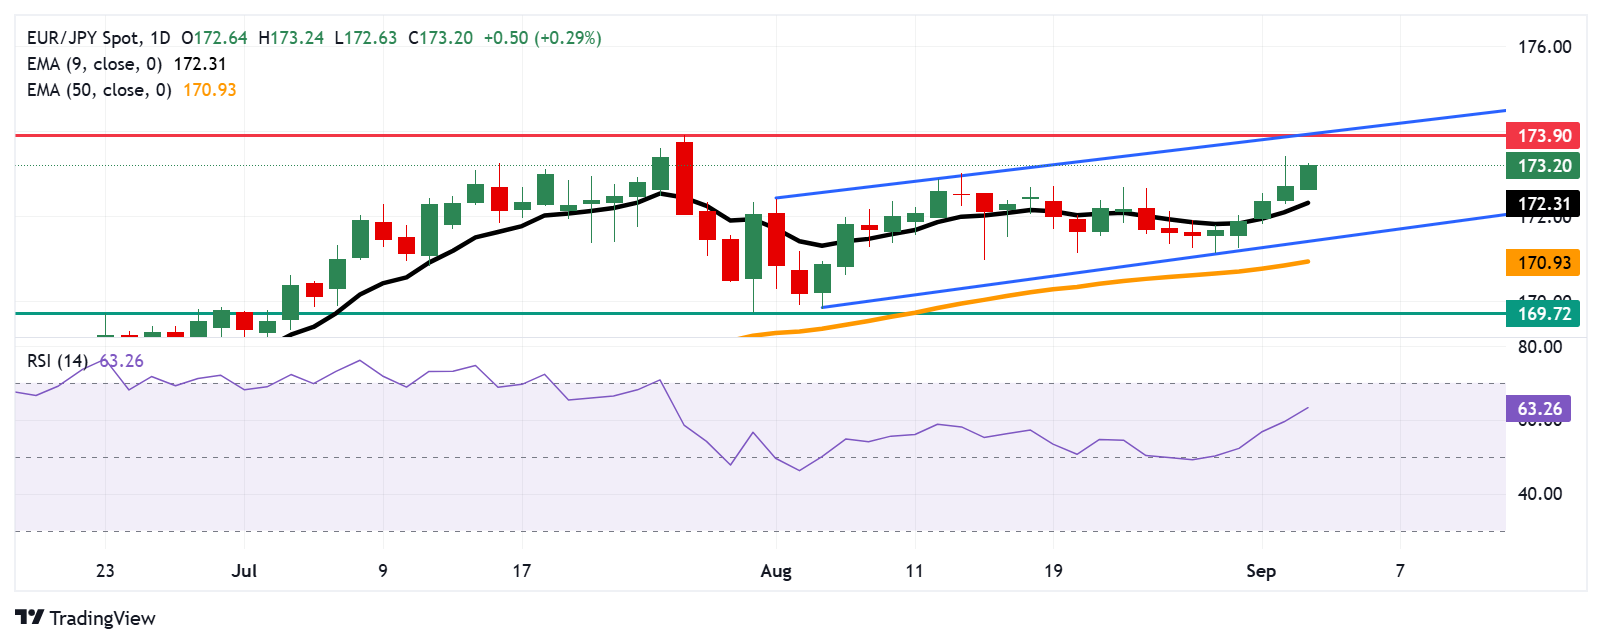
EUR/JPY continues its winning streak for the fifth successive session, trading around 173.20 during the European hours on Wednesday. The technical analysis of the daily chart suggests the prevailing bullish market bias as the currency cross is remaining within the ascending channel pattern.
The 14-day Relative Strength Index (RSI) is positioned above the 50 mark, strengthening the bullish bias. Additionally, the short-term price momentum is stronger as the EUR/JPY cross remains above the nine-day Exponential Moving Average (EMA).
On the upside, the EUR/JPY cross may approach the 173.90, the highest since July 2024, recorded on July 28, 2025, aligned with the upper boundary of the ascending channel around the psychological level of 174.00.
The EUR/JPY cross may find its primary support at the nine-day EMA of 172.31. A break below this level could weaken the short-term price momentum and prompt the currency cross to test the ascending channel’s lower boundary around 171.40, followed by the 50-day EMA of 170.93.
Further declines below the confluence support zone would weaken the medium-term price momentum and put downward pressure on the EUR/JPY cross to navigate the region around the nine-week low at 169.72, which was recorded on July 31.
EUR/JPY: Daily Chart
Euro Price Today
The table below shows the percentage change of Euro (EUR) against listed major currencies today. Euro was the strongest against the Japanese Yen.
| USD | EUR | GBP | JPY | CAD | AUD | NZD | CHF | |
|---|---|---|---|---|---|---|---|---|
| USD | -0.08% | 0.06% | 0.24% | 0.12% | -0.06% | 0.06% | 0.00% | |
| EUR | 0.08% | 0.13% | 0.31% | 0.21% | -0.11% | 0.12% | 0.07% | |
| GBP | -0.06% | -0.13% | 0.16% | 0.06% | -0.24% | 0.00% | -0.06% | |
| JPY | -0.24% | -0.31% | -0.16% | -0.14% | -0.39% | -0.28% | -0.23% | |
| CAD | -0.12% | -0.21% | -0.06% | 0.14% | -0.26% | -0.06% | -0.12% | |
| AUD | 0.06% | 0.11% | 0.24% | 0.39% | 0.26% | 0.07% | 0.18% | |
| NZD | -0.06% | -0.12% | -0.00% | 0.28% | 0.06% | -0.07% | -0.06% | |
| CHF | -0.00% | -0.07% | 0.06% | 0.23% | 0.12% | -0.18% | 0.06% |
The heat map shows percentage changes of major currencies against each other. The base currency is picked from the left column, while the quote currency is picked from the top row. For example, if you pick the Euro from the left column and move along the horizontal line to the US Dollar, the percentage change displayed in the box will represent EUR (base)/USD (quote).

FXStreet
Plus d’un million d’utilisateurs se tournent vers FXStreet pour des données de marché en temps réel, des outils de graphiques, des analyses d’experts et des actualités Forex. Leur calendrier économique complet et leurs webinaires éducatifs aident les traders à rester informés et à prendre des décisions éclairées. FXStreet s’appuie sur une équipe d’environ 60 professionnels répartis entre le siège de Barcelone et diverses régions du monde.
Read More


