
Trade The World
GBP/JPY Price Forecast: Extends advance, eyes on 204.00
Par Christian Borjon Valencia
Date de publication: 24 Oct 2025 | Date de modification: 24 Oct 2025


POPULAR ARTICLES

The GBP/JPY extended its gains on Thursday, ending up 0.19% at around 203.30, up so far in the week close to 0.55%. At the time of writing, as Friday’s Asian session begins, the cross-pair trades at 203.36 virtually unchanged.
- GBP/JPY closes Thursday at 203.30, up 0.19%, marking a 0.55% weekly rise so far.
- RSI turns bullish, suggesting buyers may push toward resistance at 203.50 and 204.00 next.
- Break above 204.00 could open the door to yearly high at 205.32.
- Downside support seen at 203.00, followed by 202.00 and the 20-day SMA near 201.87.
The GBP/JPY extended its gains on Thursday, ending up 0.19% at around 203.30, up so far in the week close to 0.55%. At the time of writing, as Friday’s Asian session begins, the cross-pair trades at 203.36 virtually unchanged.
GBP/JPY Price Forecast: Technical outlook
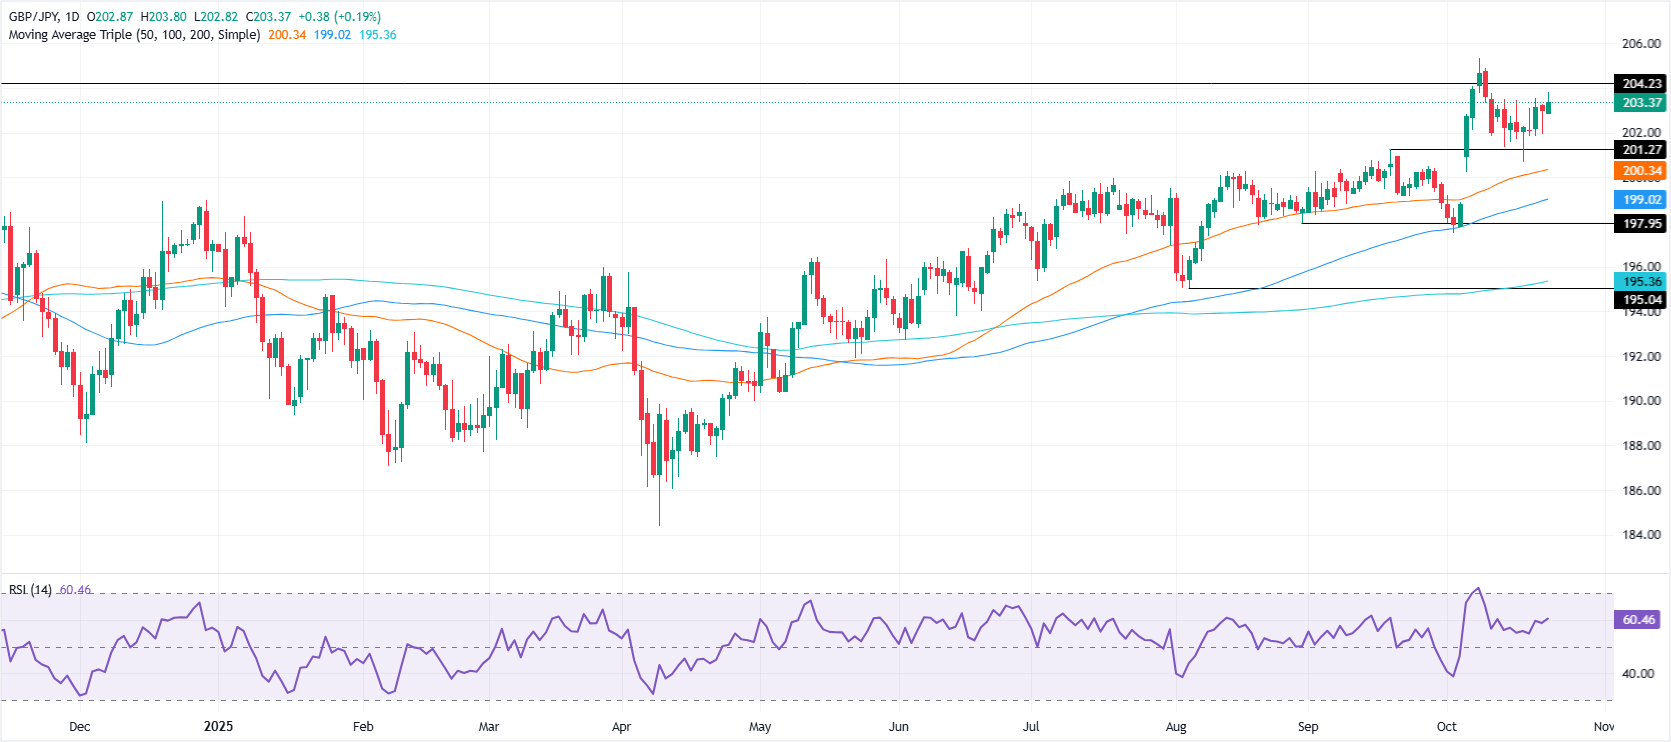
From a technical standpoint, the GBP/JPY remains subdued after dropping to a nine-day low of 200.68, in October 17. Nevertheless, the pair has recovered some ground, and it seems poised to test higher prices.
The Relative Strength Index (RSI) shows that buyers are gathering momentum as the RSI is bullish.
With that said, the first resistance would be 203.50. If surpassed the next stop would be 204.00, followed by October 8 yearly high of 205.32. Conversely, if GBP/JPS tumbles below 203.00, the first support would be the 202.00 mark, followed by the 20-day Simple Moving Average (SMA) at 201.87.
GBP/JPY Price Chart – Daily
Pound Sterling Price This week
The table below shows the percentage change of British Pound (GBP) against listed major currencies this week. British Pound was the strongest against the Japanese Yen.
| USD | EUR | GBP | JPY | CAD | AUD | NZD | CHF | |
|---|---|---|---|---|---|---|---|---|
| USD | 0.42% | 0.78% | 1.36% | -0.22% | -0.36% | -0.30% | 0.40% | |
| EUR | -0.42% | 0.36% | 1.03% | -0.64% | -0.68% | -0.79% | -0.01% | |
| GBP | -0.78% | -0.36% | 0.43% | -1.00% | -1.04% | -1.15% | -0.39% | |
| JPY | -1.36% | -1.03% | -0.43% | -1.62% | -1.74% | -1.73% | -1.05% | |
| CAD | 0.22% | 0.64% | 1.00% | 1.62% | -0.10% | -0.15% | 0.63% | |
| AUD | 0.36% | 0.68% | 1.04% | 1.74% | 0.10% | -0.11% | 0.66% | |
| NZD | 0.30% | 0.79% | 1.15% | 1.73% | 0.15% | 0.11% | 0.77% | |
| CHF | -0.40% | 0.00% | 0.39% | 1.05% | -0.63% | -0.66% | -0.77% |
The heat map shows percentage changes of major currencies against each other. The base currency is picked from the left column, while the quote currency is picked from the top row. For example, if you pick the British Pound from the left column and move along the horizontal line to the US Dollar, the percentage change displayed in the box will represent GBP (base)/USD (quote).

FXStreet
Plus d’un million d’utilisateurs se tournent vers FXStreet pour des données de marché en temps réel, des outils de graphiques, des analyses d’experts et des actualités Forex. Leur calendrier économique complet et leurs webinaires éducatifs aident les traders à rester informés et à prendre des décisions éclairées. FXStreet s’appuie sur une équipe d’environ 60 professionnels répartis entre le siège de Barcelone et diverses régions du monde.
Read More


