
Trade The World
GBP/USD Price Forecast: Resistance appears at 1.3300, near nine-day EMA
Par Akhtar Faruqui
Date de publication: 4 Aug 2025 | Date de modification: 4 Aug 2025


POPULAR ARTICLES

The GBP/USD pair moves sideways after registering more than 0.5% gains in the previous day, trading around 1.3280 during the Asian hours on Monday. The bearish bias prevails as the daily chart’s technical analysis suggests that the pair moves downwards within the descending channel pattern.
- GBP/USD may find the initial support at the descending channel’s lower boundary around 1.3180.
- The 14-day Relative Strength Index remains below the 50 level, reinforcing the bearish bias.
- The initial barrier appears at the nine-day EMA of 1.3332.
The GBP/USD pair moves sideways after registering more than 0.5% gains in the previous day, trading around 1.3280 during the Asian hours on Monday. The bearish bias prevails as the daily chart’s technical analysis suggests that the pair moves downwards within the descending channel pattern.
The 14-day Relative Strength Index (RSI) remains below the 50 level, strengthening the bearish bias. However, the GBP/USD pair is positioned below the nine-day Exponential Moving Average (EMA), suggesting the short-term price momentum is weakening.
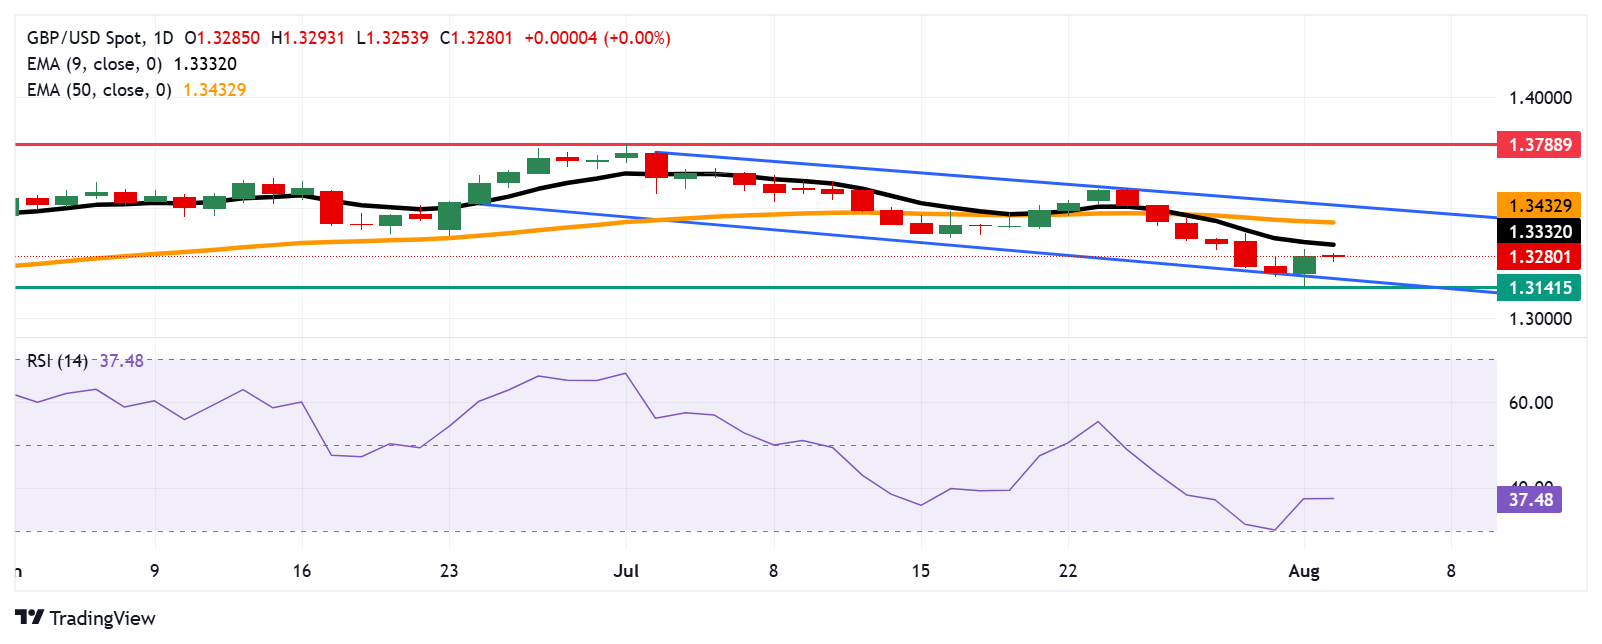
On the downside, the GBP/USD pair could find the primary support at the lower boundary of the descending channel around 1.3180, followed by the four-month low of 1.3139, which was recorded on May 12.
The GBP/USD pair may target the immediate barrier at the nine-day EMA of 1.3332, followed by the 50-day EMA at 1.3432. A break above these levels would improve the short- and medium-term price momentum and support the pair to test the descending channel’s upper boundary around 1.3520. Further advances may lead the pair to approach 1.3788, the highest since October 2021, which was recorded on July 1.
GBP/USD: Daily Chart
British Pound PRICE Today
The table below shows the percentage change of British Pound (GBP) against listed major currencies today. British Pound was the weakest against the Australian Dollar.
| USD | EUR | GBP | JPY | CAD | AUD | NZD | CHF | |
|---|---|---|---|---|---|---|---|---|
| USD | 0.12% | 0.04% | 0.28% | -0.06% | -0.06% | -0.06% | -0.02% | |
| EUR | -0.12% | -0.03% | 0.17% | -0.17% | -0.31% | -0.19% | -0.15% | |
| GBP | -0.04% | 0.03% | 0.24% | -0.14% | -0.28% | -0.16% | -0.11% | |
| JPY | -0.28% | -0.17% | -0.24% | -0.34% | -0.49% | -0.36% | -0.13% | |
| CAD | 0.06% | 0.17% | 0.14% | 0.34% | -0.16% | 0.00% | 0.03% | |
| AUD | 0.06% | 0.31% | 0.28% | 0.49% | 0.16% | 0.13% | 0.16% | |
| NZD | 0.06% | 0.19% | 0.16% | 0.36% | -0.00% | -0.13% | 0.03% | |
| CHF | 0.02% | 0.15% | 0.11% | 0.13% | -0.03% | -0.16% | -0.03% |
The heat map shows percentage changes of major currencies against each other. The base currency is picked from the left column, while the quote currency is picked from the top row. For example, if you pick the British Pound from the left column and move along the horizontal line to the US Dollar, the percentage change displayed in the box will represent GBP (base)/USD (quote).

FXStreet
Plus d’un million d’utilisateurs se tournent vers FXStreet pour des données de marché en temps réel, des outils de graphiques, des analyses d’experts et des actualités Forex. Leur calendrier économique complet et leurs webinaires éducatifs aident les traders à rester informés et à prendre des décisions éclairées. FXStreet s’appuie sur une équipe d’environ 60 professionnels répartis entre le siège de Barcelone et diverses régions du monde.
Read More


