
Trade The World
Litecoin Price Forecast: LTC bounces back as retail interest surges
Par John Isige
Date de publication: 10 Oct 2025 | Date de modification: 10 Oct 2025


POPULAR ARTICLES
Litecoin (LTC) offers bullish signs, trading at around $130 at the time of writing on Friday. The digital asset has increased for two consecutive days, shrugging off volatility, targeted profit-taking and bearish sentiment in the broader cryptocurrency market.
- Litecoin extends recovery, briefly breaking above $130 on Friday as sentiment improves.
- Retail demand for LTC steadies as the futures Open Interest crosses the $1 billion mark.
- A double top pattern on the daily chart highlights the potential risk to LTC’s uptrend.
Litecoin (LTC) offers bullish signs, trading at around $130 at the time of writing on Friday. The digital asset has increased for two consecutive days, shrugging off volatility, targeted profit-taking and bearish sentiment in the broader cryptocurrency market.
Litecoin rises on increasing retail demand
Demand for Litecoin derivatives has significantly increased, with the Open Interest (OI) averaging $1.11 billion on Friday from approximately $795 million on October 1. The surge in OI, representing the notional value of outstanding futures contracts, points to improving bullish sentiment around LTC. A steady rise in OI also shows that investors are confident that the token could sustain the uptrend in the short term. This conviction increases their risk appetite, contributing to buying pressure.
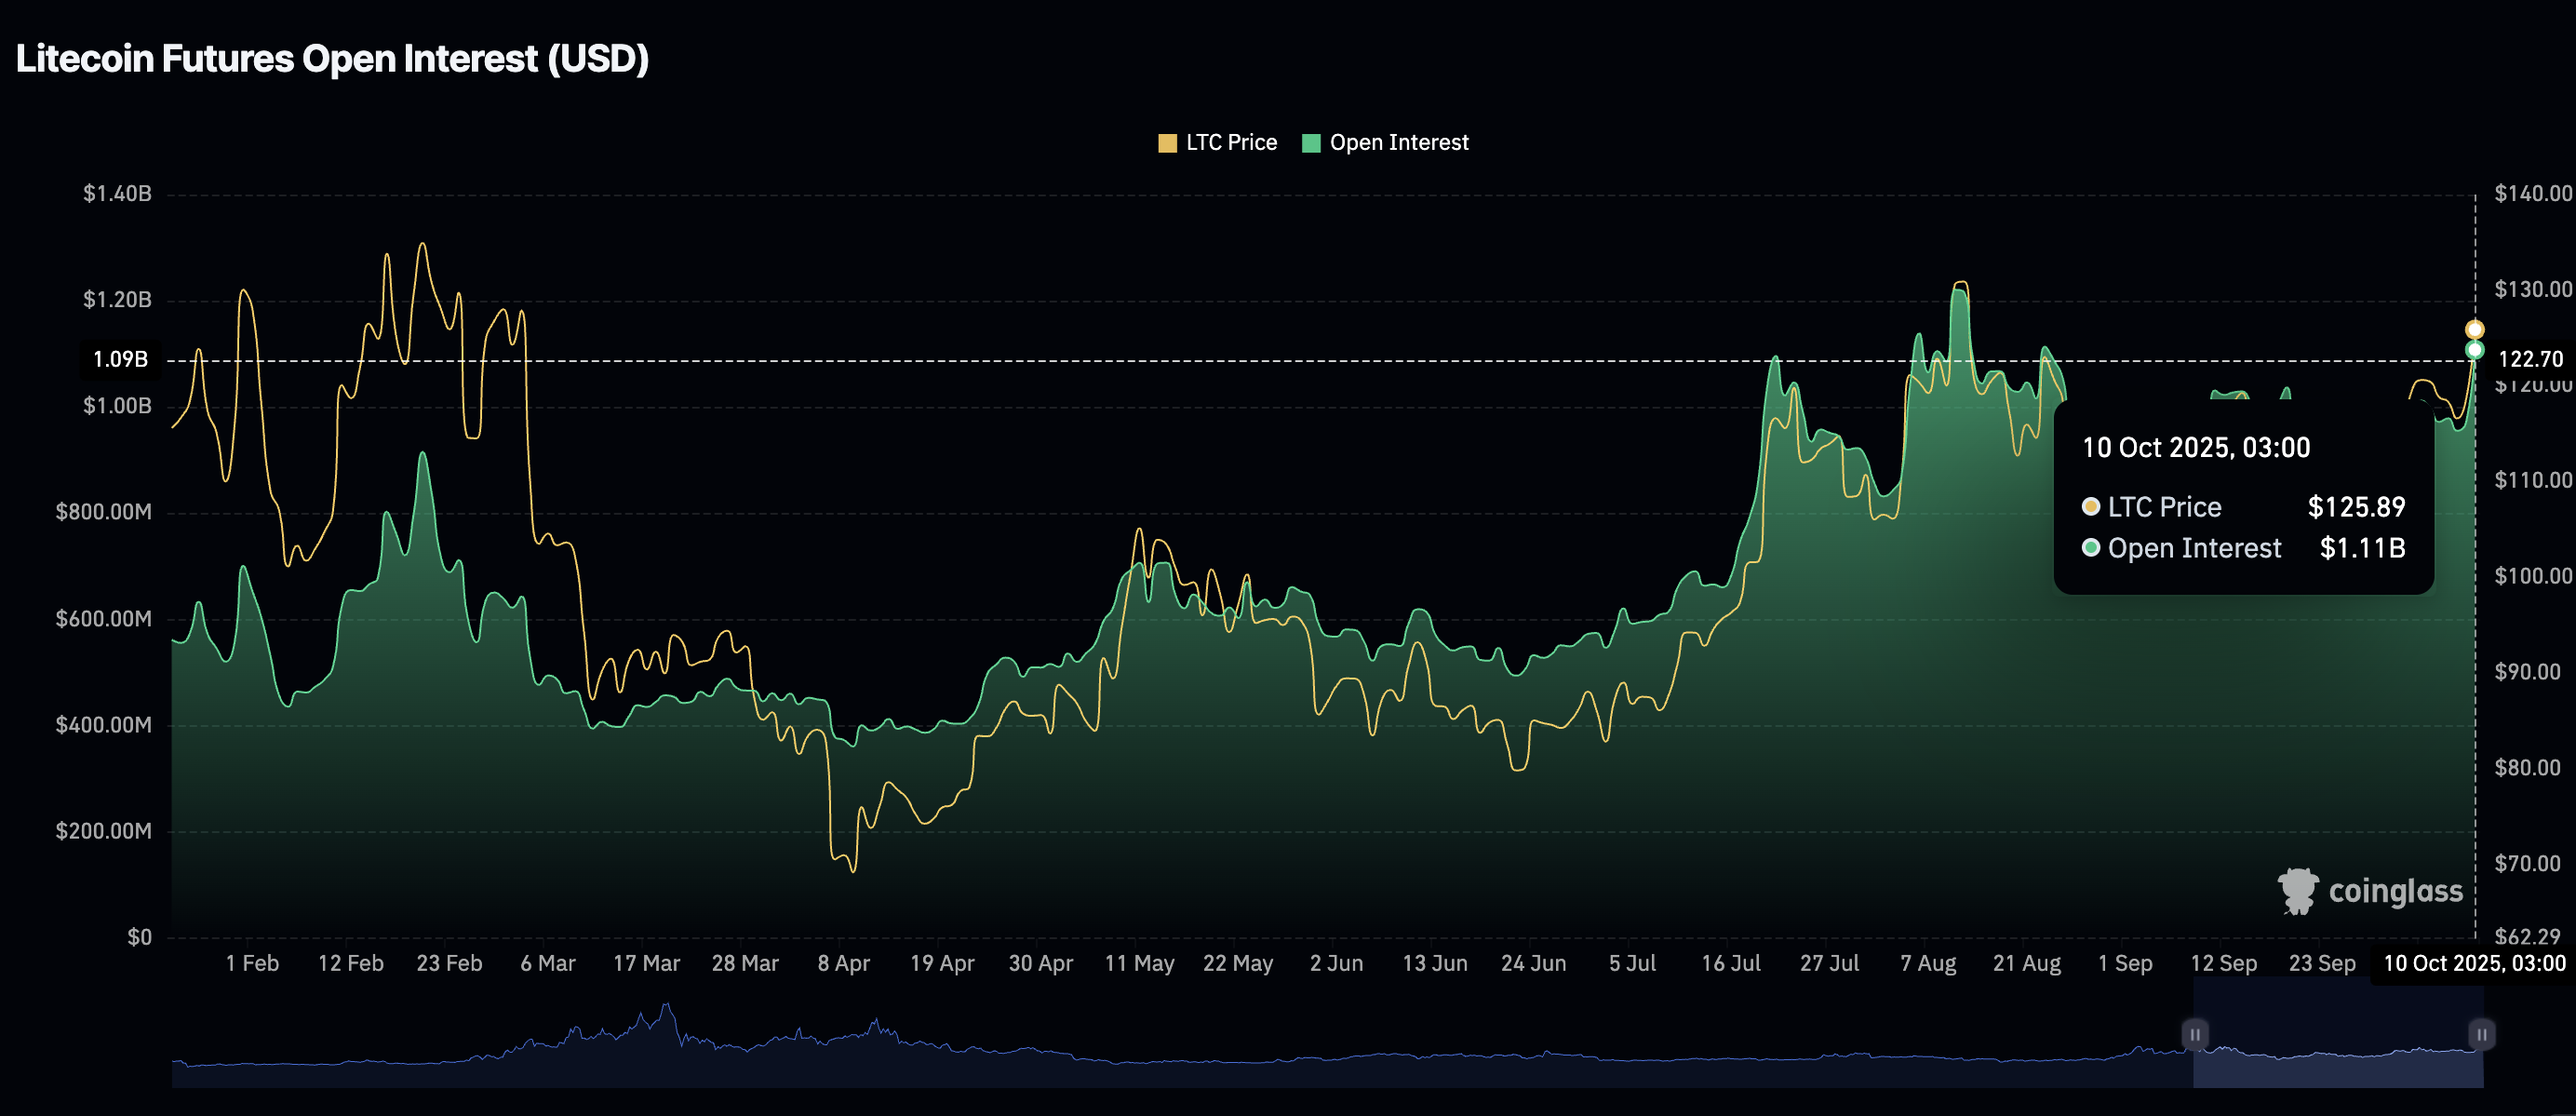
Litecoin Futures Open Interest | Source: CoinGlass
Still, a sharp drop in the OI-Weighted Funding Rate metric suggests that traders should be bullishly optimistic, tempering expectations of a sustained run above the $130 level in the short term.
The OI-weighted funding rate stands at 0.0142% after peaking at 0.0175% earlier in the day. This decline indicates that bearish bets on LTC are increasing as traders pile into short positions.
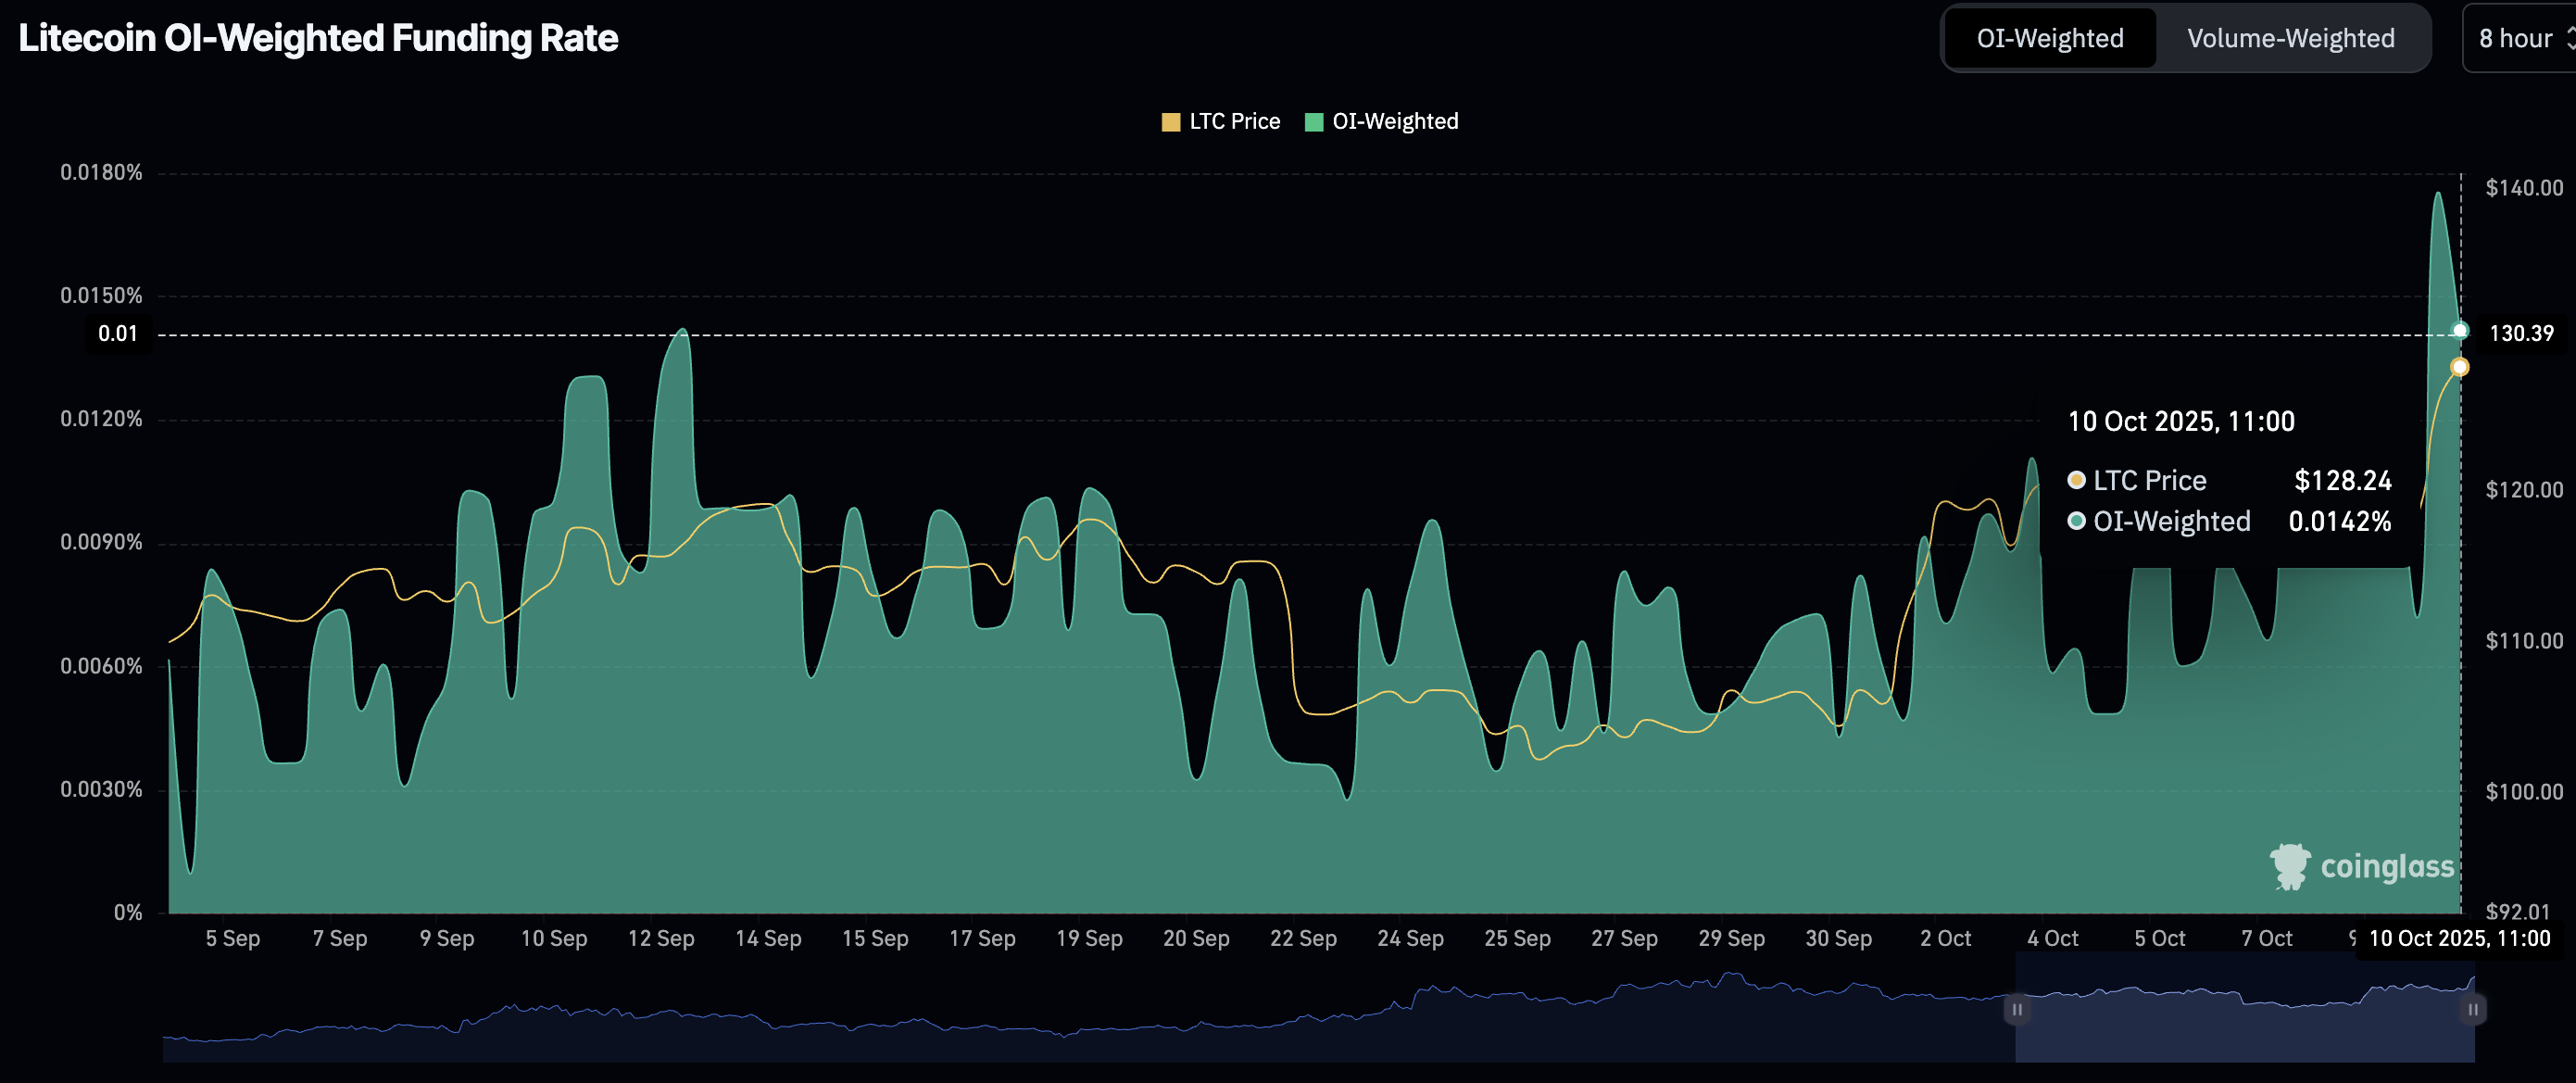
Litecoin OI-Weighted Funding Rate metric | Source: CoinGlass
Technical outlook: Litecoin testing double-top pattern
Litecoin is leaning bullishly on Friday, trading around the $130 level at the time of writing. A sharp ascent in the Relative Strength Index (RSI) to 72 supports LTC’s short-term bullish outlook.
The Moving Average Convergence Divergence (MACD) indicator further emphasizes Litecoin’s ability to extend the up leg, sustaining a buy signal since October 1. The green histogram bars back the bullish momentum, encouraging investors to increase risk exposure.
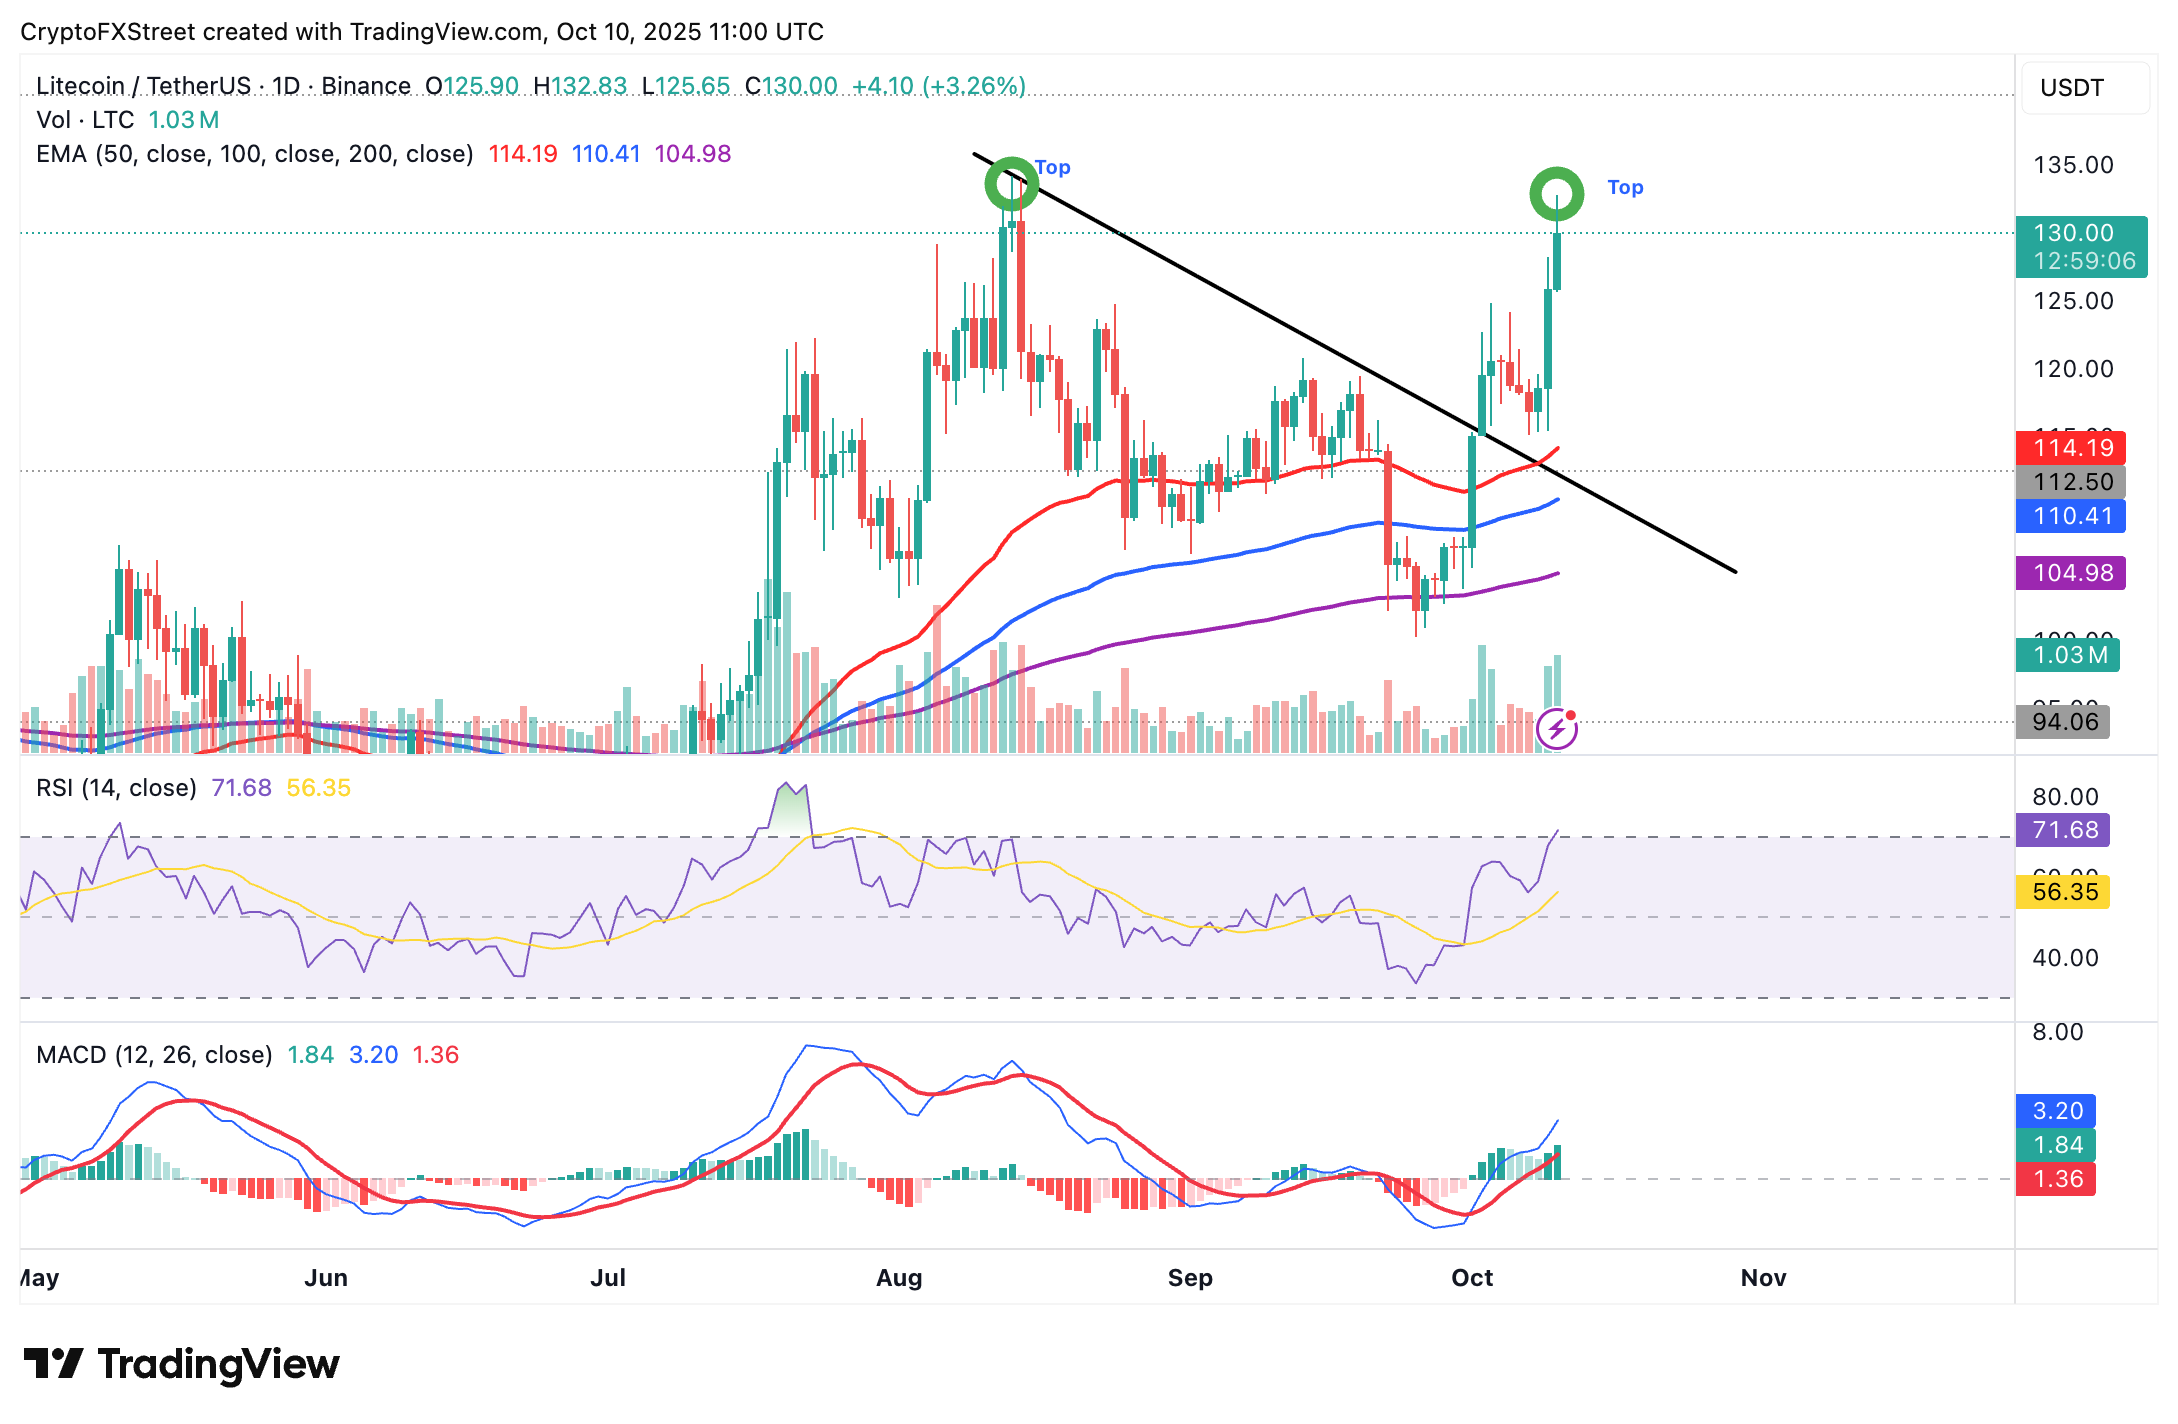
LTC/USDT daily chart
A daily close above the short-term support at $130 would validate the uptrend. However, sudden pullbacks cannot be ruled out, especially with the RSI’s position in overbought territory. Higher RSI readings indicate overheated market conditions and often precede price corrections.
Similarly, the Litecoin price is testing a double-top chart pattern, which represents a strong resistance area. If unbroken, profit-taking could take center stage, contributing to selling pressure.
Key levels of interest for traders include the short-term support at $130, which also marks the double-top pattern, the next resistance at $135 and the demand zone at $125, previously tested on October 3.
Cryptocurrency prices FAQs
Token launches influence demand and adoption among market participants. Listings on crypto exchanges deepen the liquidity for an asset and add new participants to an asset’s network. This is typically bullish for a digital asset.
A hack is an event in which an attacker captures a large volume of the asset from a DeFi bridge or hot wallet of an exchange or any other crypto platform via exploits, bugs or other methods. The exploiter then transfers these tokens out of the exchange platforms to ultimately sell or swap the assets for other cryptocurrencies or stablecoins. Such events often involve an en masse panic triggering a sell-off in the affected assets.
Macroeconomic events like the US Federal Reserve’s decision on interest rates influence crypto assets mainly through the direct impact they have on the US Dollar. An increase in interest rate typically negatively influences Bitcoin and altcoin prices, and vice versa. If the US Dollar index declines, risk assets and associated leverage for trading gets cheaper, in turn driving crypto prices higher.
Halvings are typically considered bullish events as they slash the block reward in half for miners, constricting the supply of the asset. At consistent demand if the supply reduces, the asset’s price climbs.

FXStreet
Plus d’un million d’utilisateurs se tournent vers FXStreet pour des données de marché en temps réel, des outils de graphiques, des analyses d’experts et des actualités Forex. Leur calendrier économique complet et leurs webinaires éducatifs aident les traders à rester informés et à prendre des décisions éclairées. FXStreet s’appuie sur une équipe d’environ 60 professionnels répartis entre le siège de Barcelone et diverses régions du monde.
Read More


