
Trade The World
Pi Network Price Forecast: PI holds key support as momentum coils
Par Vishal Dixit
Date de publication: 9 Jan 2026 | Date de modification: 9 Jan 2026


POPULAR ARTICLES

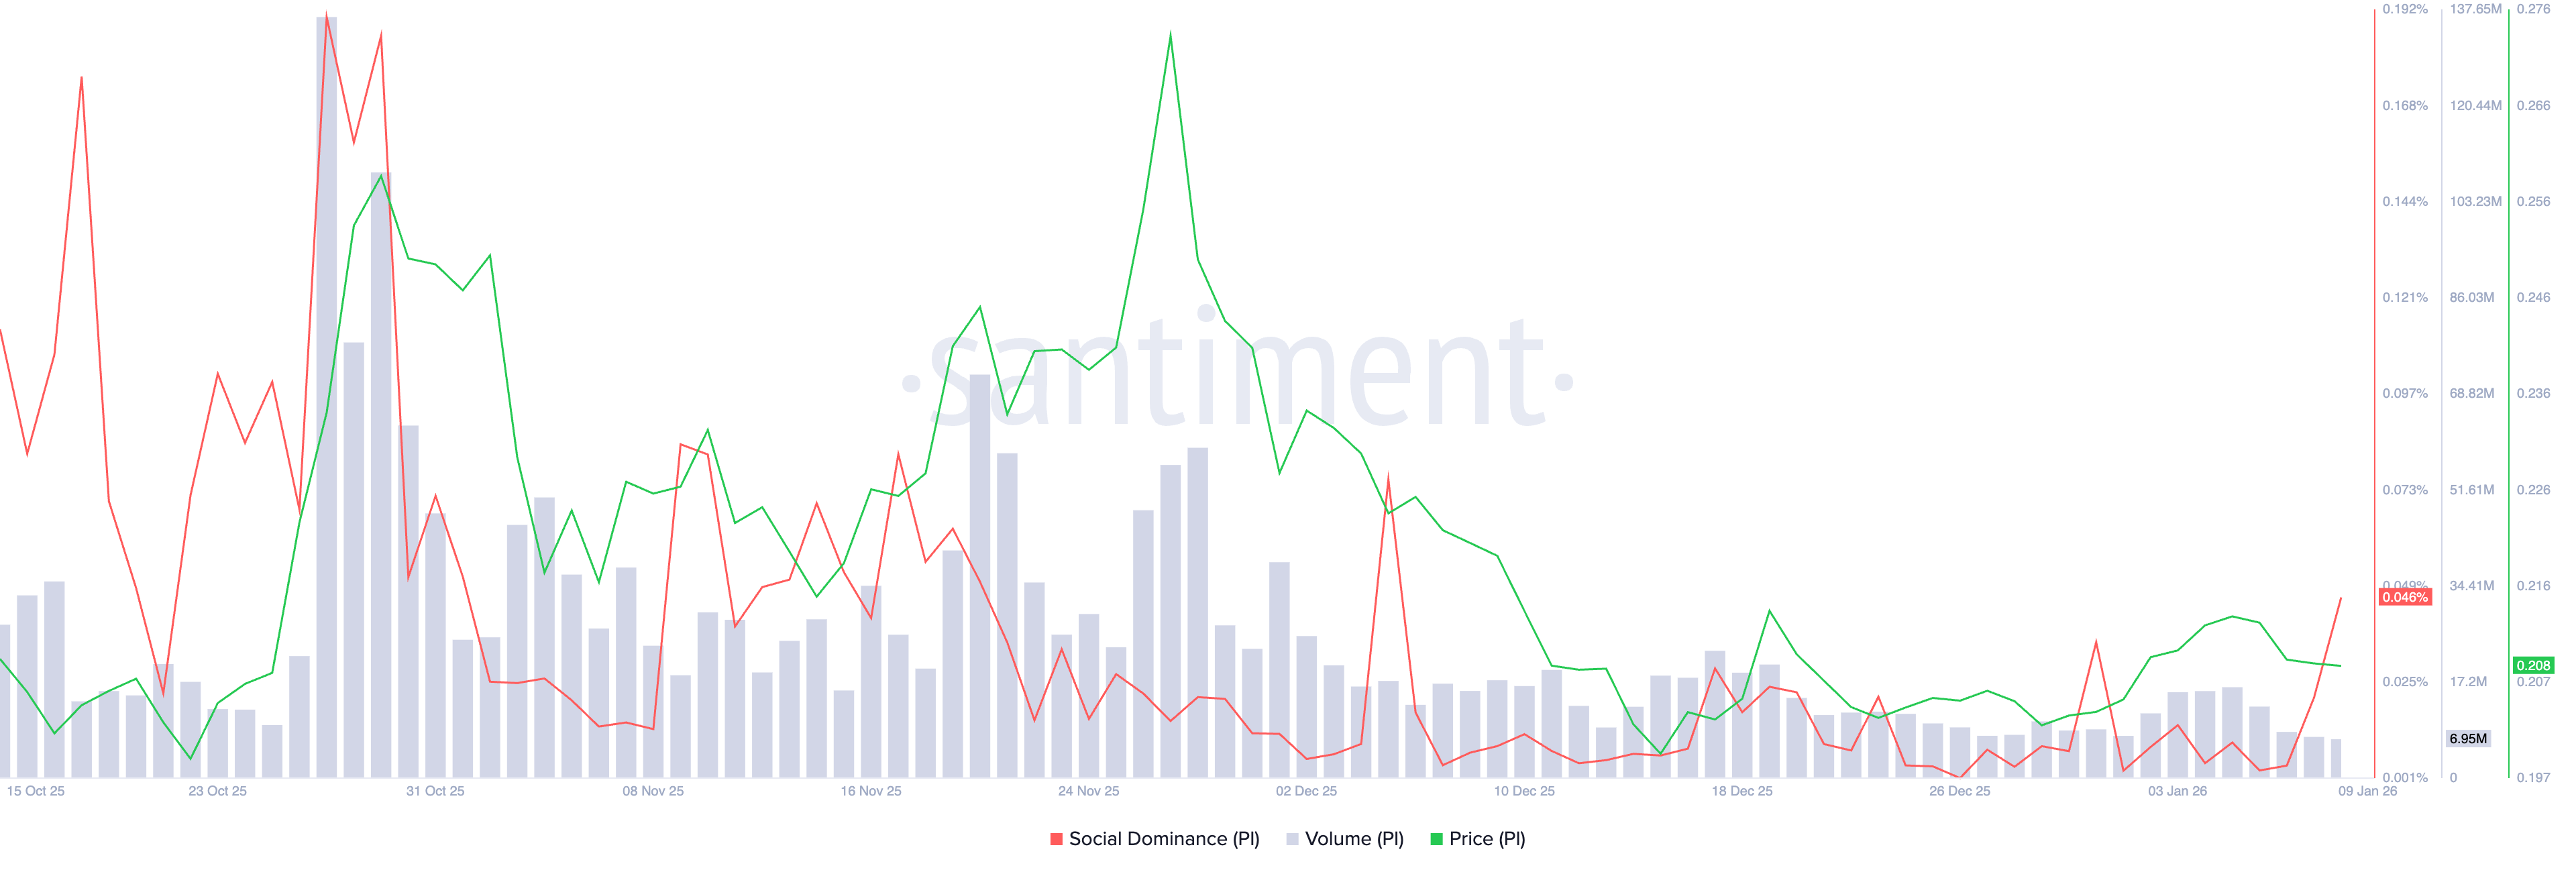
Pi Network (PI) trades close to $0.2100 at press time on Friday, stabilizing after a two-day decline of nearly 2%. The PI token's trading volume steadily declines, while a surge in social dominance suggests a potential spike in retail interest.
- Pi Network holds above key psychological support and the 20-day SMA despite a decline of nearly 2% so far this week.
- A steady decline in volume and a largely sideways OBV indicator suggests dormant demand despite a surge in social dominance.
- The technical outlook is mixed for PI as trend momentum wanes.
Pi Network (PI) trades close to $0.2100 at press time on Friday, stabilizing after a two-day decline of nearly 2%. The PI token's trading volume steadily declines, while a surge in social dominance suggests a potential spike in retail interest. The technical outlook for PI remains mixed as the Bollinger Bands squeeze, suggesting a breakout on either side.
Social dominance surge could fuel retail demand
Sanitment data shows that the social dominance of PI is up to 0.046%, from 0.004% on Wednesday, indicating a rise in social buzz surrounding Pi Network. A steady increase could lead to a spike in retail interest, fueling the next recovery run.
Pi Network’s hold at key moving averages risks further decline
Pi Network trades above the 20-day Simple Moving Average (SMA) at $0.2068 on the daily chart, following a mild correction earlier this week. The PI token is broadly stabilizing above the $0.2000 level as the Bollinger Bands squeeze, suggesting a sideways shift and coiling momentum.
Additionally, the Squeeze Momentum indicator, which tracks periods of low volatility before a directional move, has flipped from red bars to green, indicating a bullish shift.
On the other hand, a declining trend in the trading volume and a sideways trend in the On Balance Volume (OBV) indicator suggest a phase of dormant demand. In short, the technical indicators suggest the shift in bullish momentum lacks strength.
To reinstate an upward trend, PI should cross the December 19 high at $0.2177 with a decisive daily close, which could extend the rally to the R1 Pivot Point at $0.2321.
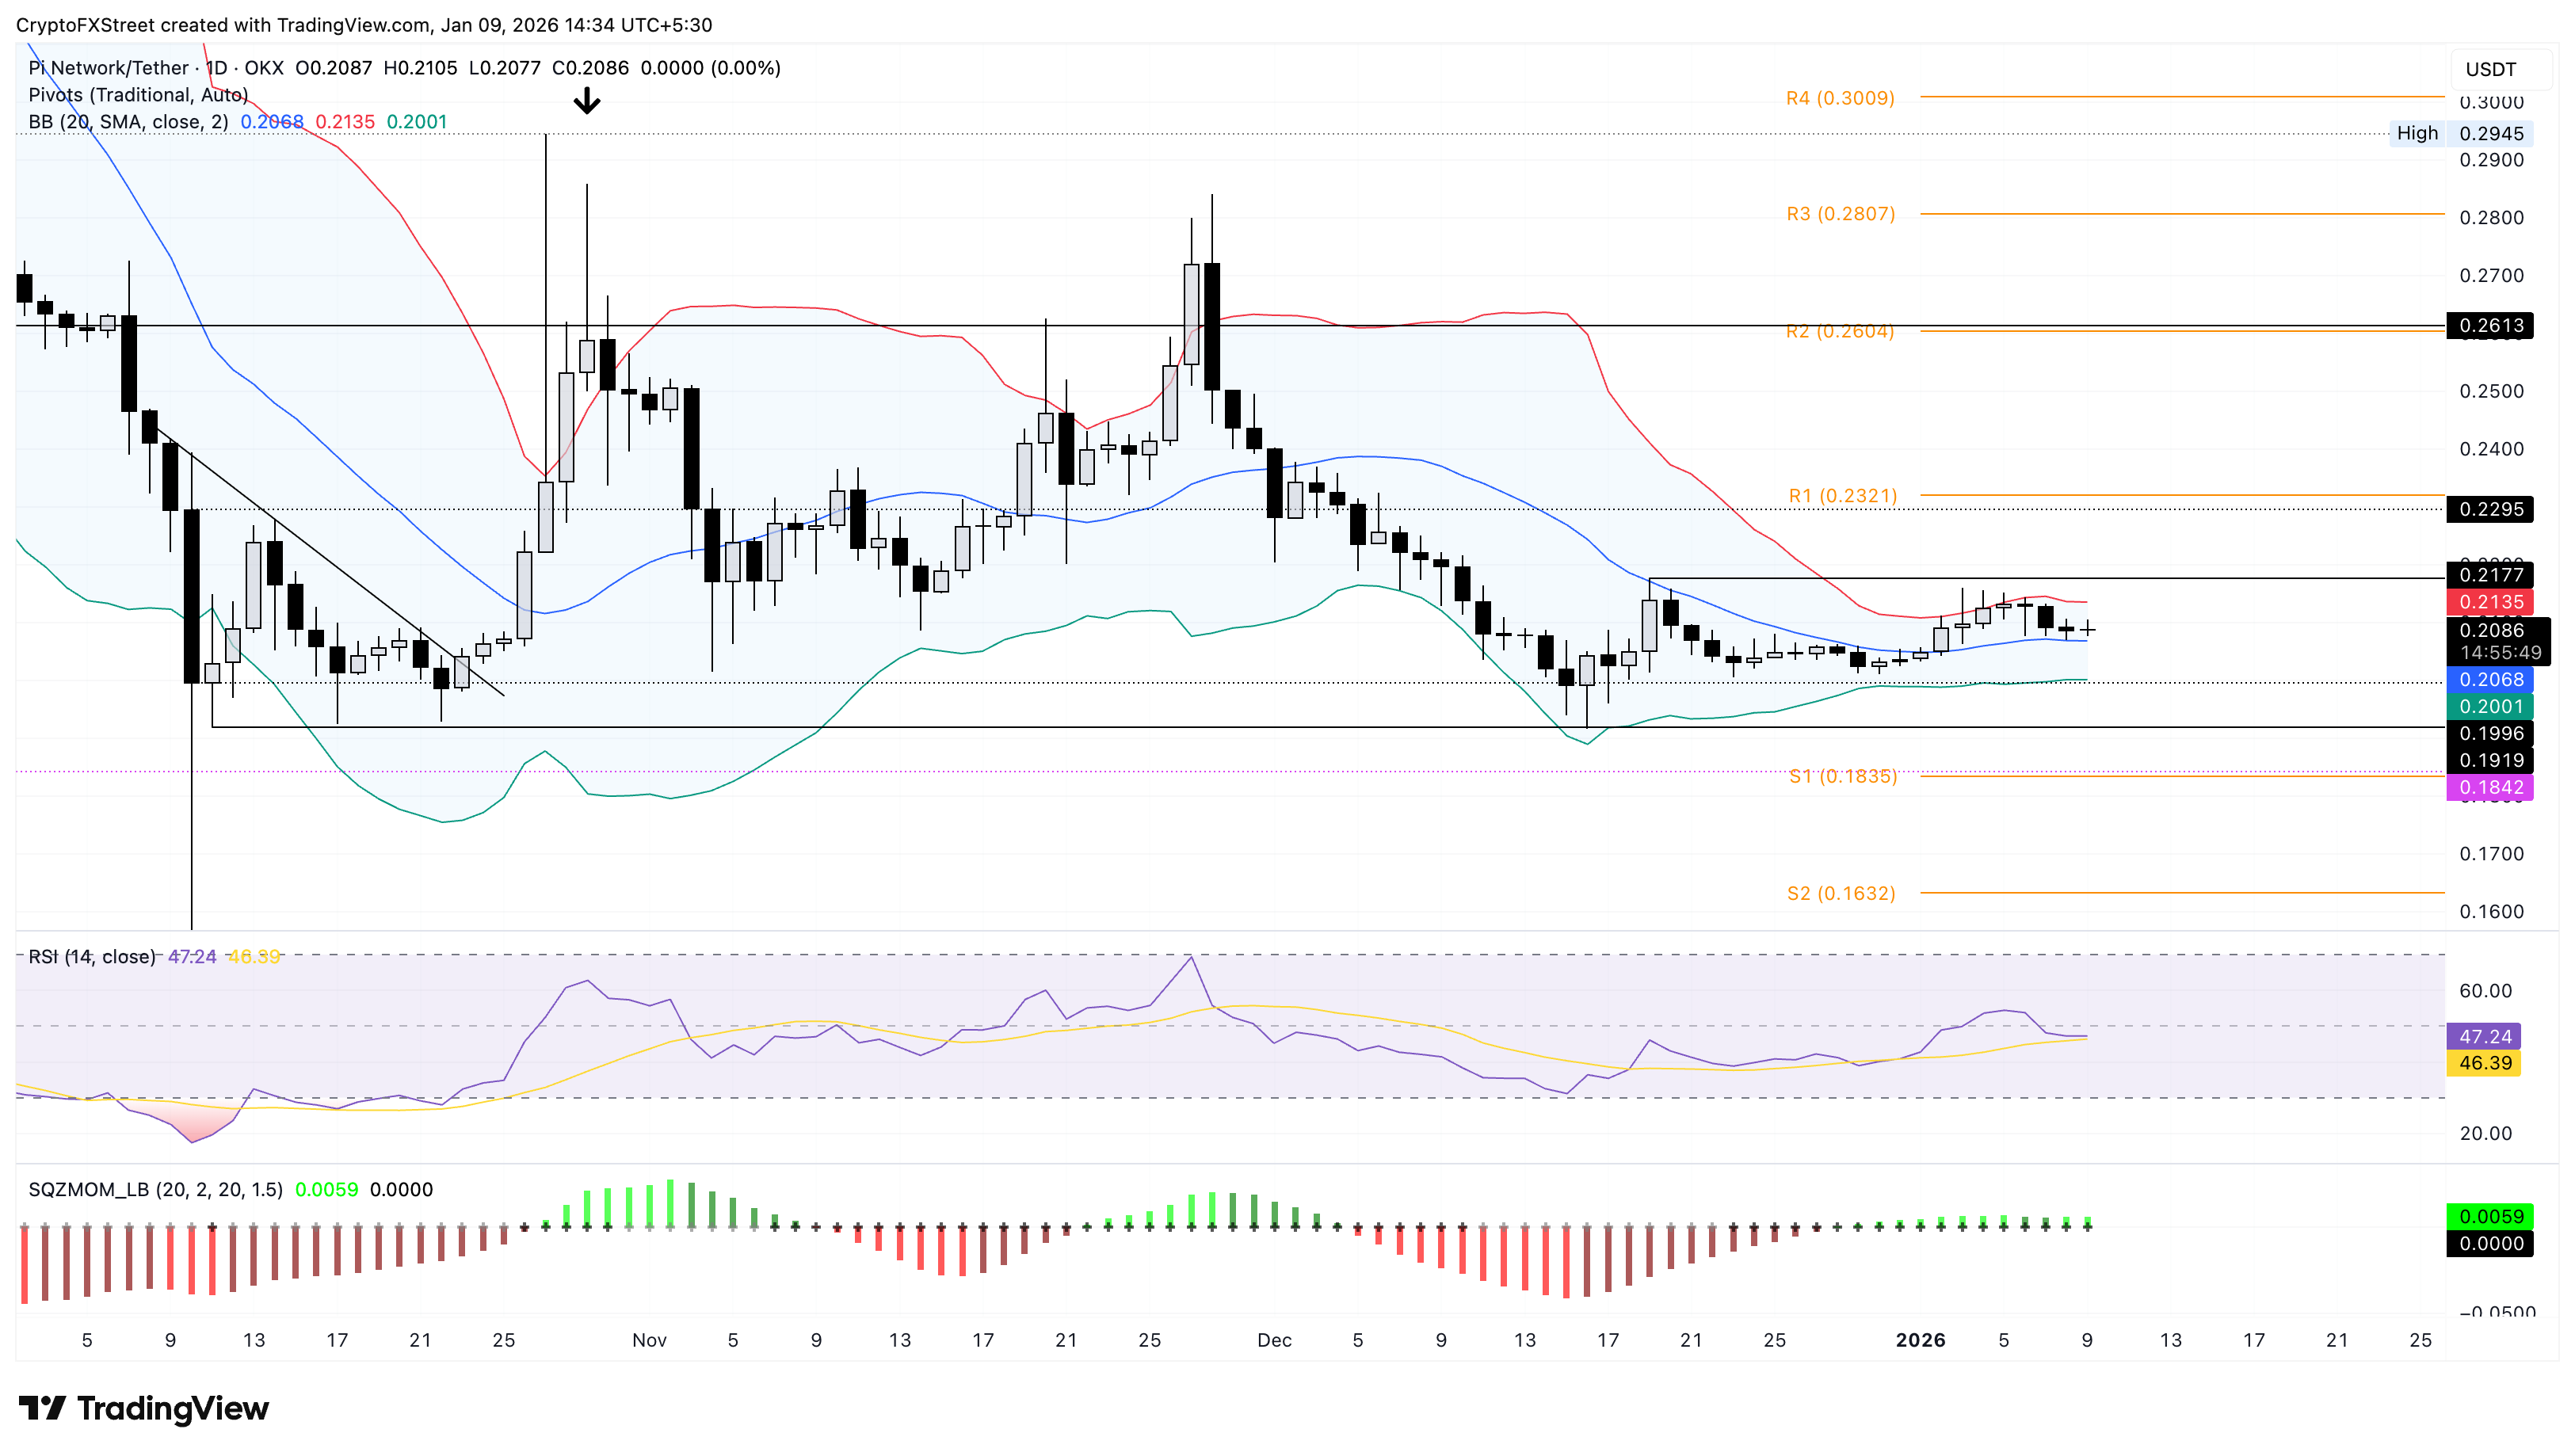
If PI slips below $0.2068, it could threaten the $0.2000 psychological support, potentially extending the decline to the S1 Pivot Point at $0.1835.

FXStreet
Plus d’un million d’utilisateurs se tournent vers FXStreet pour des données de marché en temps réel, des outils de graphiques, des analyses d’experts et des actualités Forex. Leur calendrier économique complet et leurs webinaires éducatifs aident les traders à rester informés et à prendre des décisions éclairées. FXStreet s’appuie sur une équipe d’environ 60 professionnels répartis entre le siège de Barcelone et diverses régions du monde.
Read More


