
Trade The World
Pi Network Price Forecast: PI stabilizes as CEXs outflow reduce selling pressure
Par Vishal Dixit
Date de publication: 5 Nov 2025 | Date de modification: 5 Nov 2025


POPULAR ARTICLES

Pi Network (PI) trades above $0.2100 at press time on Wednesday, after a 5.49% loss on Tuesday. Amid the intraday struggle and the prevailing downtrend, the on-chain data reflects support from large wallet investors and retail traders.
- Pi Network bulls hold ground at the $0.2000 psychological support after two consecutive days of pullback.
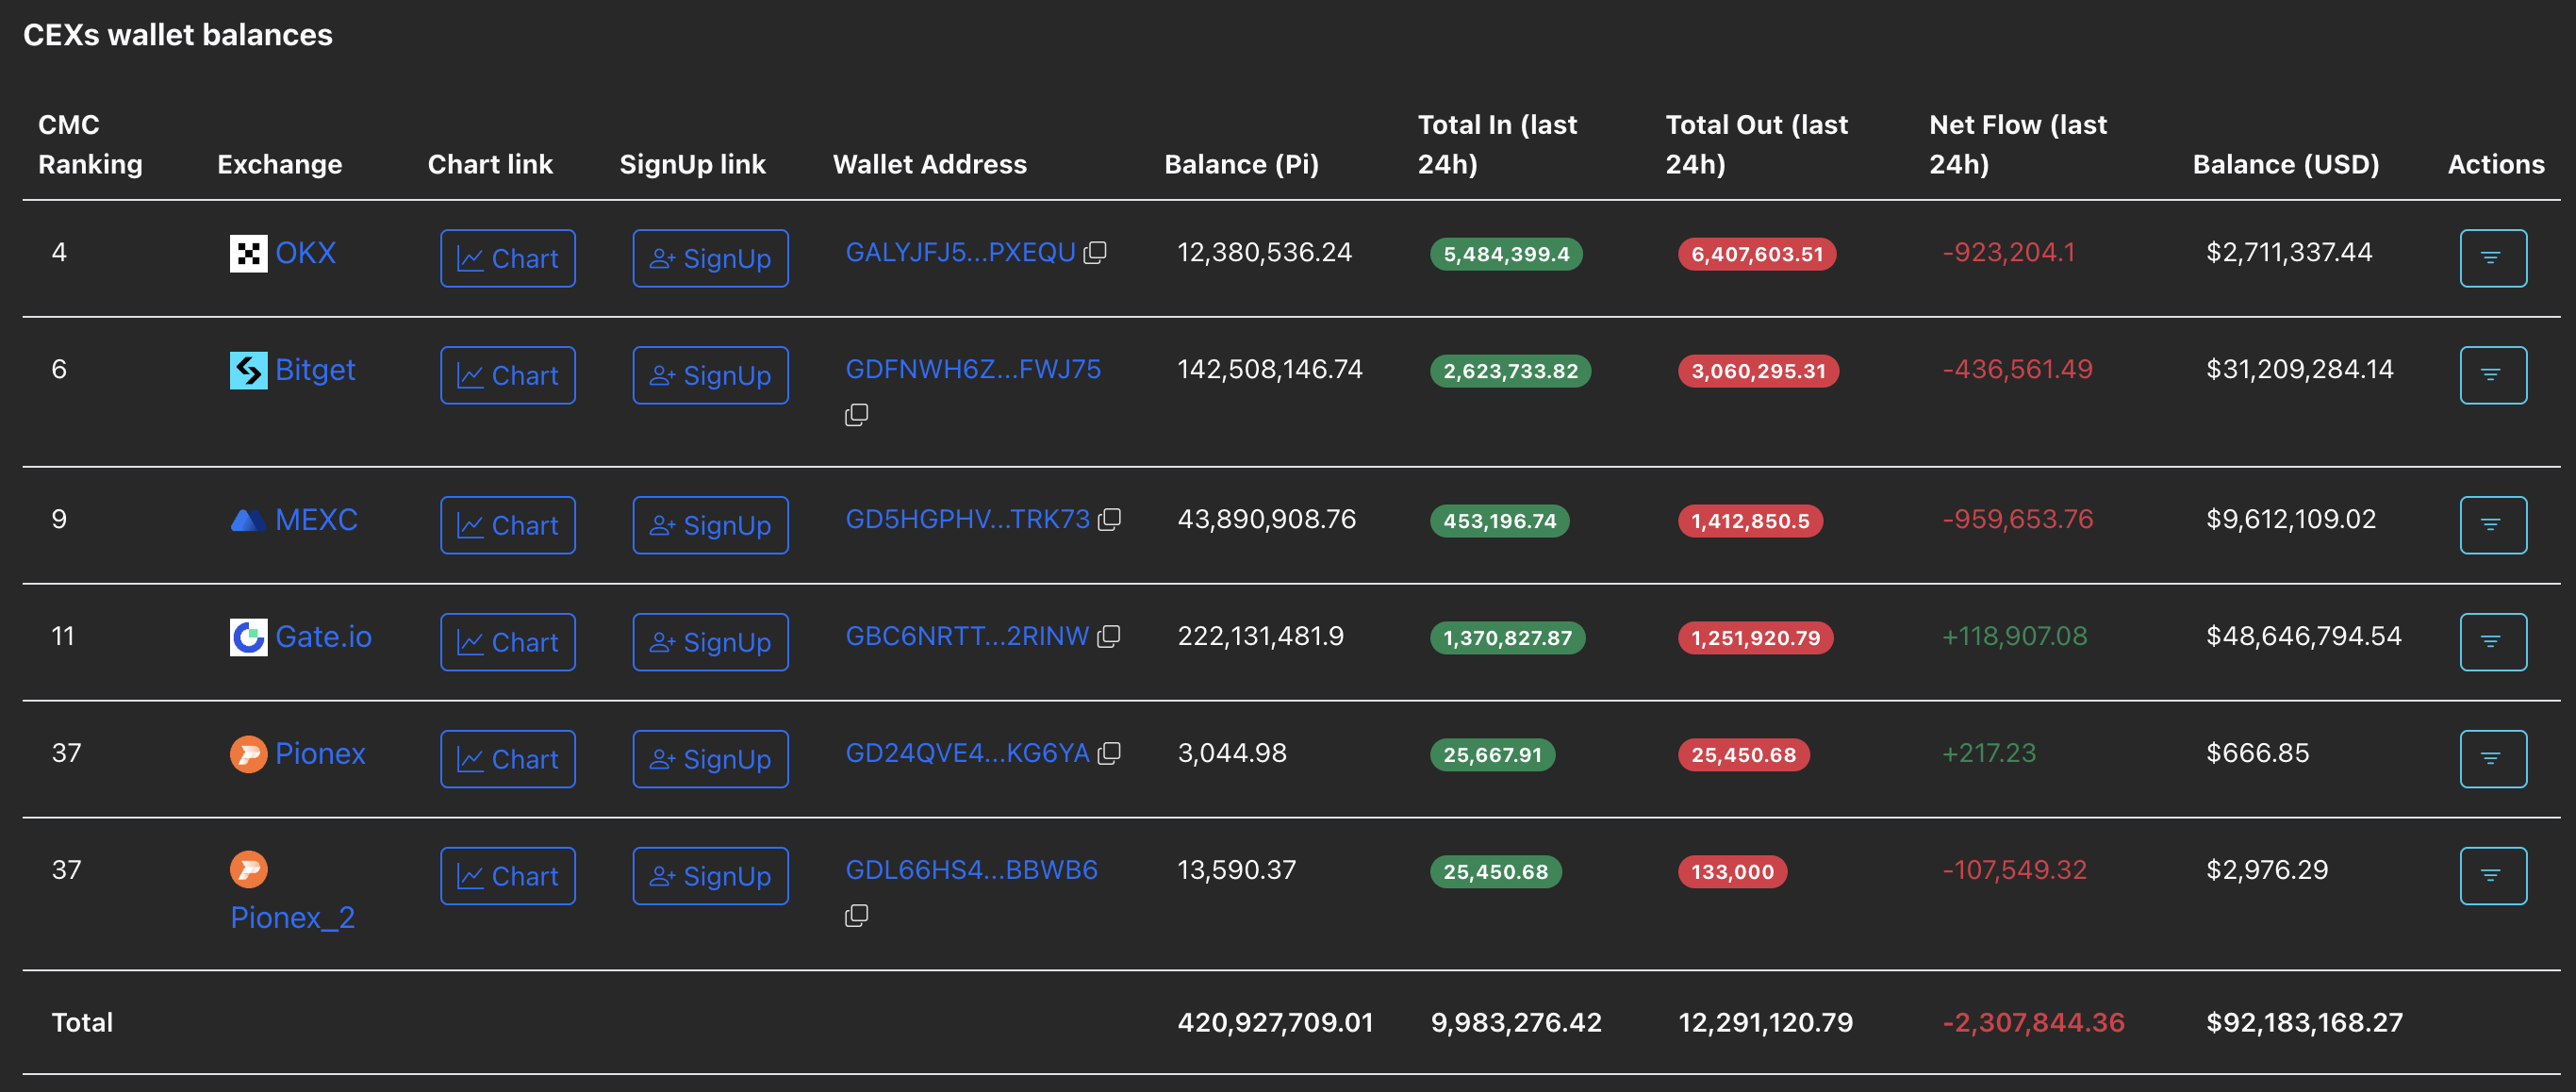
- Centralized exchanges' wallet balances record an outflow of over 2 million PI tokens, suggesting traders are buying the dip.
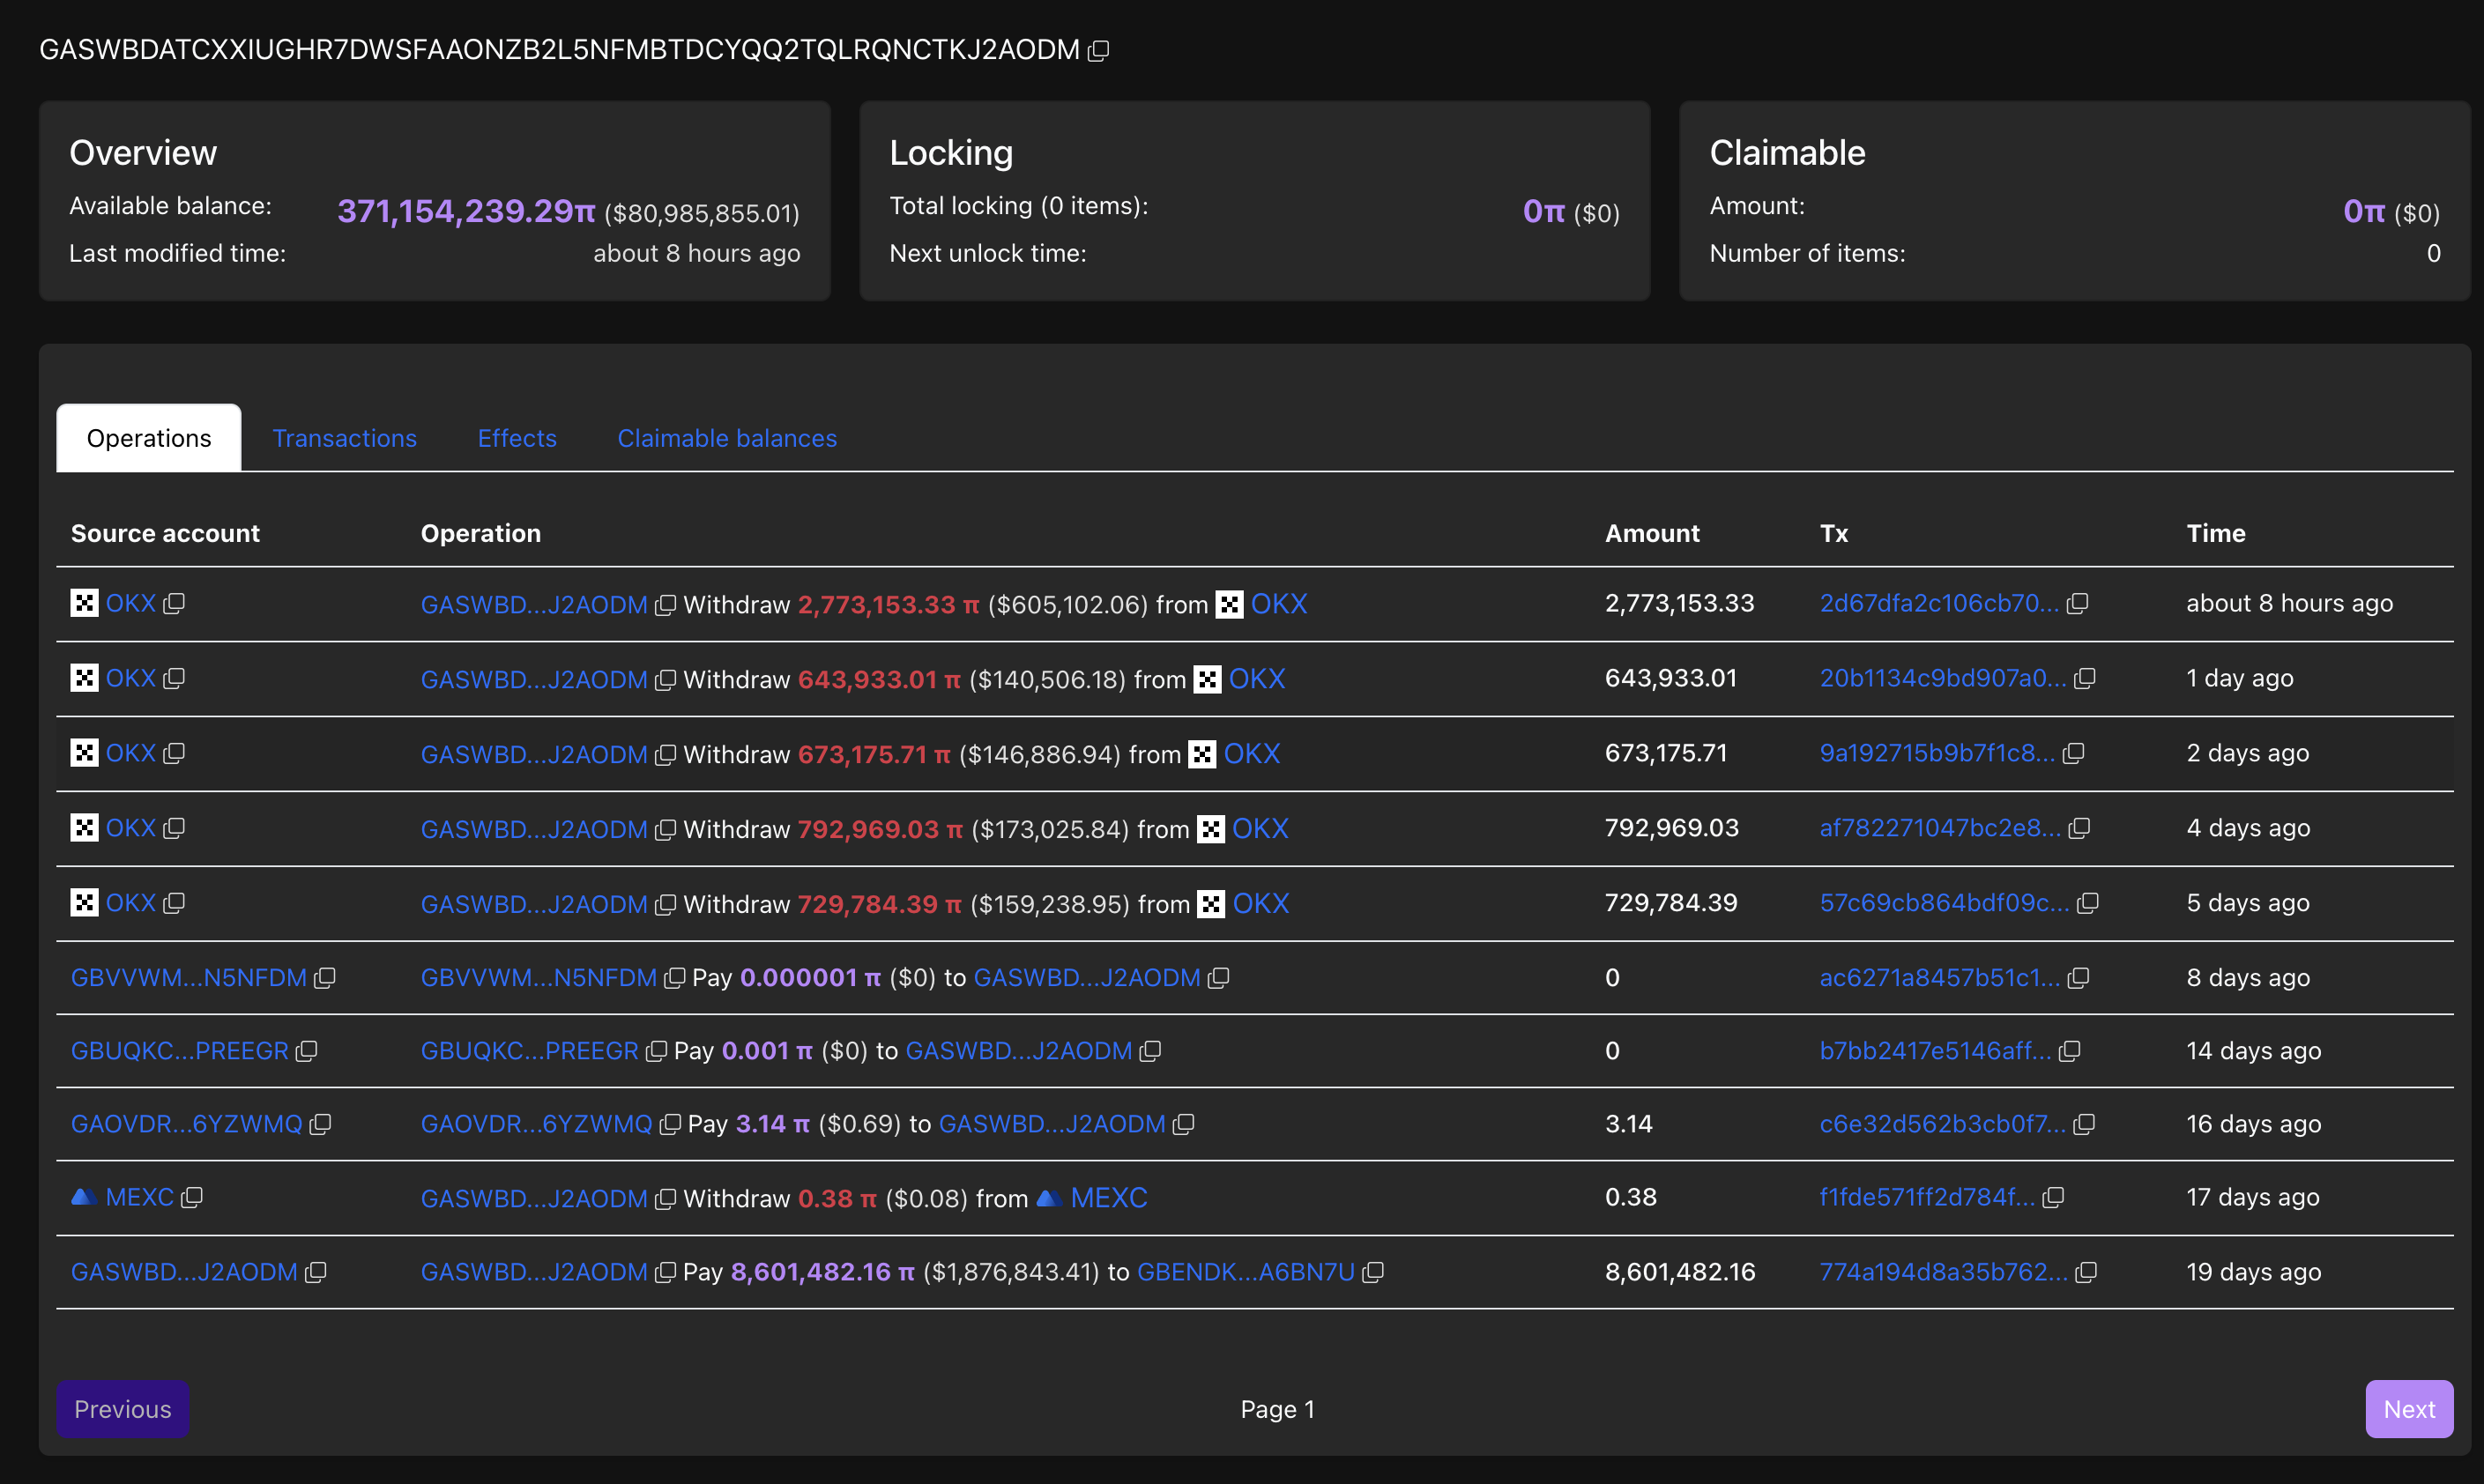
- A large wallet investor acquired 2.77 million PI tokens, marking the largest transaction in the last 24 hours.
Pi Network (PI) trades above $0.2100 at press time on Wednesday, after a 5.49% loss on Tuesday. Amid the intraday struggle and the prevailing downtrend, the on-chain data reflects support from large wallet investors and retail traders.
Still, the technical outlook indicates a bearish shift incoming in the trend momentum.
Steady on-exchange demand for PI
PiScan data shows a net outflow of 2.30 million PI tokens in the last 24 hours from the Know-Your-Business (KYB) verified Centralized Exchanges (CEXs) wallet balances. This indicates a 0.5481% decline in supply available on CEXs, reducing the selling pressure.
In the same line, the sixth-largest wallet on Pi Network acquired 2.77 million PI tokens, increasing its holdings to 371,154,239 tokens. This marked the largest transaction on the network in the last 24 hours, which could potentially lift the traders’ mood. Notably, the large wallet investor, commonly referred to as a whale, has been buying PI tokens for the last five consecutive days.
A steady reduction in supply pressure, as large wallet investors remain confident, sets the stage for a potential rebound in Pi coin.
Pi Network struggles to hold bullish momentum
Pi Network edges higher by over 2% at press time on Wednesday, bouncing off the $0.2063 low from earlier on the day. The intraday recovery aims for the 50-day Exponential Moving Average (EMA) at $0.2555, which acted as a dynamic resistance for the fourth time last week.
If PI marks a successful close above $0.2555, it could extend the uptrend to the August 1 low at $0.3220.
The technical indicators on the daily chart suggest a decline in buying pressure after PI reversed from the 50-day EMA last week. The Relative Strength Index (RSI) is at 42, standing between the halfway point and the oversold zone. At the same time, the Moving Average Convergence Divergence (MACD) retraces to the signal line, risking a crossover, which would confirm a renewal in bearish momentum.
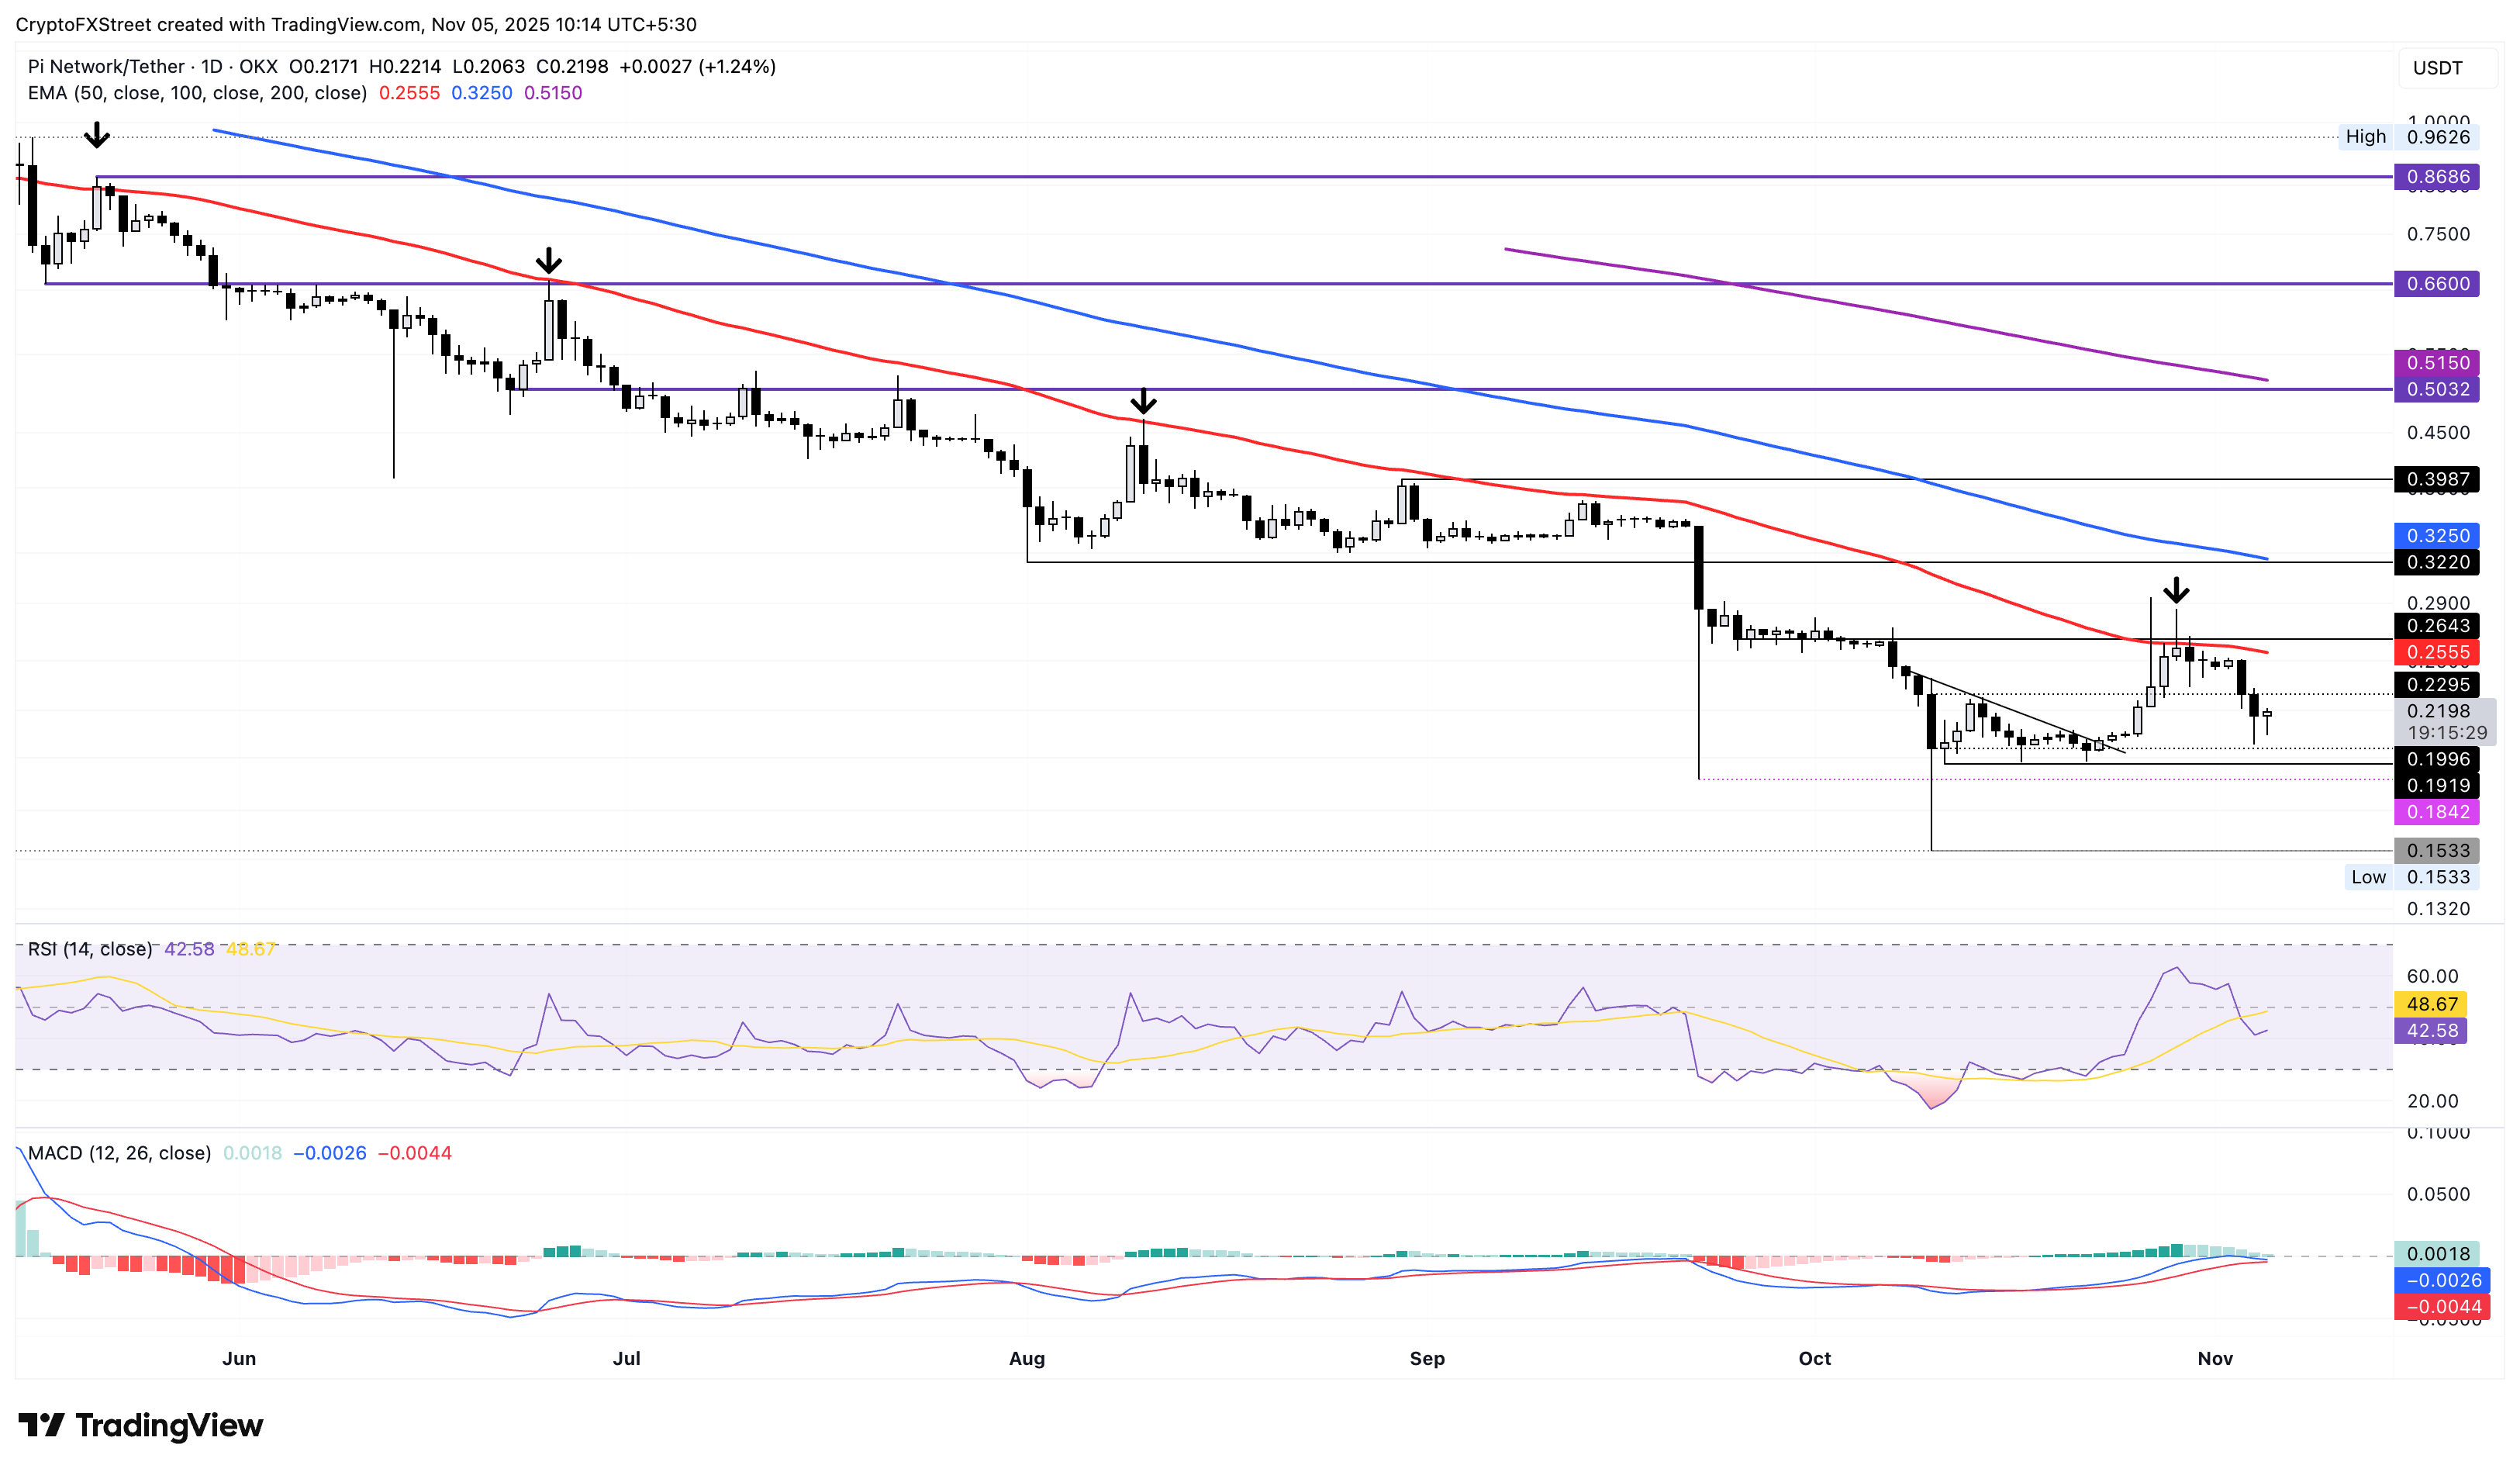
Looking down, the key support for PI remains the $0.1919 low from October 11.
Cryptocurrency prices FAQs
Token launches influence demand and adoption among market participants. Listings on crypto exchanges deepen the liquidity for an asset and add new participants to an asset’s network. This is typically bullish for a digital asset.
A hack is an event in which an attacker captures a large volume of the asset from a DeFi bridge or hot wallet of an exchange or any other crypto platform via exploits, bugs or other methods. The exploiter then transfers these tokens out of the exchange platforms to ultimately sell or swap the assets for other cryptocurrencies or stablecoins. Such events often involve an en masse panic triggering a sell-off in the affected assets.
Macroeconomic events like the US Federal Reserve’s decision on interest rates influence crypto assets mainly through the direct impact they have on the US Dollar. An increase in interest rate typically negatively influences Bitcoin and altcoin prices, and vice versa. If the US Dollar index declines, risk assets and associated leverage for trading gets cheaper, in turn driving crypto prices higher.
Halvings are typically considered bullish events as they slash the block reward in half for miners, constricting the supply of the asset. At consistent demand if the supply reduces, the asset’s price climbs.

FXStreet
Plus d’un million d’utilisateurs se tournent vers FXStreet pour des données de marché en temps réel, des outils de graphiques, des analyses d’experts et des actualités Forex. Leur calendrier économique complet et leurs webinaires éducatifs aident les traders à rester informés et à prendre des décisions éclairées. FXStreet s’appuie sur une équipe d’environ 60 professionnels répartis entre le siège de Barcelone et diverses régions du monde.
Read More


